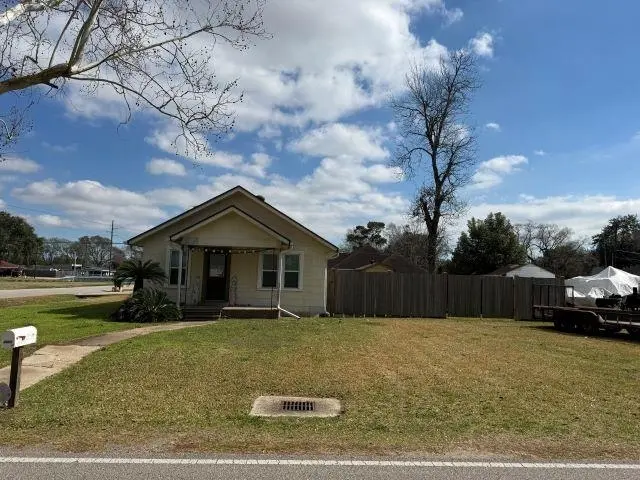
2401 8th St · Port Neches, TX
Flood risk 4/10 · Minor
- FEMA flood zone
- X
- Chance of flooding over 30 yrs
- 0.13%
- Est. flood insurance / yr
- $507 – $1,088
Fire risk 1/10 · Minimal
- Est. fire insurance / yr
- $1,222 – $2,270
Heat risk 9/10 · Severe
- Hot days now (above 110°F)
- 7 days/yr
- Hot days in 30 yrs
- 24 days/yr
Wind risk 9/10 · Severe
- Chance of severe wind over 30 yrs
- 99.0%
Air-quality risk 2/10 · Minimal
- Unhealthy air days now
- 1 days/yr
- Unhealthy air days in 30 yrs
- 1 days/yr
Risk factors via First Street. Map © Google.
Why this score? — see what drove the C- grade
The composite is a weighted blend of 9 inputs, each scored 0–100. Each bar is that input's sub-score; the figure is the points it added to the 100-point composite (weight × sub-score).
- Cash flow +18.4/30.0
- ARV discount +9.9/15.0
- DSCR +5.8/10.0
- 1% rule +4.9/10.0
- Schools +4.5/10.0
- Livability +3.8/5.0
- Rent growth +2.5/5.0
- Condition / age +2.5/5.0
- Appreciation +0.0/10.0
$165,000
🖨 Deal sheet 📄 Offer letter ✓ Due diligence
Listing remarks MLS
Currently tenant occupied this adorable home is located in Port Neches, Texas and Nederland ISD. Required a one-day notice for showings. Newer windows installed and electrical has been upgraded. Located on a large corner lot with 2 bedrooms and an indoor laundry room large enough it could also host a third bedroom. The backyard is fenced in with room for a pool. An oversized two car garage faces the side street. Don't miss this 2/1/2 or possibly a 2/2/2 located in Port Neches. Call your buyer's agent today for a tour.
Key facts
- Electrical upgraded
- Room for a pool
- Large corner lot
Tags
Neighborhood map
What this means for you Summary
Snapshot
- This is a 2-bed/1.0-bath single-family listed at $165k.
Deal economics
- At list price, monthly cash flow is $154 ($2k/yr) — positive.
- The deal already cash-flows at list — no discount required.
- To meet the 1% rule (rent ≥ 1% of price), the offer needs to be $163k (0.9% below list).
- Recommended offer: $150k (9.0% below list) — sets the bar for market timing.
- Cap rate 7.4% vs local median 4.7% in Port Neches — top-decile yield for the area; either an underpriced asset or a hidden risk that comps aren't pricing in. Stress-test before assuming the spread holds.
Location & tenants
- Location reads 75/100 on livability (#139 in TX, #3,996 nationally) — a middle-class / working-renter tenant base. Strengths: employment A+, cost of living A+, housing A+; Watch: amenities F, commute F.
- Nederland ISD (suburban): math 51% / reading 52% proficiency, ranked #138 of 826 in TX (top 17%) — acceptable for families but not a draw, mixed tenant base, ~2y average lease.
- Market conditions: 96 active listings in the ZIP; 9 comparable units currently listed for rent nearby; rentals leasing fast (median 14d on market — plan ~1-2 weeks tenant-placement turnaround); 343 units permitted in Jefferson County in 2024 (0 in 5+ unit buildings).
Forward outlook
- Local home prices are declining (-3.0%/yr); year-one equity from $1k of loan paydown is wiped out by about $5k of value loss. Plan a longer hold.
Negotiation context
- It's been on market 113 days — a 9% lower offer ($150k) is reasonable based on typical stale-listing flexibility.
Risks & watch-outs
- Climate carrying-cost: severe wind risk, 99% chance of damaging wind over 30y; extreme-heat days projected 7→24/yr by 2055 (HVAC capex compounding) — expect insurance premiums to compound above CPI over the hold.
Questions for the listing agent
- It's been on market 113 days. Have you received any prior offers? Is the seller open to a 9% concession, seller financing, or rate buy-down credit?
- Built in 1962 — when were the roof, HVAC, electrical panel, plumbing, and water heater last replaced?
- Why hasn't it sold? Are there any deal-killer items the seller is aware of (foundation, flood, title, zoning, code violations)?
- Is there a deadline driving the sale (1031 exchange, divorce, estate, relocation)? That informs how much negotiation room exists.
- Schools are B-rated — typically a magnet for longer-tenancy family renters. What's the average tenant stay here, and is there a school-zone premium baked into asking?
- What's the average days-on-market for RENTAL listings here right now (not sales)? A rising rental-DOM trend means longer vacancies and softer asking-rent achievability than the comps imply.
- What's the recent tenant-quality profile in this submarket — average credit score on applications, eviction rate, late-payment / NSF rate, and stable-employment percentage? A property-management company in the area should have these aggregated.
- How much new for-sale + rental construction is in the pipeline within 1–3 miles? Heavy new supply typically softens prices + rents 12–24 months out; constrained supply supports both.
Investment metrics
- 1% rule
- 0.99% ✗
- Cap rate
- 7.42%
- Cash-on-cash
- 4.01%
- DSCR
- 1.18
- GRM
- 8.4
CMA / ARV
- ARV (median comp)
- $174,242
- List price
- $165,000
- Delta
- -5.30%
- Verdict
- FAIR
- Comps
- 20 within 1.0 mi
Show comp detail 9 sales within ~0.75 mi
| Address | Dist | Beds/Ba | Sqft | Sold | Price | $/sf | Match |
|---|---|---|---|---|---|---|---|
| 720 S 2nd St | 0.17mi | 3/1.0 (+1) | 1,233 (-1%) | 9mo | $175,000 | $142 | 77 |
| 108 S 2nd 1/2 St | 0.54mi | 3/1.5 (+1) | 1,256 (+1%) | 3mo | $210,000 | $167 | 64 |
| 2602 15th St | 0.48mi | 2/1.0 | 1,082 (-13%) | 4mo | $124,900 | $115 | 52 |
| 908 Gulf Ave | 0.69mi | 3/2.0 (+1) | 1,315 (+5%) | 8mo | $150,000 | $114 | 44 |
| 116 S 4th 1/2 St | 0.61mi | 3/2.0 (+1) | 1,352 (+8%) | 14mo | $169,900 | $126 | 37 |
| 204 S 2 1/2 St | 0.47mi | 3/1.0 (+1) | 1,406 (+13%) | 19mo | $192,500 | $137 | 36 |
| 623 S 8th St | 0.65mi | 3/2.0 (+1) | 1,384 (+11%) | 10mo | $178,500 | $129 | 34 |
| 211 S 5 1/2 St | 0.64mi | 3/2.5 (+1) | 1,425 (+14%) | 11mo | $265,000 | $186 | 26 |
| 607 S 9th St | 0.72mi | 3/1.0 (+1) | 1,086 (-13%) | 18mo | $155,000 | $143 | 25 |
Match score weights: distance 35% · size 25% · config 20% · recency 20%. Top-matched comps best support the ARV.
Projected returns pro-forma
-3.0% appreciation · 3.0% rent growth · sell at horizon
- IRR
- -10.0%
- Equity multiple
- 0.63×
- Total profit
- $-16,885
- Equity at exit
- $24,602
- IRR
- -0.6%
- Equity multiple
- 0.96×
- Total profit
- $-1,954
- Equity at exit
- $14,266
Cash invested: $46,200 (down + closing). Projections, not guarantees.
Landlord ↔ Tenant lean methodology
- Overall (STATE)
- 87 Strongly Landlord-Friendly
- State Texas
- 87 Strongly Landlord-Friendly · R+5
- County
- — inherits STATE
- City
- — inherits STATE
ZIP-level market 77651
- Active inventory
- 96
- Price-to-rent
- 8.4×
Monthly cashflow live
- Estimated rent
- $1,635 high interval (Pro) →
- Mortgage (P&I)
- −$865
- Tax from tax record
- −$203 /mo · $2,436/yr
- Insurance
- −$69
- HOA
- −$0
- Vacancy / Maint / Mgmt
- −$343
- Net cashflow
- $154
Break-even live
UW: 25.0% down · 7.5% · 30yr · 1.5% tax · 5.0% vac · 8.0% maint · 8.0% mgmt
Financing live
Cash to close
- Down payment
- $41,250
- Closing costs
- $4,950
- Reserves months
- —
- Total cash needed
- —
Loan-product check · same deal, 3 products live
Conventional
25% down · 7.5% · 30yr
- Down + closing
- —
- Monthly P&I
- —
- Monthly cashflow
- —
- DSCR
- —
- Eligible?
- —
Personal DTI + credit; lowest rate.
DSCR
20% down · 8.5% · 30yr
- Down + closing
- —
- Monthly P&I
- —
- Monthly cashflow
- —
- DSCR
- —
- Eligible?
- —
No personal income docs; deal must DSCR.
Hard money
10% down · 12.0% · 12mo
- Down + closing
- —
- Monthly P&I
- —
- Monthly cashflow
- —
- DSCR
- —
- Eligible?
- —
Short-term bridge; refi at stabilization.
Rent comps 9 comps
| Address | Beds | Baths | Sqft | Rent | $/sqft | DOM | Units | Dist |
|---|---|---|---|---|---|---|---|---|
| 608 S 2nd St Nederland, TX | 3.0 | 1.0 | 936 | $1,600 | $1.71 | 13d | 1 | 0.25mi |
| 812 S 6th St Nederland, TX | 3.0 | 1.0 | 996 | $1,500 | $1.51 | 13d | 1 | 0.55mi |
| 311 Nederland Ave Nederland, TX | 3.0 | 2.0 | 1360 | $1,890 | $1.39 | 13d | 1 | 0.56mi |
| 1003 Avenue B Nederland, TX | 1.0–2.0 | 1.0 | 726 | $1,050 | $1.45 | 13d | 7 | 0.97mi |
| 2150 Merriman St Port Neches, TX | 2.0 | 1.0 | 800 | $1,995 | $2.49 | 13d | 1 | 0.99mi |
| 2140 Merriman St Port Neches, TX | 2.0 | 1.0 | 800 | $1,995 | $2.49 | 13d | 1 | 0.99mi |
| 1107 S 16th St Unit 1 Nederland, TX | 2.0 | 1.0 | 1395 | $1,250 | $0.90 | 13d | 1 | 1.31mi |
| 1619 Avenue G Unit G Nederland, TX | 3.0 | 1.5 | 1100 | $1,750 | $1.59 | 23d | 1 | 1.44mi |
| 307 Avenue E Port Neches, TX | 3.0 | 2.0 | 875 | $1,550 | $1.77 | 13d | 1 | 1.48mi |
Listing history 19 events
-
2026-06-18days on market $165,000 Active 113 DOM
-
2026-06-17days on market $165,000 Active 112 DOM
-
2026-06-16days on market $165,000 Active 111 DOM
-
2026-06-15days on market $165,000 Active 110 DOM
-
2026-06-14days on market $165,000 Active 108 DOM
-
2026-06-13pricedays on market $165,000 Active 107 DOM
-
2026-06-10days on market $175,000 Active 105 DOM
-
2026-06-09days on market $175,000 Active 104 DOM
-
2026-06-08days on market $175,000 Active 103 DOM
-
2026-06-07days on market $175,000 Active 102 DOM
-
2026-06-05days on market $175,000 Active 99 DOM
-
2026-06-03days on market $175,000 Active 98 DOM
-
2026-06-02days on market $175,000 Active 97 DOM
-
2026-06-01days on market $175,000 Active 96 DOM
-
2026-05-31days on market $175,000 Active 95 DOM
-
2026-05-30days on market $175,000 Active 94 DOM
-
2026-02-25$175,000 Active 523-char remark
Show marketing remark (523 chars)
Currently tenant occupied this adorable home is located in Port Neches, Texas and Nederland ISD. Required a one-day notice for showings. Newer windows installed and electrical has been upgraded. Located on a large corner lot with 2 bedrooms and an indoor laundry room large enough it could also host a third bedroom. The backyard is fenced in with room for a pool. An oversized two car garage faces the side street. Don't miss this 2/1/2 or possibly a 2/2/2 located in Port Neches. Call your buyer's agent today for a tour.
-
2017-03-03soldstatus
-
2005-06-20soldstatus
ⓘ Source: listings_history table (triggers on properties + properties_extension) + one-shot
backfill from property_details.listing_events for pre-trigger history.
Tax reassessment forecast TX · Resets to sale price
- Current annual tax
- $2,436 · $203/mo
- Projected year-2 tax
- $3,020 · $252/mo
- Expected delta
- +$583/yr (+$49/mo · 23.9%)
ⓘ Screening estimate from a state-policy table — verify with the county assessor before closing.
Climate risk First Street
- Flood 4/10 Moderate FEMA zone X · 13% chance over 30 yrs
- Wildfire 1/10 Low
- Heat 9/10 Extreme 7 d/yr ≥110°F today · 24 d/yr by 30 yrs out
- Wind 9/10 Extreme 99% chance of damaging wind over 30 yrs
- Air quality 2/10 Low 1 unhealthy d/yr today · 1 by 30 yrs out
Nearby sold comps map
Loading sold comps map…
Walkable amenities ~0.75 mi
Loading nearby amenities…
Taxation est. · year 1
- Rental income
- $19,616
- − Mortgage interest
- −$9,243
- − Property taxes
- −$2,436
- − Insurance
- −$825
- − Repairs & maintenance
- −$1,569
- − Management
- −$1,569
- − Depreciation
- −$4,800
- Taxable loss
- −$826
- Est. tax savings @ 24.0%
- +$198
- After-tax cash flow
- $2,050/yr
For passive investors: Depreciation is non-cash, so a rental often shows a tax loss while cash-flowing — sheltering income. Rental losses are passive: they offset passive income freely, and up to $25,000/yr can offset ordinary (W-2) income if you actively participate and your MAGI is under $100k (phasing out to $0 by $150k); unused losses carry forward. On sale, claimed depreciation is recaptured at up to 25%, and gains may owe capital-gains tax (a 1031 exchange can defer both). Figures are a year-1 estimate at your 24.0% rate — not tax advice; consult a CPA.
Schools (NCES district)
- District
- Nederland ISD
- NCES district ID
- 4832280
- Math proficiency
- 51% ▼ -3.00%
- Reading proficiency
- 52% ▼ -3.00%
- Median HH income
- $59,647
- Composite
- 44.95/100
- National rank
- #2709
- State rank
- #138 of 826 in TX
Livability — Port Neches
- Score
- 75/100
- State rank
- #139
- US rank
- #3996
Category grades
Schools grade is shown separately in the Schools card above.
Census & demographics
- Census place
- Port Neches, TX
- Population (ZIP)
- 13,627
Population outlook (Jefferson County) Hauer SSP2
- Today (2025)
- 259,015 people
- By 2030
- 260,685 · +0.6%
- By 2040
- 263,309 · +1.7%
- By 2050
- 265,237 · +2.4%
- By 2075
- 270,193 · +4.3%
- By 2100
- 255,628 · -1.3%
Race, ethnicity, and origin ACS 2023
- Neighborhood character
- Predominantly White (84%)
- Race & ethnicity
- White 84% Hispanic / Latino 9% Two or more races 9% Asian 2%
- Hispanic origin (detail)
- Mexican 8%
- Common ancestry
- Lithuanian 15% Romanian 2% Italian 1%
- Foreign-born
- 5% · Canada
- Languages at home
- 92% English-only · Spanish 4% Vietnamese 2% Other Indo-European 1%
Political lean MEDSL · Jefferson
- 2024 margin
- Lean R (+8.9) · D 45.1% · R 54.0%
- 2008→2024 swing
- -11.1pp toward R · 2008: 2.2pp · 2024: -8.9pp
- All cycles
- 2024: R+8.9 2020: R+1.6 2016: R+0.5 2012: D+1.6 2008: D+2.2
Not yet ingested
- Civics
- —
Market trends
- HPI YoY
- ▼ -187.68%
- Current HPI
- 186.228
- Rent YoY
- —
- Metro
- —
- State GDP YoY
- ▲ 3.95%
- F500 in state
- 110
Industry mix (Fortune 500 HQ in TX)
| Industry | F500 HQs | Revenue |
|---|---|---|
| Energy | 16 | $1,198B |
|
||
| Technology | 5 | $198B |
|
||
| Engineering / Construction | 4 | $72B |
|
||
| Energy Services | 3 | $60B |
|
||
| Utilities | 3 | $41B |
|
||
| Healthcare | 2 | $330B |
|
||
Price history
3 events — show timeline
- 2026-02-25 Listed $175,000 BBOR
- 2017-03-03 Sold (Public Records) — Public Records
- 2005-06-20 Sold (Public Records) — Public Records
Property tax history
+5.1%/yrLatest (2025): $2,436 · -7.2% YoY. Source: county tax records.
Cash-flow waterfall
monthlySold comps — $/sqft
last 12 mo · ≤1 miLoading sold comps…