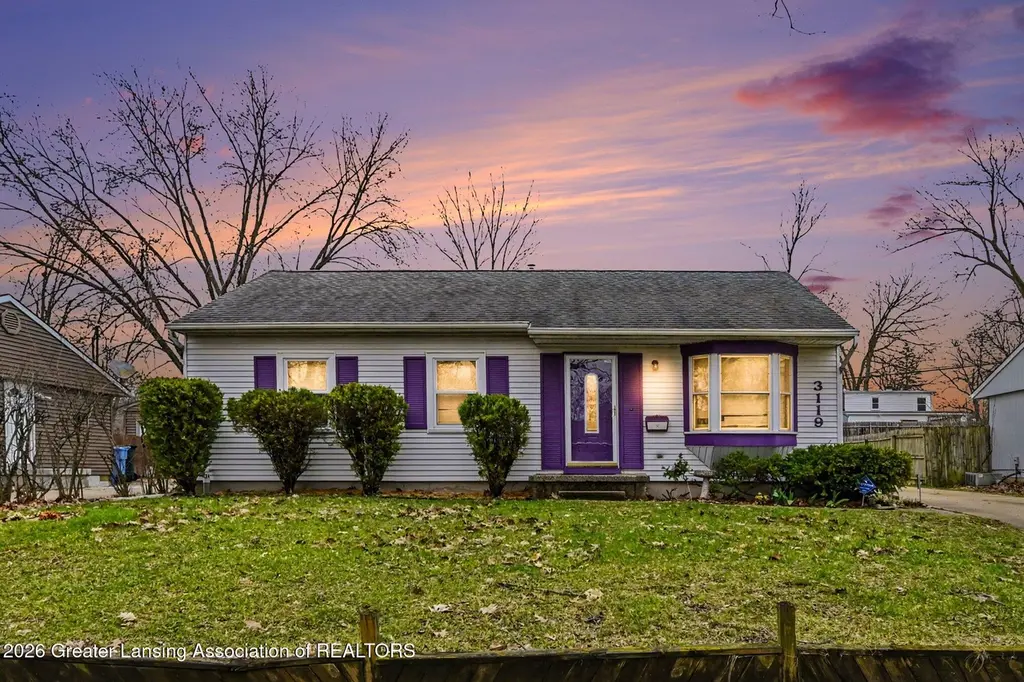
3119 Norwich Rd · Lansing, MI
Flood risk 1/10 · Minimal
- FEMA flood zone
- X (unshaded)
- Chance of flooding over 30 yrs
- 0.0%
- Est. flood insurance / yr
- $473 – $860
Fire risk 1/10 · Minimal
- Est. fire insurance / yr
- $784 – $1,456
Heat risk 2/10 · Minimal
- Hot days now (above 96°F)
- 7 days/yr
- Hot days in 30 yrs
- 16 days/yr
Wind risk 2/10 · Minimal
- Chance of severe wind over 30 yrs
- —
Air-quality risk 2/10 · Minimal
- Unhealthy air days now
- 1 days/yr
- Unhealthy air days in 30 yrs
- 2 days/yr
Risk factors via First Street. Map © Google.
Why this score? — see what drove the F grade
The composite is a weighted blend of 9 inputs, each scored 0–100. Each bar is that input's sub-score; the figure is the points it added to the 100-point composite (weight × sub-score).
- Cash flow +5.9/30.0
- Rent growth +5.0/5.0
- Livability +4.0/5.0
- Condition / age +2.5/5.0
- 1% rule +1.9/10.0
- Schools +1.9/10.0
- DSCR +0.3/10.0
- ARV discount +0.0/15.0
- Appreciation +0.0/10.0
$169,900
🖨 Deal sheet 📄 Offer letter ✓ Due diligence
Listing remarks MLS
Welcome to 3119 Norwich, a 3 bedroom 2 full bath ranch on a wonderful tree lined street. This cute house boasts a partially finished basement, a large detached garage, and a fenced in backyard. In addition, the furnace, AC, and range are all newer. Call or text for your private showing today!
Key facts
- Fenced in backyard
- 7,405 sq ft lot
- Garage
Tags
Neighborhood map
What this means for you Summary
Snapshot
- This is a 3-bed/1.0-bath single-family listed at $170k.
Deal economics
- At list price, monthly cash flow is $-333 ($-4k/yr) — negative.
- To cash-flow at today's rent, offer at most $111k (34.6% below list).
- To meet the 1% rule (rent ≥ 1% of price), the offer needs to be $117k (31.1% below list).
- Recommended offer: $111k (34.6% below list) — sets the bar for cash-flow.
- Cap rate 3.9% vs local median 6.0% in Lansing — below-typical yield; the buyer is paying a premium for something (appreciation thesis, condition, location) that the cap rate doesn't capture.
Location & tenants
- Location reads 79/100 on livability (#94 in MI, #2,182 nationally) — a middle-class / working-renter tenant base. Strengths: amenities A+, commute A+, cost of living A+; Watch: employment D, schools F, crime F.
- Lansing Public School District (urban): math 14% / reading 23% proficiency, ranked #650 of 760 in MI (top 86%) — low school quality limits family demand, transient renter base, plan for 1-2y turnover; 68% free/reduced lunch — lower-income household profile, screen leases tightly.
- Market conditions: Rents rising fast (+9.9%/yr); 143 active listings in the ZIP; 21 comparable units currently listed for rent nearby; rentals at typical pace (median 21d on market — plan ~3-4 weeks tenant-placement turnaround); 43% of comp listings sitting > 30 days — soft ceiling on asking rent; 350 units permitted in Ingham County in 2024 (186 in 5+ unit buildings).
Forward outlook
- Local home prices are declining (-3.0%/yr); year-one equity from $1k of loan paydown is wiped out by about $5k of value loss. Plan a longer hold.
- Ingham County population projected at +11% by 2050 — modest demand growth; plan on rents tracking national, not racing it.
Negotiation context
- Only 10 days on market — expect competitive offers; lowballing is unlikely to land.
- 5 sale attempts since 7y ago with the ask held roughly flat each time — persistent listings suggest the price (not the market) is what's stuck; bring a comps-based counter.
- Current owner paid $110k; list at $170k implies a 55% gain — meaningful room to come down on a strong offer.
Questions for the listing agent
- What do current leases actually rent for vs. the listed asking? Can we see a recent rent roll and the last 12 months of T-12 income?
- Built in 1971 — when were the roof, HVAC, electrical panel, plumbing, and water heater last replaced?
- Is there a deadline driving the sale (1031 exchange, divorce, estate, relocation)? That informs how much negotiation room exists.
- Schools are F-rated, which usually means shorter tenancies and higher turnover. Who's the typical renter profile here, and what's been the actual vacancy rate?
- Crime grade is F in this area — have there been break-ins, vandalism, or insurance claims at this property in the last 3 years? What carrier currently insures it and at what premium?
- The area grade is low — what's the realistic commute time and amenity access for the typical tenant pool here? Any planned neighborhood developments (good or bad) we should know about?
- What's the average days-on-market for RENTAL listings here right now (not sales)? A rising rental-DOM trend means longer vacancies and softer asking-rent achievability than the comps imply.
- What's the recent tenant-quality profile in this submarket — average credit score on applications, eviction rate, late-payment / NSF rate, and stable-employment percentage? A property-management company in the area should have these aggregated.
- How much new for-sale + rental construction is in the pipeline within 1–3 miles? Heavy new supply typically softens prices + rents 12–24 months out; constrained supply supports both.
Investment metrics
- 1% rule
- 0.69% ✗
- Cap rate
- 3.94%
- Cash-on-cash
- -8.40%
- DSCR
- 0.63
- GRM
- 12.1
CMA / ARV
- ARV (on-the-fly)
- $131,633
- Comps found
- 12
Show comp detail 12 sales within ~0.75 mi
| Address | Dist | Beds/Ba | Sqft | Sold | Price | $/sf | Match |
|---|---|---|---|---|---|---|---|
| 3211 S Deerfield Ave | 0.08mi | 2/1.0 (-1) | 912 (-4%) | 4mo | $127,000 | $139 | 82 |
| 3424 S Catherine St | 0.25mi | 3/1.0 | 929 (-2%) | 7mo | $169,000 | $182 | 79 |
| 3330 Avalon St | 0.37mi | 3/1.0 | 905 (-4%) | 4mo | $129,900 | $144 | 72 |
| 2816 Greenbelt Dr | 0.60mi | 3/1.0 | 963 (+2%) | 7mo | $104,300 | $108 | 64 |
| 3526 Berwick Dr | 0.42mi | 3/1.0 | 1,028 (+9%) | 6mo | $109,000 | $106 | 61 |
| 2813 Greenbelt Dr | 0.63mi | 3/1.0 | 894 (-6%) | 1mo | $120,000 | $134 | 61 |
| 2905 S Catherine St | 0.24mi | 2/1.0 (-1) | 1,056 (+12%) | 7mo | $150,000 | $142 | 59 |
| 4110 Richmond St | 0.74mi | 3/1.0 | 925 (-2%) | 6mo | $120,000 | $130 | 57 |
| 3115 Risdale Ave | 0.73mi | 3/1.0 | 973 (+3%) | 6mo | $50,000 | $51 | 57 |
| 3714 Brighton Dr | 0.62mi | 3/1.5 | 864 (-9%) | 2mo | $163,000 | $189 | 53 |
| 4018 Clayborn Rd | 0.72mi | 3/1.0 | 864 (-9%) | 5mo | $163,000 | $189 | 48 |
| 2039 Holly Way | 0.71mi | 3/1.0 | 1,081 (+14%) | 6mo | $135,000 | $125 | 38 |
Match score weights: distance 35% · size 25% · config 20% · recency 20%. Top-matched comps best support the ARV.
Projected returns pro-forma
-3.0% appreciation · 8.0% rent growth · sell at horizon
- IRR
- -25.2%
- Equity multiple
- 0.11×
- Total profit
- $-42,488
- Equity at exit
- $25,333
- IRR
- -10.1%
- Equity multiple
- 0.25×
- Total profit
- $-35,889
- Equity at exit
- $14,690
Cash invested: $47,572 (down + closing). Projections, not guarantees.
Landlord ↔ Tenant lean methodology
- Overall (STATE)
- 62 Landlord-Friendly
- State Michigan
- 62 Landlord-Friendly · EVEN
- County
- — inherits STATE
- City
- — inherits STATE
ZIP-level market 48911
- Rents YoY
- 9.9%
- Active inventory
- 143
- Price-to-rent
- 12.1×
Monthly cashflow live
- Estimated rent
- $1,170 high interval (Pro) →
- Mortgage (P&I)
- −$891
- Tax from tax record
- −$295 /mo · $3,545/yr
- Insurance
- −$71
- HOA
- −$0
- Vacancy / Maint / Mgmt
- −$246
- Net cashflow
- $-333
Break-even live
UW: 25.0% down · 7.5% · 30yr · 1.5% tax · 5.0% vac · 8.0% maint · 8.0% mgmt
Financing live
Cash to close
- Down payment
- $42,475
- Closing costs
- $5,097
- Reserves months
- —
- Total cash needed
- —
Loan-product check · same deal, 3 products live
Conventional
25% down · 7.5% · 30yr
- Down + closing
- —
- Monthly P&I
- —
- Monthly cashflow
- —
- DSCR
- —
- Eligible?
- —
Personal DTI + credit; lowest rate.
DSCR
20% down · 8.5% · 30yr
- Down + closing
- —
- Monthly P&I
- —
- Monthly cashflow
- —
- DSCR
- —
- Eligible?
- —
No personal income docs; deal must DSCR.
Hard money
10% down · 12.0% · 12mo
- Down + closing
- —
- Monthly P&I
- —
- Monthly cashflow
- —
- DSCR
- —
- Eligible?
- —
Short-term bridge; refi at stabilization.
Rent comps 21 comps
| Address | Beds | Baths | Sqft | Rent | $/sqft | DOM | Units | Dist |
|---|---|---|---|---|---|---|---|---|
| 2711 Dunlap St Lansing, MI | 3.0 | 1.0 | 1020 | $1,350 | $1.32 | 44d | 1 | 0.29mi |
| 2920 Hillcrest St Lansing, MI | 3.0 | 1.0 | 1040 | $1,225 | $1.18 | 43d | 1 | 0.47mi |
| 2815 Mersey Ln Lansing, MI | 2.0–3.0 | 2.0 | 1050 | $1,325 | $1.26 | 13d | 2 | 0.48mi |
| 2823 Hillcrest St Lansing, MI | 3.0 | 1.0 | 925 | $1,245 | $1.35 | 21d | 1 | 0.52mi |
| 3334 Pleasant Grove Rd Apt 10 Lansing, MI | 2.0 | 1.0 | 800 | $900 | $1.12 | 43d | 1 | 0.54mi |
| 3334 Pleasant Grove Rd Apt 15 Lansing, MI | 2.0 | 1.0 | 800 | $950 | $1.19 | 43d | 1 | 0.54mi |
| 3334 Pleasant Grove Rd Unit 19 Lansing, MI | 2.0 | 1.0 | 700 | $999 | $1.43 | 13d | 1 | 0.54mi |
| 3606 Pleasant Grove Rd Lansing, MI | 1.0–2.0 | 1.0 | 812 | $1,100 | $1.35 | 43d | 1 | 0.59mi |
| 4125 Ingham St Lansing, MI | 3.0 | 1.0 | 933 | $1,300 | $1.39 | 43d | 1 | 0.68mi |
| 2612 Fielding Dr Lansing, MI | 2.0 | 1.0 | 1100 | $1,095 | $1.00 | 43d | 1 | 0.69mi |
| 2114 Ferrol St Unit 1 Lansing, MI | 2.0 | 1.0 | 700 | $950 | $1.36 | 21d | 1 | 0.70mi |
| 3501 Simken Dr Lansing, MI | 2.0 | 1.0 | 900 | $950 | $1.06 | 43d | 1 | 0.71mi |
| 2009 W Holmes Rd Unit 11 Lansing, MI | 2.0 | 1.0 | 800 | $925 | $1.16 | 13d | 1 | 0.74mi |
| 3407 W Mount Hope Ave Lansing, MI | 2.0 | 2.0 | 1000 | $995 | $0.99 | 13d | 1 | 0.74mi |
| 3313 W Mt Hope Ave Lansing, MI | 2.0 | 1.0–2.0 | 869 | $1,296 | $1.49 | 13d | 6 | 0.80mi |
| 4318 Pleasant Grove Rd Lansing, MI | 1.0–3.0 | 1.0–2.0 | 722 | $1,350 | $1.87 | 13d | 1 | 0.89mi |
| 3530 W Jolly Rd Unit 6 Lansing, MI | 2.0 | 1.0 | 1049 | $1,100 | $1.05 | 21d | 1 | 1.18mi |
| 1815 Potomac Cir Lansing, MI | 2.0 | 1.0 | 1002 | $1,200 | $1.20 | 13d | 1 | 1.20mi |
| 915 Loa St Lansing, MI | 2.0 | 1.0 | 674 | $999 | $1.48 | 43d | 1 | 1.40mi |
| 4030 Hartford Rd Lansing, MI | 1.0–2.0 | 1.0 | 640 | $1,094 | $1.71 | 13d | 42 | 1.48mi |
| 1001 W Cavanaugh Rd Lansing, MI | 1.0–2.0 | 1.0 | 775 | $850 | $1.10 | 13d | 4 | 1.50mi |
Listing history 16 events
-
2026-04-16status Pending 293-char remark
Show marketing remark (293 chars)
Welcome to 3119 Norwich, a 3 bedroom 2 full bath ranch on a wonderful tree lined street. This cute house boasts a partially finished basement, a large detached garage, and a fenced in backyard. In addition, the furnace, AC, and range are all newer. Call or text for your private showing today!
-
2026-04-16status Pending
Show marketing remark (293 chars)
Welcome to 3119 Norwich, a 3 bedroom 2 full bath ranch on a wonderful tree lined street. This cute house boasts a partially finished basement, a large detached garage, and a fenced in backyard. In addition, the furnace, AC, and range are all newer. Call or text for your private showing today!
-
2026-04-06$169,900 Active 293-char remark
Show marketing remark (293 chars)
Welcome to 3119 Norwich, a 3 bedroom 2 full bath ranch on a wonderful tree lined street. This cute house boasts a partially finished basement, a large detached garage, and a fenced in backyard. In addition, the furnace, AC, and range are all newer. Call or text for your private showing today!
-
2026-04-06$169,900 Active
Show marketing remark (293 chars)
Welcome to 3119 Norwich, a 3 bedroom 2 full bath ranch on a wonderful tree lined street. This cute house boasts a partially finished basement, a large detached garage, and a fenced in backyard. In addition, the furnace, AC, and range are all newer. Call or text for your private showing today!
-
2025-09-22historical
-
2025-08-26price $169,900
-
2025-08-26price $169,900
-
2025-07-31price $179,900
-
2025-07-31price $179,900
-
2025-07-15$189,900 Active
-
2019-07-09soldstatus $109,900
-
2019-06-28soldstatus $109,900
-
2019-06-28soldstatus $109,900
-
2019-05-01$109,900
-
2019-05-01$109,900
-
2002-11-08soldstatus $109,000
ⓘ Source: listings_history table (triggers on properties + properties_extension) + one-shot
backfill from property_details.listing_events for pre-trigger history.
Tax reassessment forecast MI · Partial reset (capped growth)
- Current annual tax
- $3,545 · $295/mo
- Projected year-2 tax
- $3,545 · $295/mo
- Expected delta
- $0/yr ($0/mo · 0.0%)
ⓘ Screening estimate from a state-policy table — verify with the county assessor before closing.
Climate risk First Street
- Flood 1/10 Low FEMA zone X (unshaded) · 0% chance over 30 yrs
- Wildfire 1/10 Low
- Heat 2/10 Low 7 d/yr ≥96°F today · 16 d/yr by 30 yrs out
- Wind 2/10 Low
- Air quality 2/10 Low 1 unhealthy d/yr today · 2 by 30 yrs out
Nearby sold comps map
Loading sold comps map…
Walkable amenities ~0.75 mi
Loading nearby amenities…
Taxation est. · year 1
- Rental income
- $14,038
- − Mortgage interest
- −$9,517
- − Property taxes
- −$3,545
- − Insurance
- −$850
- − Repairs & maintenance
- −$1,123
- − Management
- −$1,123
- − Depreciation
- −$4,943
- Taxable loss
- −$7,062
- Est. tax savings @ 24.0%
- +$1,695
- After-tax cash flow
- $-2,301/yr
For passive investors: Depreciation is non-cash, so a rental often shows a tax loss while cash-flowing — sheltering income. Rental losses are passive: they offset passive income freely, and up to $25,000/yr can offset ordinary (W-2) income if you actively participate and your MAGI is under $100k (phasing out to $0 by $150k); unused losses carry forward. On sale, claimed depreciation is recaptured at up to 25%, and gains may owe capital-gains tax (a 1031 exchange can defer both). Figures are a year-1 estimate at your 24.0% rate — not tax advice; consult a CPA.
Schools (NCES district)
- District
- Lansing Public School District
- NCES district ID
- 2621150
- Math proficiency
- 14% ▲ 1.00%
- Reading proficiency
- 23% ▲ 3.00%
- Median HH income
- $37,453
- Composite
- 18.76/100
- National rank
- #14002
- State rank
- #650 of 760 in MI
Livability — Lansing
- Score
- 79/100
- State rank
- #94
- US rank
- #2182
Category grades
Schools grade is shown separately in the Schools card above.
Census & demographics
- Census place
- Lansing, MI
- County
- Ingham County · 237,052 people
- City population
- 161,269
- Metro
- Lansing-East Lansing, MI
- Population (ZIP)
- 39,876
- Household income
- $56,631
- Rent vs Own
- Severe rent burden
- 2255.0
Population outlook (Ingham County) Hauer SSP2
- Today (2025)
- 300,362 people
- By 2030
- 307,808 · +2.5%
- By 2040
- 320,492 · +6.7%
- By 2050
- 333,223 · +10.9%
- By 2075
- 373,693 · +24.4%
- By 2100
- 392,021 · +30.5%
Race, ethnicity, and origin ACS 2023
- Neighborhood character
- Diverse neighborhood (Simpson 0.70)
- Race & ethnicity
- White 46% Black 26% Hispanic / Latino 14% Two or more races 10% Asian 8%
- Hispanic origin (detail)
- Mexican 10% Puerto Rican 1%
- Common ancestry
- Romanian 3% Slovak 2% Iranian 2%
- Foreign-born
- 12% · Canada, Vietnam, Philippines
- Languages at home
- 83% English-only · Spanish 5% Other Indo-European 3% Other Asian/Pacific 2%
Political lean MEDSL · Ingham
- 2024 margin
- Strong D (+29.7) · D 63.9% · R 34.2% · Other 2.0%
- 2008→2024 swing
- -3.6pp toward R · 2008: 33.3pp · 2024: 29.7pp
- All cycles
- 2024: D+29.7 2020: D+32.2 2016: D+27.6 2012: D+27.9 2008: D+33.3
Not yet ingested
- Civics
- —
Market trends
- HPI YoY
- ▼ -179.62%
- Current HPI
- 176.0632
- Rent YoY
- ▲ 9.90%
- Metro
- Lansing-East Lansing, MI
- State GDP YoY
- ▲ 1.37%
- F500 in state
- 28
Industry mix (Fortune 500 HQ in MI)
| Industry | F500 HQs | Revenue |
|---|---|---|
| Automotive Parts | 3 | $48B |
|
||
| Automotive | 2 | $372B |
|
||
| Chemicals | 1 | $45B |
|
||
| Automotive Retail | 1 | $29B |
|
||
| Healthcare / Medical Devices | 1 | $23B |
|
||
| Automotive Technology | 1 | $20B |
|
||
Price history
+55.9% since first listed16 events — show timeline
- 2026-04-16 Pending — REALCOMP
- 2026-04-16 Pending — Greater Lansing AoR
- 2026-04-06 Listed $169,900 REALCOMP
- 2026-04-06 Listed $169,900 Greater Lansing AoR
- 2025-09-22 Listing Removed — REALCOMP
- 2025-08-26 Price Changed $169,900 REALCOMP
- 2025-08-26 Price Changed $169,900 Greater Lansing AoR
- 2025-07-31 Price Changed $179,900 REALCOMP
- 2025-07-31 Price Changed $179,900 Greater Lansing AoR
- 2025-07-15 Listed $189,900 REALCOMP
- 2019-07-09 Sold (Public Records) $109,900 Public Records
- 2019-06-28 Sold (MLS) $109,900 Greater Lansing AoR
- 2019-06-28 Sold (MLS) $109,900 REALCOMP
- 2019-05-01 Listed $109,900 Greater Lansing AoR
- 2019-05-01 Listed $109,900 REALCOMP
- 2002-11-08 Sold (Public Records) $109,000 Public Records
Property tax history
+6.0%/yrLatest (2025): $3,545 · +3.1% YoY. Source: county tax records.
Cash-flow waterfall
monthlySold comps — $/sqft
last 12 mo · ≤1 miLoading sold comps…