 Multi-family
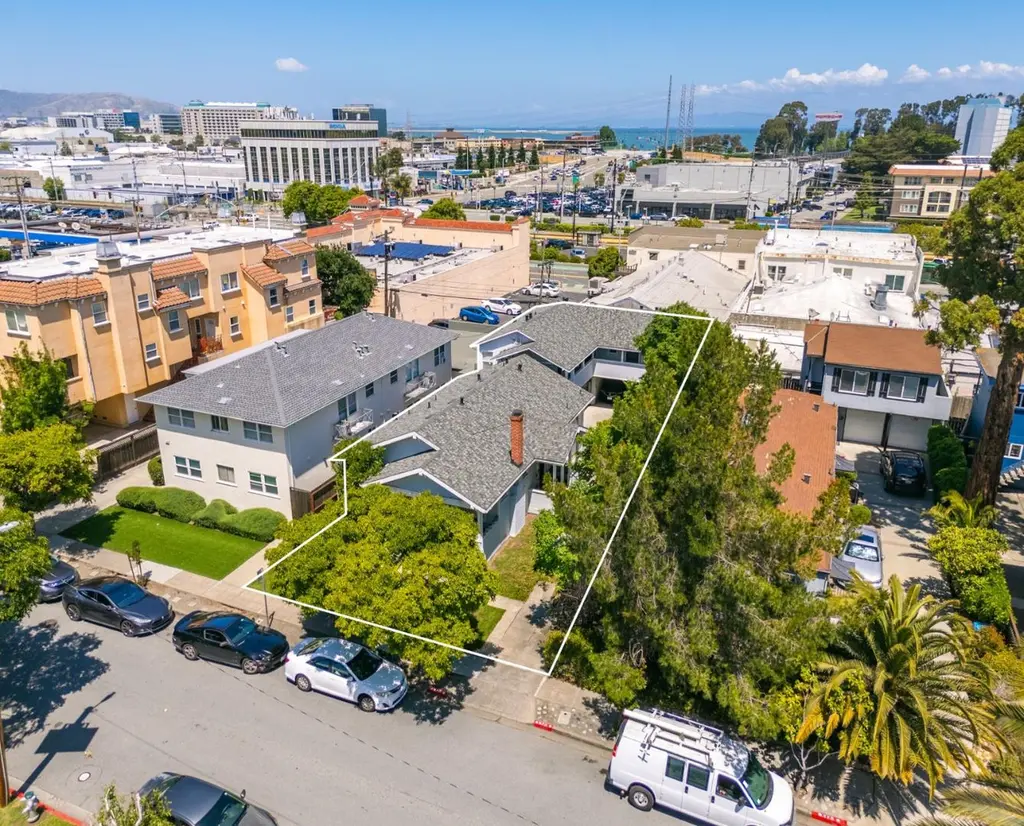
1120 Chula Vista Ave · Burlingame, CA
Flood risk 1/10 · Minimal
- FEMA flood zone
- X (shaded)
- Chance of flooding over 30 yrs
- 0.0%
- Est. flood insurance / yr
- $507 – $1,088
Fire risk 1/10 · Minimal
- Est. fire insurance / yr
- $659 – $1,223
Heat risk 2/10 · Minimal
- Hot days now (above 84°F)
- 7 days/yr
- Hot days in 30 yrs
- 16 days/yr
Wind risk 1/10 · Minimal
- Chance of severe wind over 30 yrs
- —
Air-quality risk 7/10 · Major
- Unhealthy air days now
- 12 days/yr
- Unhealthy air days in 30 yrs
- 12 days/yr
Risk factors via First Street. Map © Google.
Why this score? — see what drove the C+ grade
The composite is a weighted blend of 9 inputs, each scored 0–100. Each bar is that input's sub-score; the figure is the points it added to the 100-point composite (weight × sub-score).
- Cash flow +23.8/30.0
- Appreciation +8.8/10.0
- DSCR +7.7/10.0
- Schools +5.7/10.0
- 1% rule +5.1/10.0
- Livability +4.1/5.0
- ARV discount +3.4/15.0
- Rent growth +3.3/5.0
- Condition / age +2.5/5.0
$2,300,000
🖨 Deal sheet (PDF) 📄 Offer letter ✓ Due diligence
Multi-family units
County records classify this as Multi-Family (2-4 Unit). Listing-text estimate: 1 unit. estimate disagrees with records
Listing remarks MLS
Offering Memorandum available upon request - The Zurich Group is pleased to present 1120 Chula Vista Avenue, a six-unit apartment community ideally located in the heart of Burlingame, just steps from the popular Broadway Avenue retail and dining district. Positioned on a tree-lined residential street, the property offers tenants a highly walkable location with immediate access to shops, restaurants, and everyday conveniences. Recent capital improvements include a new roof installed in 2021 and a comprehensive electrical upgrade completed in 2025. Additional amenities include three garages comprised of two two-car garages and one single-car garage, providing valuable on-site parking in a supply-constrained market. Located just 0.2 miles from the Broadway Caltrain Station, the property offers exceptional connectivity throughout the Peninsula, Silicon Valley, and San Francisco. With its prime Burlingame location, proximity to Broadway, recent capital improvements, and strong commuter appeal, 1120 Chula Vista Avenue presents an outstanding opportunity to acquire a well-positioned Peninsula apartment asset.
Key facts
- New roof installed
- 5,750 sq ft lot
- 5 garage spots
Tags
Property features AI
Finance
- Other: Tenant expenses: miscellaneous/other; Property is incorporated
- Financial info: Annual rental income: $123,900; Annual gross income: $123,900; Gross scheduled income: $123,900; Gross rent multiplier: 18.56; Total expenses: $41,616; Vacancy factor: 3%; Trash expense: $3,047; Utility expenses: $2,824; Landscape expense: $1,680
Exterior
- Parking: Attached garage with 5 garage spaces
- Utilities: Water on site; Sewer connected; Individual electric meters; Primary water meter
- Home design: R30000 zoning; One building
- Construction: Concrete perimeter and slab foundation
- Exterior features: Composition roof
Interior
- Bedrooms: Four units with unspecified bedroom count; Two one-bedroom units
- Bathrooms: Four units with one full bath each; Two one-bedroom units with one full bath each
- Heating & cooling: Heating: other (see remarks)
- Interior features: Approximately 3,922 finished square feet
Neighborhood map
What this means for you Summary
Snapshot
- This is a 6-bed/6.0-bath multifamily listed at $2.30M.
Deal economics
- At list price, monthly cash flow is $4k ($53k/yr) — positive.
- The deal already cash-flows at list — no discount required.
- Meets the 1% rule at list price ($23k rent vs $2.30M).
- Recommended offer: $2.27M (1.5% below list) — sets the bar for market timing.
- Cap rate 8.6% vs local median 0.8% in Burlingame — top-decile yield for the area; either an underpriced asset or a hidden risk that comps aren't pricing in. Stress-test before assuming the spread holds.
Location & tenants
- Location reads 82/100 on livability (#36 in CA, #1,222 nationally) — a professional / high-income tenant draw. Strengths: commute A+, employment A+, health & safety A+; Watch: cost of living F.
- San Mateo Union High (suburban): math 50% / reading 70% proficiency, ranked #178 of 1,400 in CA (top 13%) — acceptable for families but not a draw, mixed tenant base, ~2y average lease.
- Zoned schools: Roosevelt Elementary (math 67% / reading 72%, grade A-, #147 of 1,571 statewide, top 10%, 311 students, 26% FRL); Burlingame Intermediate (math 67% / reading 74%, grade A, #38 of 498 statewide, top 7%, 1,013 students, 17% FRL); Burlingame High (1,519 students, 13% FRL).
- Market conditions: Rents rising (+3.0%/yr); 67 active listings in the ZIP; high-income renter base; 1,019 units permitted in San Mateo County in 2024 (484 in 5+ unit buildings).
Forward outlook
- In year one you build about $189k of equity ($16k loan paydown + $173k appreciation (7.5% local appreciation)).
- San Mateo County population projected at +24% by 2050 — long-run rental-demand tailwind backs the buy-and-hold thesis.
- At projected returns (7.5% appreciation + 3.0% rent growth), your $644k cash investment doubles in ~3 years — after that, you're playing with house money.
- By year 2, paydown + projected appreciation supports a ~$302k cash-out refi (75% LTV) — recoverable capital for the next deal without selling this one.
Negotiation context
- It's been on market 23 days — a 2% lower offer ($2.27M) is reasonable based on typical stale-listing flexibility.
- 2 sale attempts with the ask held roughly flat each time — persistent listings suggest the price (not the market) is what's stuck; bring a comps-based counter.
- Current owner paid $520k; list at $2.30M implies a 342% gain — meaningful room to come down on a strong offer.
Risks & watch-outs
- Watch-outs: built in 1914 — expect roof / HVAC / electrical / plumbing capex.
Questions for the listing agent
- Built in 1914 — when were the roof, HVAC, electrical panel, plumbing, and water heater last replaced?
- Is there a deadline driving the sale (1031 exchange, divorce, estate, relocation)? That informs how much negotiation room exists.
- Schools are A-rated — typically a magnet for longer-tenancy family renters. What's the average tenant stay here, and is there a school-zone premium baked into asking?
- What's the average days-on-market for RENTAL listings here right now (not sales)? A rising rental-DOM trend means longer vacancies and softer asking-rent achievability than the comps imply.
- What's the recent tenant-quality profile in this submarket — average credit score on applications, eviction rate, late-payment / NSF rate, and stable-employment percentage? A property-management company in the area should have these aggregated.
- How much new apartment / multifamily construction is in the pipeline within 1–3 miles? Heavy new supply (>2% of stock underway) typically softens rents 12–24 months out; light construction supports rent growth.
Investment metrics
- 1% rule
- 1.01% ✓
- Cap rate
- 8.60%
- Cash-on-cash
- 8.23%
- DSCR
- 1.37
- GRM
- 8.2
CMA / ARV
- ARV (on-the-fly)
- $2,110,036
- Comps found
- 1
Show comp detail 1 sale within ~0.75 mi
| Address | Dist | Beds/Ba | Sqft | Sold | Price | $/sf | Match |
|---|---|---|---|---|---|---|---|
| 1140 Paloma Ave | 0.12mi | 5/4.0 (-1) | 4,460 (+14%) | 20mo | $2,400,000 | $538 | 42 |
Match score weights: distance 35% · size 25% · config 20% · recency 20%. Top-matched comps best support the ARV.
Projected returns pro-forma
7.52% appreciation · 3.01% rent growth · sell at horizon
- IRR
- 25.4%
- Equity multiple
- 2.80×
- Total profit
- $1,158,664
- Equity at exit
- $1,673,315
- IRR
- 23.1%
- Equity multiple
- 5.89×
- Total profit
- $3,151,021
- Equity at exit
- $3,253,267
Cash invested: $644,000 (down + closing). Projections, not guarantees.
Landlord ↔ Tenant lean methodology
- Overall (STATE)
- 18 Strongly Tenant-Friendly
- State California
- 18 Strongly Tenant-Friendly · D+13
- County
- — inherits STATE
- City
- — inherits STATE
ZIP-level market 94010
- Home prices YoY
- 2.1%
- Rents YoY
- 3.0%
- Active inventory
- 67
- Price-to-rent
- 49.5×
Monthly cashflow live
- Estimated rent
- $23,249 high interval (Pro) →
- Mortgage (P&I)
- −$12,061
- Tax from tax record
- −$928 /mo · $11,141/yr
- Insurance
- −$958
- HOA
- −$0
- Vacancy / Maint / Mgmt
- −$4,882
- Net cashflow
- $4,419
Break-even live
Sensitivity live
| Price | -10% $5,721 | -5% $5,070 | +0% $4,419 | +5% $3,768 | +10% $3,117 |
|---|---|---|---|---|---|
| Rent | -10% $2,582 | -5% $3,500 | +0% $4,419 | +5% $5,337 | +10% $6,255 |
| Rate | -1.0pp $5,577 | -0.5pp $5,004 | base $4,419 | +0.5pp $3,823 | +1.0pp $3,216 |
6-unit breakdown (identical units grouped — click to expand)
| Units | Beds | Baths | Est. rent |
|---|---|---|---|
| 6× units | 2 | 1 | $23,250 |
| #1 | 2 | 1 | $3,875 |
| #2 | 2 | 1 | $3,875 |
| #3 | 2 | 1 | $3,875 |
| #4 | 2 | 1 | $3,875 |
| #5 | 2 | 1 | $3,875 |
| #6 | 2 | 1 | $3,875 |
| Total (6 units) | $23,249 | ||
UW: 25.0% down · 7.5% · 30yr · 1.5% tax · 5.0% vac · 8.0% maint · 8.0% mgmt
Financing live
Cash to close
- Down payment
- $575,000
- Closing costs
- $69,000
- Reserves months
- —
- Total cash needed
- —
Loan-product check · same deal, 3 products live
Conventional
25% down · 7.5% · 30yr
- Down + closing
- —
- Monthly P&I
- —
- Monthly cashflow
- —
- DSCR
- —
- Eligible?
- —
Personal DTI + credit; lowest rate.
DSCR
20% down · 8.5% · 30yr
- Down + closing
- —
- Monthly P&I
- —
- Monthly cashflow
- —
- DSCR
- —
- Eligible?
- —
No personal income docs; deal must DSCR.
Hard money
10% down · 12.0% · 12mo
- Down + closing
- —
- Monthly P&I
- —
- Monthly cashflow
- —
- DSCR
- —
- Eligible?
- —
Short-term bridge; refi at stabilization.
Listing history 15 events
-
2026-06-21days on market $2,300,000 Active 23 DOM
-
2026-06-18days on market $2,300,000 Active 20 DOM
-
2026-06-17days on market $2,300,000 Active 19 DOM
-
2026-06-16days on market $2,300,000 Active 18 DOM
-
2026-06-15days on market $2,300,000 Active 17 DOM
-
2026-06-13days on market $2,300,000 Active 15 DOM
-
2026-06-13days on market $2,300,000 Active 14 DOM
-
2026-06-09days on market $2,300,000 Active 11 DOM
-
2026-06-08days on market $2,300,000 Active 10 DOM
-
2026-06-07days on market $2,300,000 Active 9 DOM
-
2026-06-04days on market $2,300,000 Active 6 DOM
-
2026-06-03days on market $2,300,000 Active 5 DOM
-
2026-06-02days on market $2,300,000 Active 4 DOM
-
2026-06-01days on market $2,300,000 Active 3 DOM
-
2026-05-31days on market $2,300,000 Active 2 DOM
ⓘ Source: listings_history table (triggers on properties + properties_extension) + one-shot
backfill from property_details.listing_events for pre-trigger history.
Tax reassessment forecast CA · Resets to sale price
- Current annual tax
- $11,141 · $928/mo
- Projected year-2 tax
- $17,480 · $1,457/mo
- Expected delta
- +$6,339/yr (+$528/mo · 56.9%)
ⓘ Screening estimate from a state-policy table — verify with the county assessor before closing.
Climate risk First Street
- Flood 1/10 Low FEMA zone X (shaded) · 0% chance over 30 yrs
- Wildfire 1/10 Low
- Heat 2/10 Low 7 d/yr ≥84°F today · 16 d/yr by 30 yrs out
- Wind 1/10 Low
- Air quality 7/10 Severe 12 unhealthy d/yr today · 12 by 30 yrs out
Nearby sold comps map
Loading sold comps map…
Walkable amenities ~0.75 mi
Loading nearby amenities…
Taxation est. · year 1
- Rental income
- $278,988
- − Mortgage interest
- −$128,836
- − Property taxes
- −$11,141
- − Insurance
- −$11,500
- − Repairs & maintenance
- −$22,319
- − Management
- −$22,319
- − Depreciation
- −$66,909
- Taxable income
- $15,964
- Est. tax owed @ 24.0%
- −$3,831
- After-tax cash flow
- $49,191/yr
For passive investors: Depreciation is non-cash, so a rental often shows a tax loss while cash-flowing — sheltering income. Rental losses are passive: they offset passive income freely, and up to $25,000/yr can offset ordinary (W-2) income if you actively participate and your MAGI is under $100k (phasing out to $0 by $150k); unused losses carry forward. On sale, claimed depreciation is recaptured at up to 25%, and gains may owe capital-gains tax (a 1031 exchange can defer both). Figures are a year-1 estimate at your 24.0% rate — not tax advice; consult a CPA.
Schools (NCES district)
- District
- San Mateo Union High
- NCES district ID
- 0634980
- Math proficiency
- 50% ▼ -2.00%
- Reading proficiency
- 70% ▼ -1.00%
- Median HH income
- $96,956
- Composite
- 57.13/100
- National rank
- #2338
- State rank
- #178 of 1400 in CA
Livability — Burlingame
- Score
- 82/100
- State rank
- #36
- US rank
- #1222
Category grades
Schools grade is shown separately in the Schools card above.
Census & demographics
- Census place
- Burlingame, CA
- County
- San Mateo County · 733,415 people
- Metro
- San Francisco-Oakland-Berkeley, CA
- Population (ZIP)
- 43,025
- Household income
- $196,882
- Rent vs Own
- Severe rent burden
- 1199.0
Population outlook (San Mateo County) Hauer SSP2
- Today (2025)
- 864,008 people
- By 2030
- 910,523 · +5.4%
- By 2040
- 997,285 · +15.4%
- By 2050
- 1,071,189 · +24.0%
- By 2075
- 1,197,206 · +38.6%
- By 2100
- 1,192,523 · +38.0%
Race, ethnicity, and origin ACS 2023
- Neighborhood character
- Diverse neighborhood (Simpson 0.63)
- Race & ethnicity
- White 52% Asian 30% Hispanic / Latino 11% Two or more races 9%
- Hispanic origin (detail)
- Mexican 5%
- Common ancestry
- Romanian 3% Scotch-Irish 2% Italian 2%
- Foreign-born
- 29% · China, Canada, South Korea
- Languages at home
- 64% English-only · Chinese 11% Spanish 8% Other Indo-European 6%
Political lean MEDSL · San Mateo
- 2024 margin
- Solid D (+50.3) · D 73.5% · R 23.2% · Other 3.3%
- 2008→2024 swing
- +1.6pp toward D · 2008: 48.7pp · 2024: 50.3pp
- All cycles
- 2024: D+50.3 2020: D+57.7 2016: D+57.7 2012: D+44.8 2008: D+48.7
Not yet ingested
- Civics
- —
Market trends
- HPI YoY
- ▲ 7.52%
- Current HPI
- 358.6569
- Rent YoY
- ▲ 3.01%
- Metro
- San Francisco-Oakland-Berkeley, CA
- State GDP YoY
- ▲ 3.21%
- F500 in state
- 116
Industry mix (Fortune 500 HQ in CA)
| Industry | F500 HQs | Revenue |
|---|---|---|
| Technology | 27 | $1,492B |
|
||
| Financial Services | 3 | $174B |
|
||
| Retail | 3 | $44B |
|
||
| Insurance | 3 | $26B |
|
||
| Media / Entertainment | 2 | $115B |
|
||
| Pharmaceuticals / Biotech | 2 | $62B |
|
||
Price history
+838.8% since first listed6 events — show timeline
- 2026-05-29 Listed $2,300,000 MLSListings
- 2026-05-29 Listed $2,300,000 bridgeMLS, Bay East AOR, or Contra Costa AOR
- 1994-12-16 Sold (Public Records) $520,000 Public Records
- 1989-03-23 Sold (Public Records) $460,000 Public Records
- 1989-03-23 Sold (Public Records) $460,000 Public Records
- 1983-08-30 Sold (Public Records) $245,000 Public Records
Property tax history
+2.4%/yrLatest (2025): $11,141 · +10.2% YoY. Source: county tax records.
Cash-flow waterfall
monthlySold comps — $/sqft
last 12 mo · ≤1 miLoading sold comps…