 Multi-family
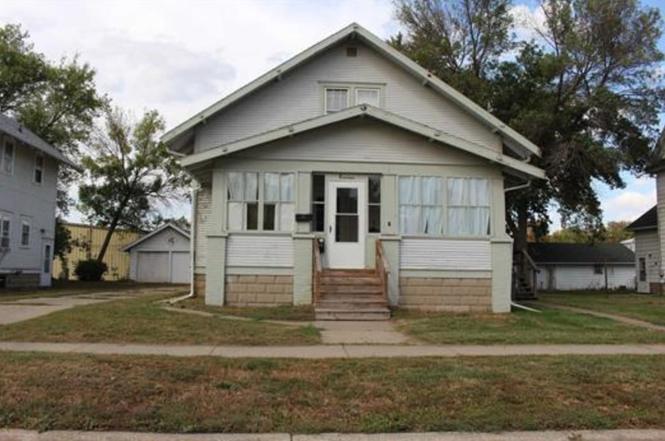
19 E 2nd St · Spencer, IA
Flood risk 1/10 · Minimal
- FEMA flood zone
- X (unshaded)
- Chance of flooding over 30 yrs
- 0.0%
- Est. flood insurance / yr
- $473 – $860
Fire risk 4/10 · Minor
- Est. fire insurance / yr
- $902 – $1,676
Heat risk 2/10 · Minimal
- Hot days now (above 99°F)
- 7 days/yr
- Hot days in 30 yrs
- 16 days/yr
Wind risk 2/10 · Minimal
- Chance of severe wind over 30 yrs
- —
Air-quality risk 1/10 · Minimal
- Unhealthy air days now
- 0 days/yr
- Unhealthy air days in 30 yrs
- 0 days/yr
Risk factors via First Street. Map © Google.
Why this score? — see what drove the B grade
The composite is a weighted blend of 9 inputs, each scored 0–100. Each bar is that input's sub-score; the figure is the points it added to the 100-point composite (weight × sub-score).
- Cash flow +30.0/30.0
- 1% rule +10.0/10.0
- DSCR +10.0/10.0
- ARV discount +7.5/15.0
- Schools +6.1/10.0
- Livability +3.9/5.0
- Rent growth +2.5/5.0
- Condition / age +2.5/5.0
- Appreciation +0.0/10.0
$115,000
🖨 Deal sheet 📄 Offer letter ✓ Due diligence
Multi-family units
County records classify this as Multi-Family (2-4 Unit). Listing-text estimate: 1 unit. estimate disagrees with records
Listing remarks
Investor Opportunity – Tucked into the heart of Spencer, this 1½-story frame bungalow has been a quiet constant—providing a comfortable place to call home for long-term tenants and reliable income. With two separate living units, each space offers simple, practical living with everything tenants need and nothing overcomplicated. Located near downtown, this property provides a strong occupancy history and consistent cash flow—perfect for investors seeking a stable, income-producing opportunity. This one deserves a closer look.
Key facts
- Near downtown
- Consistent cash flow
- 8,052 sq ft lot
Tags
Property features AI
Exterior
- Parking: Detached parking; Concrete and gravel surfaces; Shared driveway
- Utilities: Public water; Public sewer
- Home design: Residential income property (multi-family duplex); Two levels
- Construction: Block and wood siding construction
- Exterior features: Asphalt roof; Lot approximately 66 x 122 (0.19 acres)
Interior
- Heating & cooling: Natural gas heating
- Interior features: Gas water heater; Full unfinished basement
Neighborhood map
What this means for you Summary
Snapshot
- This is a 3-bed/3.0-bath multifamily listed at $115k.
Deal economics
- At list price, monthly cash flow is $1k ($17k/yr) — positive.
- The deal already cash-flows at list — no discount required.
- Meets the 1% rule at list price ($3k rent vs $115k).
- Recommended offer: $101k (12.0% below list) — sets the bar for market timing.
- Cap rate 21.4% vs local median 4.6% in Spencer — top-decile yield for the area; either an underpriced asset or a hidden risk that comps aren't pricing in. Stress-test before assuming the spread holds.
Location & tenants
- Location reads 77/100 on livability (#168 in IA, #3,020 nationally) — a middle-class / working-renter tenant base. Strengths: schools A+, crime A+, cost of living A+; Watch: employment D, amenities F, commute F.
- Spencer Community School District (town): math 73% / reading 72% proficiency, ranked #114 of 289 in IA (top 39%) — strong family-tenant draw, lease renewals of 3-5y typical.
- Market conditions: 108 active listings in the ZIP; 11 units permitted in Clay County in 2024 (0 in 5+ unit buildings).
Forward outlook
- Local home prices are declining (-3.0%/yr); year-one equity from $795 of loan paydown is wiped out by about $3k of value loss. Plan a longer hold.
- Clay County population projected to shrink 6% by 2050 — rents likely to lag national; underwrite the cash flow, not the appreciation.
- At projected returns (-3.0% appreciation + 3.0% rent growth), your $32k cash investment doubles in ~3 years — after that, you're playing with house money.
Negotiation context
- It's been on market 229 days — a 12% lower offer ($101k) is reasonable based on typical stale-listing flexibility.
- Current owner paid $100k; 15% above their basis — modest negotiation headroom, anchor on the comps not their cost.
Risks & watch-outs
- Watch-outs: built in 1920 — expect roof / HVAC / electrical / plumbing capex.
Questions for the listing agent
- It's been on market 229 days. Have you received any prior offers? Is the seller open to a 12% concession, seller financing, or rate buy-down credit?
- Built in 1920 — when were the roof, HVAC, electrical panel, plumbing, and water heater last replaced?
- Why hasn't it sold? Are there any deal-killer items the seller is aware of (foundation, flood, title, zoning, code violations)?
- Is there a deadline driving the sale (1031 exchange, divorce, estate, relocation)? That informs how much negotiation room exists.
- Schools are A-rated — typically a magnet for longer-tenancy family renters. What's the average tenant stay here, and is there a school-zone premium baked into asking?
- What's the average days-on-market for RENTAL listings here right now (not sales)? A rising rental-DOM trend means longer vacancies and softer asking-rent achievability than the comps imply.
- What's the recent tenant-quality profile in this submarket — average credit score on applications, eviction rate, late-payment / NSF rate, and stable-employment percentage? A property-management company in the area should have these aggregated.
- How much new apartment / multifamily construction is in the pipeline within 1–3 miles? Heavy new supply (>2% of stock underway) typically softens rents 12–24 months out; light construction supports rent growth.
Investment metrics
- 1% rule
- 2.43% ✓
- Cap rate
- 21.37%
- Cash-on-cash
- 53.86%
- DSCR
- 3.40
- GRM
- 3.4
CMA / ARV
No comps found within radius.
Projected returns pro-forma
-3.0% appreciation · 3.0% rent growth · sell at horizon
- IRR
- 52.0%
- Equity multiple
- 3.28×
- Total profit
- $73,433
- Equity at exit
- $17,147
- IRR
- 57.3%
- Equity multiple
- 6.67×
- Total profit
- $182,560
- Equity at exit
- $9,943
Cash invested: $32,200 (down + closing). Projections, not guarantees.
Landlord ↔ Tenant lean methodology
- Overall (STATE)
- 83 Strongly Landlord-Friendly
- State Iowa
- 83 Strongly Landlord-Friendly · R+6
- County
- — inherits STATE
- City
- — inherits STATE
ZIP-level market 51301
- Home prices YoY
- -35.0%
- Active inventory
- 108
- Price-to-rent
- 6.9×
Monthly cashflow live
- Estimated rent
- $2,796 medium interval (Pro) →
- Mortgage (P&I)
- −$603
- Tax from tax record
- −$113 /mo · $1,352/yr
- Insurance
- −$48
- HOA
- −$0
- Vacancy / Maint / Mgmt
- −$587
- Net cashflow
- $1,445
Break-even live
2-unit breakdown (identical units grouped — click to expand)
| Units | Beds | Baths | Est. rent |
|---|---|---|---|
| 2× units | 2 | 1 | $2,796 |
| #1 | 2 | 1 | $1,398 |
| #2 | 2 | 1 | $1,398 |
| Total (2 units) | $2,796 | ||
UW: 25.0% down · 7.5% · 30yr · 1.5% tax · 5.0% vac · 8.0% maint · 8.0% mgmt
Financing live
Cash to close
- Down payment
- $28,750
- Closing costs
- $3,450
- Reserves months
- —
- Total cash needed
- —
Loan-product check · same deal, 3 products live
Conventional
25% down · 7.5% · 30yr
- Down + closing
- —
- Monthly P&I
- —
- Monthly cashflow
- —
- DSCR
- —
- Eligible?
- —
Personal DTI + credit; lowest rate.
DSCR
20% down · 8.5% · 30yr
- Down + closing
- —
- Monthly P&I
- —
- Monthly cashflow
- —
- DSCR
- —
- Eligible?
- —
No personal income docs; deal must DSCR.
Hard money
10% down · 12.0% · 12mo
- Down + closing
- —
- Monthly P&I
- —
- Monthly cashflow
- —
- DSCR
- —
- Eligible?
- —
Short-term bridge; refi at stabilization.
Listing history 5 events
-
2026-04-26historical Active Under Contract
-
2026-02-18price $115,000
-
2026-02-10price $119,000
-
2025-10-10$125,000 Active
-
2019-04-01soldstatus $100,000
ⓘ Source: listings_history table (triggers on properties + properties_extension) + one-shot
backfill from property_details.listing_events for pre-trigger history.
Tax reassessment forecast IA · Partial reset (capped growth)
- Current annual tax
- $1,352 · $113/mo
- Projected year-2 tax
- $1,579 · $132/mo
- Expected delta
- +$227/yr (+$19/mo · 16.8%)
ⓘ Screening estimate from a state-policy table — verify with the county assessor before closing.
Climate risk First Street
- Flood 1/10 Low FEMA zone X (unshaded) · 0% chance over 30 yrs
- Wildfire 4/10 Moderate
- Heat 2/10 Low 7 d/yr ≥99°F today · 16 d/yr by 30 yrs out
- Wind 2/10 Low
- Air quality 1/10 Low 0 unhealthy d/yr today · 0 by 30 yrs out
Nearby sold comps map
Loading sold comps map…
Walkable amenities ~0.75 mi
Loading nearby amenities…
Taxation est. · year 1
- Rental income
- $33,552
- − Mortgage interest
- −$6,442
- − Property taxes
- −$1,352
- − Insurance
- −$575
- − Repairs & maintenance
- −$2,684
- − Management
- −$2,684
- − Depreciation
- −$3,345
- Taxable income
- $16,469
- Est. tax owed @ 24.0%
- −$3,953
- After-tax cash flow
- $13,390/yr
For passive investors: Depreciation is non-cash, so a rental often shows a tax loss while cash-flowing — sheltering income. Rental losses are passive: they offset passive income freely, and up to $25,000/yr can offset ordinary (W-2) income if you actively participate and your MAGI is under $100k (phasing out to $0 by $150k); unused losses carry forward. On sale, claimed depreciation is recaptured at up to 25%, and gains may owe capital-gains tax (a 1031 exchange can defer both). Figures are a year-1 estimate at your 24.0% rate — not tax advice; consult a CPA.
Schools (NCES district)
- District
- Spencer Community School District
- NCES district ID
- 1926910
- Math proficiency
- 73% ▼ -7.00%
- Reading proficiency
- 72% ▼ -6.00%
- Median HH income
- $45,474
- Composite
- 61.02/100
- National rank
- #797
- State rank
- #114 of 289 in IA
Livability — Spencer
- Score
- 77/100
- State rank
- #168
- US rank
- #3020
Category grades
Schools grade is shown separately in the Schools card above.
Census & demographics
- Census place
- Spencer, IA
- City population
- 12,402
- Population (ZIP)
- 12,402
Population outlook (Clay County) Hauer SSP2
- Today (2025)
- 16,277 people
- By 2030
- 16,073 · -1.3%
- By 2040
- 15,638 · -3.9%
- By 2050
- 15,315 · -5.9%
- By 2075
- 15,026 · -7.7%
- By 2100
- 14,638 · -10.1%
Race, ethnicity, and origin ACS 2023
- Neighborhood character
- Predominantly White (91%)
- Race & ethnicity
- White 91% Hispanic / Latino 5% Two or more races 4%
- Hispanic origin (detail)
- Mexican 4%
- Common ancestry
- Portuguese 14% Iranian 4% Lithuanian 2%
- Foreign-born
- 1% · Canada, South Korea
- Languages at home
- 98% English-only · Spanish 1%
Political lean MEDSL · Clay
- 2024 margin
- Solid R (+43.2) · D 27.8% · R 71.0% · Other 1.2%
- 2008→2024 swing
- -38.1pp toward R · 2008: -5.1pp · 2024: -43.2pp
- All cycles
- 2024: R+43.2 2020: R+38.7 2016: R+42.4 2012: R+18.7 2008: R+5.1
Not yet ingested
- Civics
- —
Market trends
- HPI YoY
- ▼ -103.43%
- Current HPI
- 192.1741
- Rent YoY
- —
- Metro
- —
- State GDP YoY
- ▲ 2.48%
- F500 in state
- 4
Industry mix (Fortune 500 HQ in IA)
| Industry | F500 HQs | Revenue |
|---|---|---|
| Financial Services | 1 | $16B |
|
||
| Retail / Convenience | 1 | $15B |
|
||
Price history
+15.0% since first listed5 events — show timeline
- 2026-04-26 Contingent — Iowa Great Lakes BOR
- 2026-02-18 Price Changed $115,000 Iowa Great Lakes BOR
- 2026-02-10 Price Changed $119,000 Iowa Great Lakes BOR
- 2025-10-10 Listed $125,000 Iowa Great Lakes BOR
- 2019-04-01 Sold (Public Records) $100,000 Public Records
Property tax history
+1.2%/yrLatest (2025): $1,352 · +3.5% YoY. Source: county tax records.
Cash-flow waterfall
monthlySold comps — $/sqft
last 12 mo · ≤1 miLoading sold comps…