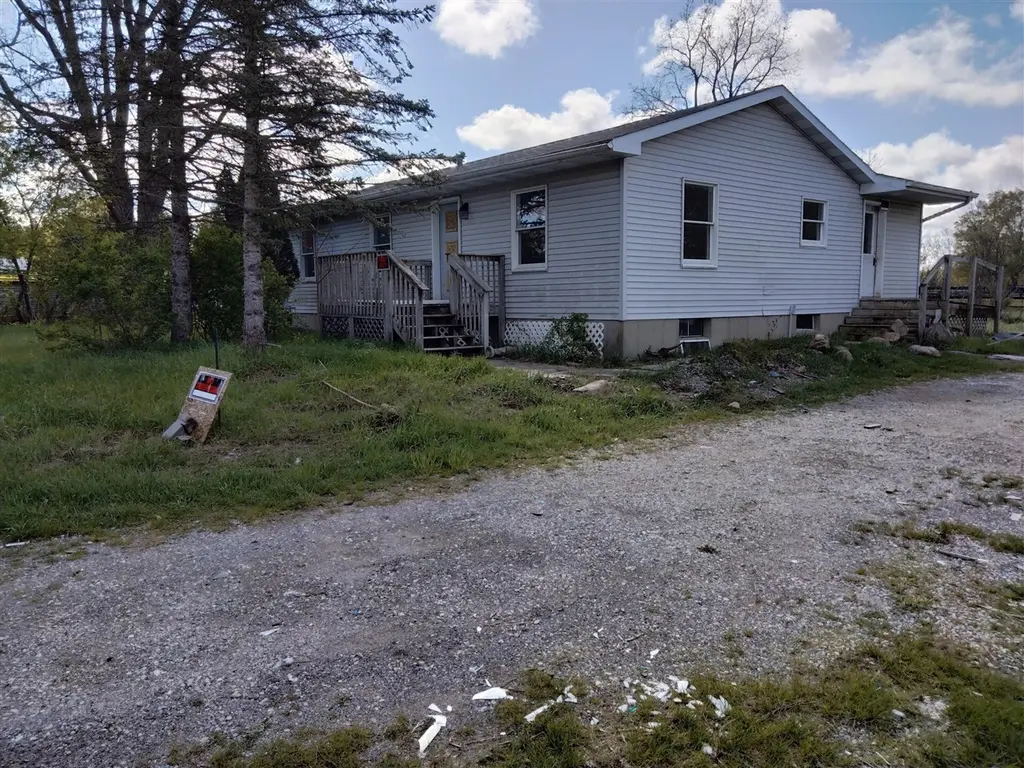
608 10 Mile Rd NW · Sparta, MI
Flood risk 1/10 · Minimal
- FEMA flood zone
- X (unshaded)
- Chance of flooding over 30 yrs
- 0.0%
- Est. flood insurance / yr
- $473 – $860
Fire risk 1/10 · Minimal
- Est. fire insurance / yr
- $784 – $1,456
Heat risk 2/10 · Minimal
- Hot days now (above 96°F)
- 7 days/yr
- Hot days in 30 yrs
- 16 days/yr
Wind risk 2/10 · Minimal
- Chance of severe wind over 30 yrs
- —
Air-quality risk 3/10 · Minor
- Unhealthy air days now
- 2 days/yr
- Unhealthy air days in 30 yrs
- 3 days/yr
Risk factors via First Street. Map © Google.
Why this score? — see what drove the D- grade
The composite is a weighted blend of 9 inputs, each scored 0–100. Each bar is that input's sub-score; the figure is the points it added to the 100-point composite (weight × sub-score).
- Cash flow +10.5/30.0
- ARV discount +9.6/15.0
- Livability +4.0/5.0
- Schools +3.5/10.0
- DSCR +3.0/10.0
- Rent growth +2.5/5.0
- Condition / age +2.5/5.0
- 1% rule +2.4/10.0
- Appreciation +0.0/10.0
$249,900
🖨 Deal sheet 📄 Offer letter ✓ Due diligence
Listing remarks MLS
2025 TV and AV are shown for informational purposes only. Sale is subject to Alpine Township Board of Trustees approval.
Key facts
- 1.25 acre lot
- 4 garage spots
- Built 1987
Property features AI
Exterior
- Parking: Detached garage; 4-car garage
- Utilities: Well water; Natural gas connected; Natural gas water heater
- Home design: Ranch-style single-family home; Residential property
- Construction: Built in 1987; Vinyl siding; Composition/Shingle roof; Full basement (foundation)
- Exterior features: 1.25-acre lot
Interior
- Kitchen: Eat-in kitchen
- Bedrooms: Primary bedroom; Two additional bedrooms
- Bathrooms: 1 full bathroom; 2 half bathrooms; Primary bathroom
- Heating & cooling: Forced air heating
- Interior features: Eat-in kitchen; Full basement; 7 total rooms; Mud room
Neighborhood map
What this means for you Summary
Snapshot
- This is a 3-bed/2.0-bath single-family listed at $250k.
Deal economics
- At list price, monthly cash flow is $-127 ($-2k/yr) — negative.
- To cash-flow at today's rent, offer at most $227k (9.0% below list).
- To meet the 1% rule (rent ≥ 1% of price), the offer needs to be $186k (25.7% below list).
- Recommended offer: $186k (25.7% below list) — sets the bar for 1% rule.
- Cap rate 5.7% vs local median 4.5% in Sparta — meaningfully above typical; check what's discounted (condition, days-on-market, listing class) to confirm the premium yield is real.
Location & tenants
- Location reads 80/100 on livability (#83 in MI, #1,786 nationally) — a professional / high-income tenant draw. Strengths: cost of living A+, housing A+, health & safety A+; Watch: amenities D+, employment D, commute F.
- Sparta Area Schools (town): math 33% / reading 47% proficiency, ranked #201 of 540 in MI (top 37%) — families likely to look elsewhere, expect single-tenant / working-renter base with shorter leases.
- Market conditions: 100 active listings in the ZIP; 2,253 units permitted in Kent County in 2024 (969 in 5+ unit buildings).
Forward outlook
- Local home prices are declining (-3.0%/yr); year-one equity from $2k of loan paydown is wiped out by about $7k of value loss. Plan a longer hold.
- Kent County population projected at +22% by 2050 — long-run rental-demand tailwind backs the buy-and-hold thesis.
Negotiation context
- Only 6 days on market — expect competitive offers; lowballing is unlikely to land.
- 3 sale attempts with the ask held roughly flat each time — persistent listings suggest the price (not the market) is what's stuck; bring a comps-based counter.
Questions for the listing agent
- What do current leases actually rent for vs. the listed asking? Can we see a recent rent roll and the last 12 months of T-12 income?
- Is there a deadline driving the sale (1031 exchange, divorce, estate, relocation)? That informs how much negotiation room exists.
- The area grade is low — what's the realistic commute time and amenity access for the typical tenant pool here? Any planned neighborhood developments (good or bad) we should know about?
- What's the average days-on-market for RENTAL listings here right now (not sales)? A rising rental-DOM trend means longer vacancies and softer asking-rent achievability than the comps imply.
- What's the recent tenant-quality profile in this submarket — average credit score on applications, eviction rate, late-payment / NSF rate, and stable-employment percentage? A property-management company in the area should have these aggregated.
- How much new for-sale + rental construction is in the pipeline within 1–3 miles? Heavy new supply typically softens prices + rents 12–24 months out; constrained supply supports both.
Investment metrics
- 1% rule
- 0.74% ✗
- Cap rate
- 5.68%
- Cash-on-cash
- -2.18%
- DSCR
- 0.90
- GRM
- 11.2
CMA / ARV
- ARV (median comp)
- $261,954
- List price
- $249,900
- Delta
- -4.60%
- Verdict
- FAIR
- Comps
- 12 within 1.0 mi
Show comp detail 5 sales within ~0.75 mi
| Address | Dist | Beds/Ba | Sqft | Sold | Price | $/sf | Match |
|---|---|---|---|---|---|---|---|
| 608 10 Mile Rd NW | 0.00mi | 3/2.0 | 1,246 (0%) | 1mo | $252,000 | $202 | 99 |
| 8277 Alpine Ave NW | 0.26mi | 3/1.0 | 1,197 (-4%) | 9mo | $340,000 | $284 | 70 |
| 8158 Alpine Ave NW | 0.37mi | 3/1.0 | 1,343 (+8%) | 16mo | $220,000 | $164 | 53 |
| 8823 Alpine Ave NW | 0.61mi | 3/1.5 | 1,191 (-4%) | 19mo | $247,000 | $207 | 46 |
| 7855 Alpine Ave NW | 0.73mi | 3/1.5 | 1,092 (-12%) | 10mo | $380,000 | $348 | 35 |
Match score weights: distance 35% · size 25% · config 20% · recency 20%. Top-matched comps best support the ARV.
Projected returns pro-forma
-3.0% appreciation · 3.0% rent growth · sell at horizon
- IRR
- -19.9%
- Equity multiple
- 0.31×
- Total profit
- $-48,628
- Equity at exit
- $37,261
- IRR
- -12.9%
- Equity multiple
- 0.24×
- Total profit
- $-52,967
- Equity at exit
- $21,607
Cash invested: $69,972 (down + closing). Projections, not guarantees.
Landlord ↔ Tenant lean methodology
- Overall (STATE)
- 62 Landlord-Friendly
- State Michigan
- 62 Landlord-Friendly · EVEN
- County
- — inherits STATE
- City
- — inherits STATE
ZIP-level market 49345
- Home prices YoY
- -27.3%
- Active inventory
- 100
- Price-to-rent
- 11.2×
Monthly cashflow live
- Estimated rent
- $1,858 medium interval (Pro) →
- Mortgage (P&I)
- −$1,311
- Tax from tax record
- −$180 /mo · $2,158/yr
- Insurance
- −$104
- HOA
- −$0
- Vacancy / Maint / Mgmt
- −$390
- Net cashflow
- $-127
Break-even live
UW: 25.0% down · 7.5% · 30yr · 1.5% tax · 5.0% vac · 8.0% maint · 8.0% mgmt
Financing live
Cash to close
- Down payment
- $62,475
- Closing costs
- $7,497
- Reserves months
- —
- Total cash needed
- —
Loan-product check · same deal, 3 products live
Conventional
25% down · 7.5% · 30yr
- Down + closing
- —
- Monthly P&I
- —
- Monthly cashflow
- —
- DSCR
- —
- Eligible?
- —
Personal DTI + credit; lowest rate.
DSCR
20% down · 8.5% · 30yr
- Down + closing
- —
- Monthly P&I
- —
- Monthly cashflow
- —
- DSCR
- —
- Eligible?
- —
No personal income docs; deal must DSCR.
Hard money
10% down · 12.0% · 12mo
- Down + closing
- —
- Monthly P&I
- —
- Monthly cashflow
- —
- DSCR
- —
- Eligible?
- —
Short-term bridge; refi at stabilization.
Listing history 6 events
-
2026-05-12status Pending 120-char remark
Show marketing remark (120 chars)
2025 TV and AV are shown for informational purposes only. Sale is subject to Alpine Township Board of Trustees approval.
-
2026-05-12status Pending 120-char remark
Show marketing remark (120 chars)
2025 TV and AV are shown for informational purposes only. Sale is subject to Alpine Township Board of Trustees approval.
-
2026-05-12status Pending
Show marketing remark (120 chars)
2025 TV and AV are shown for informational purposes only. Sale is subject to Alpine Township Board of Trustees approval.
-
2026-05-06$249,900 Active 120-char remark
Show marketing remark (120 chars)
2025 TV and AV are shown for informational purposes only. Sale is subject to Alpine Township Board of Trustees approval.
-
2026-05-06$249,900 Active 120-char remark
Show marketing remark (120 chars)
2025 TV and AV are shown for informational purposes only. Sale is subject to Alpine Township Board of Trustees approval.
-
2026-05-06$249,900 Active
Show marketing remark (120 chars)
2025 TV and AV are shown for informational purposes only. Sale is subject to Alpine Township Board of Trustees approval.
ⓘ Source: listings_history table (triggers on properties + properties_extension) + one-shot
backfill from property_details.listing_events for pre-trigger history.
Tax reassessment forecast MI · Partial reset (capped growth)
- Current annual tax
- $2,158 · $180/mo
- Projected year-2 tax
- $3,003 · $250/mo
- Expected delta
- +$845/yr (+$70/mo · 39.1%)
ⓘ Screening estimate from a state-policy table — verify with the county assessor before closing.
Climate risk First Street
- Flood 1/10 Low FEMA zone X (unshaded) · 0% chance over 30 yrs
- Wildfire 1/10 Low
- Heat 2/10 Low 7 d/yr ≥96°F today · 16 d/yr by 30 yrs out
- Wind 2/10 Low
- Air quality 3/10 Moderate 2 unhealthy d/yr today · 3 by 30 yrs out
Nearby sold comps map
Loading sold comps map…
Walkable amenities ~0.75 mi
Loading nearby amenities…
Taxation est. · year 1
- Rental income
- $22,293
- − Mortgage interest
- −$13,998
- − Property taxes
- −$2,158
- − Insurance
- −$1,250
- − Repairs & maintenance
- −$1,783
- − Management
- −$1,783
- − Depreciation
- −$7,270
- Taxable loss
- −$5,950
- Est. tax savings @ 24.0%
- +$1,428
- After-tax cash flow
- $-94/yr
For passive investors: Depreciation is non-cash, so a rental often shows a tax loss while cash-flowing — sheltering income. Rental losses are passive: they offset passive income freely, and up to $25,000/yr can offset ordinary (W-2) income if you actively participate and your MAGI is under $100k (phasing out to $0 by $150k); unused losses carry forward. On sale, claimed depreciation is recaptured at up to 25%, and gains may owe capital-gains tax (a 1031 exchange can defer both). Figures are a year-1 estimate at your 24.0% rate — not tax advice; consult a CPA.
Schools (NCES district)
- District
- Sparta Area Schools
- NCES district ID
- 2632370
- Math proficiency
- 33% ▼ -15.00%
- Reading proficiency
- 47% ▼ -9.00%
- Median HH income
- $54,917
- Composite
- 34.91/100
- National rank
- #5074
- State rank
- #201 of 540 in MI
Livability — Sparta
- Score
- 80/100
- State rank
- #83
- US rank
- #1786
Category grades
Schools grade is shown separately in the Schools card above.
Census & demographics
- City population
- 13,189
- Population (ZIP)
- 13,189
Population outlook (Kent County) Hauer SSP2
- Today (2025)
- 712,484 people
- By 2030
- 748,618 · +5.1%
- By 2040
- 814,777 · +14.4%
- By 2050
- 868,556 · +21.9%
- By 2075
- 966,487 · +35.7%
- By 2100
- 967,975 · +35.9%
Race, ethnicity, and origin ACS 2023
- Neighborhood character
- Predominantly White (90%)
- Race & ethnicity
- White 90% Two or more races 5% Hispanic / Latino 3% Asian 2%
- Common ancestry
- Iranian 17% Romanian 9% Lithuanian 4%
- Foreign-born
- 2% · Vietnam, South Korea, Canada
- Languages at home
- 96% English-only · Spanish 1% Other Indo-European 1% Vietnamese 1%
Political lean MEDSL · Kent
- 2024 margin
- Lean D (+5.4) · D 51.8% · R 46.5% · Other 1.7%
- 2008→2024 swing
- +4.8pp toward D · 2008: 0.5pp · 2024: 5.4pp
- All cycles
- 2024: D+5.4 2020: D+6.1 2016: R+3.1 2012: R+7.9 2008: D+0.5
Not yet ingested
- Civics
- —
Market trends
- HPI YoY
- ▼ -109.19%
- Current HPI
- 290.9224
- Rent YoY
- —
- Metro
- —
- State GDP YoY
- ▲ 1.37%
- F500 in state
- 28
Industry mix (Fortune 500 HQ in MI)
| Industry | F500 HQs | Revenue |
|---|---|---|
| Automotive Parts | 3 | $48B |
|
||
| Automotive | 2 | $372B |
|
||
| Chemicals | 1 | $45B |
|
||
| Automotive Retail | 1 | $29B |
|
||
| Healthcare / Medical Devices | 1 | $23B |
|
||
| Automotive Technology | 1 | $20B |
|
||
Price history
+0.8% since first listed9 events — show timeline
- 2026-05-29 Sold (MLS) $252,000 SW Michigan MLS
- 2026-05-29 Sold (MLS) $252,000 MiRealSource-MiMLS
- 2026-05-29 Sold (MLS) $252,000 REALCOMP
- 2026-05-12 Pending — REALCOMP
- 2026-05-12 Pending — MiRealSource-MiMLS
- 2026-05-12 Pending — SW Michigan MLS
- 2026-05-06 Listed $249,900 REALCOMP
- 2026-05-06 Listed $249,900 SW Michigan MLS
- 2026-05-06 Listed $249,900 MiRealSource-MiMLS
Property tax history
+3.4%/yrLatest (2025): $2,158 · +2.8% YoY. Source: county tax records.
Cash-flow waterfall
monthlySold comps — $/sqft
last 12 mo · ≤1 miLoading sold comps…