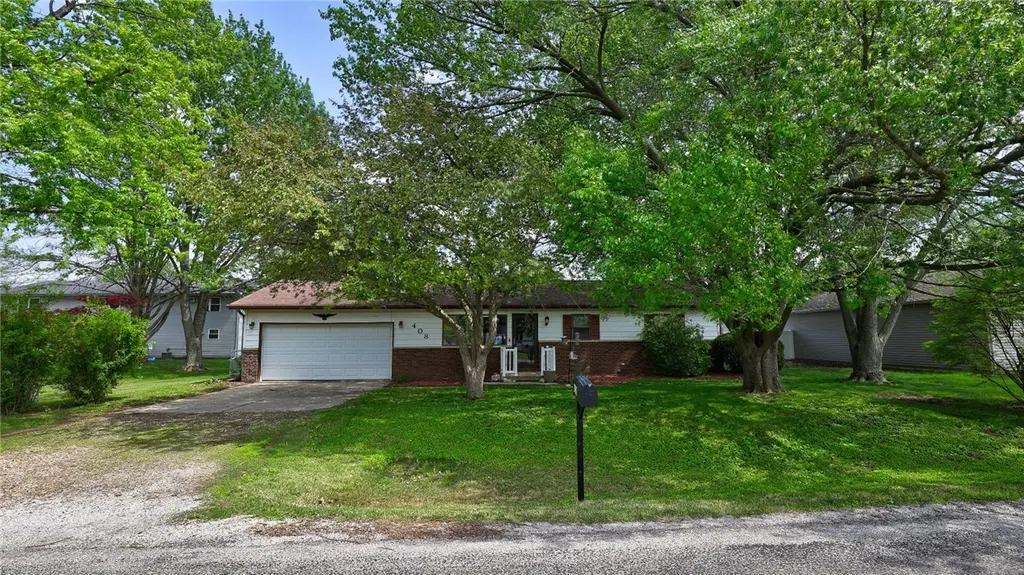
408 N Vine St · Moweaqua, IL
Flood risk 3/10 · Minor
- FEMA flood zone
- —
- Chance of flooding over 30 yrs
- 0.1%
- Est. flood insurance / yr
- —
Fire risk 1/10 · Minimal
- Est. fire insurance / yr
- $804 – $1,492
Heat risk 4/10 · Minor
- Hot days now (above 105°F)
- 7 days/yr
- Hot days in 30 yrs
- 19 days/yr
Wind risk 2/10 · Minimal
- Chance of severe wind over 30 yrs
- 2.0%
Air-quality risk 4/10 · Minor
- Unhealthy air days now
- 3 days/yr
- Unhealthy air days in 30 yrs
- 6 days/yr
Risk factors via First Street. Map © Google.
Why this score? — see what drove the D grade
The composite is a weighted blend of 9 inputs, each scored 0–100. Each bar is that input's sub-score; the figure is the points it added to the 100-point composite (weight × sub-score).
- Cash flow +11.3/30.0
- Appreciation +8.4/10.0
- ARV discount +7.5/15.0
- 1% rule +4.3/10.0
- DSCR +3.3/10.0
- Livability +3.2/5.0
- Rent growth +2.5/5.0
- Condition / age +2.5/5.0
- Schools +1.5/10.0
$115,000
🖨 Deal sheet 📄 Offer letter ✓ Due diligence
Listing remarks
Small-town living at its finest! The same family has lovingly owned this 3-bedroom, 2-bath ranch for over 40 years and has been home to three generations. Filled with warmth and character, this home offers comfortable living spaces and plenty of room to gather. The living room features a large bay window that fills the home with natural light. The oversized kitchen offers abundant cabinetry and counter space, making meal prep and entertaining a breeze. Just off the kitchen, the large family room with dining area provides the perfect place to relax and opens directly to the wood deck — ideal for hosting family and friends. The primary bedroom includes its own private bath, while the ad
Key facts
- Wood deck
- Oversized kitchen
- Fenced backyard
Tags
Property features AI
Exterior
- Parking: Attached garage with 2 spaces
- Utilities: Public water; Public sewer; Public power
- Home design: Single-family residence; One-level (single story)
- Construction: Brick and vinyl siding exterior; Shingle roof; Built on crawl space foundation
- Exterior features: Deck; Fenced yard; Concrete and gravel driveway/road access
Interior
- Kitchen: Dishwasher; Disposal; Microwave; Oven; Range; Refrigerator
- Bedrooms: 6 total rooms (includes bedrooms and living spaces)
- Bathrooms: 2 full bathrooms
- Heating & cooling: Natural gas forced-air heating; Central air
- Interior features: Pantry; Crawl space with sump pump
- Laundry & utility: Main level laundry; Gas water heater
Neighborhood map
What this means for you Summary
Snapshot
- This is a 3-bed/1.0-bath other listed at $115k.
Deal economics
- At list price, monthly cash flow is $-42 ($-503/yr) — negative.
- To cash-flow at today's rent, offer at most $108k (6.4% below list).
- To meet the 1% rule (rent ≥ 1% of price), the offer needs to be $107k (6.9% below list).
- Recommended offer: $107k (6.9% below list) — sets the bar for 1% rule.
Location & tenants
- Location reads 65/100 on livability (#616 in IL) — a middle-class / working-renter tenant base. Strengths: cost of living A+, housing A+, crime A; Watch: schools F, amenities F, commute F.
- Central A & M CUD 21 (rural): math 13% / reading 20% proficiency, ranked #477 of 620 in IL (top 77%) — low school quality limits family demand, transient renter base, plan for 1-2y turnover.
- Market conditions: 19 active listings in the ZIP; 41 units permitted in Shelby County in 2024 (0 in 5+ unit buildings).
Forward outlook
- In year one you build about $9k of equity ($795 loan paydown + $8k appreciation (6.7% local appreciation)).
- Shelby County population projected at -22% by 2050 — secular population decline; favor cash flow + early exit over multi-decade hold.
- At projected returns (6.7% appreciation + 3.0% rent growth), your $32k cash investment doubles in ~4 years — after that, you're playing with house money.
- By year 5, paydown + projected appreciation supports a ~$38k cash-out refi (75% LTV) — recoverable capital for the next deal without selling this one.
Negotiation context
- It's been on market 15 days — a 2% lower offer ($113k) is reasonable based on typical stale-listing flexibility.
Questions for the listing agent
- What do current leases actually rent for vs. the listed asking? Can we see a recent rent roll and the last 12 months of T-12 income?
- Built in 1977 — when were the roof, HVAC, electrical panel, plumbing, and water heater last replaced?
- Is there a deadline driving the sale (1031 exchange, divorce, estate, relocation)? That informs how much negotiation room exists.
- Schools are F-rated, which usually means shorter tenancies and higher turnover. Who's the typical renter profile here, and what's been the actual vacancy rate?
- The area grade is low — what's the realistic commute time and amenity access for the typical tenant pool here? Any planned neighborhood developments (good or bad) we should know about?
- What's the average days-on-market for RENTAL listings here right now (not sales)? A rising rental-DOM trend means longer vacancies and softer asking-rent achievability than the comps imply.
- What's the recent tenant-quality profile in this submarket — average credit score on applications, eviction rate, late-payment / NSF rate, and stable-employment percentage? A property-management company in the area should have these aggregated.
- How much new for-sale + rental construction is in the pipeline within 1–3 miles? Heavy new supply typically softens prices + rents 12–24 months out; constrained supply supports both.
Investment metrics
- 1% rule
- 0.93% ✗
- Cap rate
- 5.86%
- Cash-on-cash
- -1.56%
- DSCR
- 0.93
- GRM
- 8.9
CMA / ARV
No comps found within radius.
Projected returns pro-forma
6.72% appreciation · 3.0% rent growth · sell at horizon
- IRR
- 15.9%
- Equity multiple
- 2.11×
- Total profit
- $35,611
- Equity at exit
- $77,617
- IRR
- 15.7%
- Equity multiple
- 4.29×
- Total profit
- $105,888
- Equity at exit
- $145,596
Cash invested: $32,200 (down + closing). Projections, not guarantees.
Landlord ↔ Tenant lean methodology
- Overall (STATE)
- 43 Moderately Tenant-Leaning
- State Illinois
- 43 Moderately Tenant-Leaning · D+7
- County
- — inherits STATE
- City
- — inherits STATE
ZIP-level market 62550
- Home prices YoY
- 3.5%
- Active inventory
- 19
- Price-to-rent
- 8.9×
Monthly cashflow live
- Estimated rent
- $1,071 medium interval (Pro) →
- Mortgage (P&I)
- −$603
- Tax from tax record
- −$237 /mo · $2,844/yr
- Insurance
- −$48
- HOA
- −$0
- Vacancy / Maint / Mgmt
- −$225
- Net cashflow
- $-42
Break-even live
UW: 25.0% down · 7.5% · 30yr · 1.5% tax · 5.0% vac · 8.0% maint · 8.0% mgmt
Financing live
Cash to close
- Down payment
- $28,750
- Closing costs
- $3,450
- Reserves months
- —
- Total cash needed
- —
Loan-product check · same deal, 3 products live
Conventional
25% down · 7.5% · 30yr
- Down + closing
- —
- Monthly P&I
- —
- Monthly cashflow
- —
- DSCR
- —
- Eligible?
- —
Personal DTI + credit; lowest rate.
DSCR
20% down · 8.5% · 30yr
- Down + closing
- —
- Monthly P&I
- —
- Monthly cashflow
- —
- DSCR
- —
- Eligible?
- —
No personal income docs; deal must DSCR.
Hard money
10% down · 12.0% · 12mo
- Down + closing
- —
- Monthly P&I
- —
- Monthly cashflow
- —
- DSCR
- —
- Eligible?
- —
Short-term bridge; refi at stabilization.
Listing history 1 events
-
2026-05-14$115,000 Active 1104-char remark
ⓘ Source: listings_history table (triggers on properties + properties_extension) + one-shot
backfill from property_details.listing_events for pre-trigger history.
Tax reassessment forecast IL · Partial reset (capped growth)
- Current annual tax
- $2,844 · $237/mo
- Projected year-2 tax
- $2,844 · $237/mo
- Expected delta
- $0/yr ($0/mo · 0.0%)
ⓘ Screening estimate from a state-policy table — verify with the county assessor before closing.
Climate risk First Street
- Flood 3/10 Moderate 10% chance over 30 yrs
- Wildfire 1/10 Low
- Heat 4/10 Moderate 7 d/yr ≥105°F today · 19 d/yr by 30 yrs out
- Wind 2/10 Low 2% chance of damaging wind over 30 yrs
- Air quality 4/10 Moderate 3 unhealthy d/yr today · 6 by 30 yrs out
Nearby sold comps map
Loading sold comps map…
Walkable amenities ~0.75 mi
Loading nearby amenities…
Taxation est. · year 1
- Rental income
- $12,852
- − Mortgage interest
- −$6,442
- − Property taxes
- −$2,844
- − Insurance
- −$575
- − Repairs & maintenance
- −$1,028
- − Management
- −$1,028
- − Depreciation
- −$3,345
- Taxable loss
- −$2,411
- Est. tax savings @ 24.0%
- +$579
- After-tax cash flow
- $76/yr
For passive investors: Depreciation is non-cash, so a rental often shows a tax loss while cash-flowing — sheltering income. Rental losses are passive: they offset passive income freely, and up to $25,000/yr can offset ordinary (W-2) income if you actively participate and your MAGI is under $100k (phasing out to $0 by $150k); unused losses carry forward. On sale, claimed depreciation is recaptured at up to 25%, and gains may owe capital-gains tax (a 1031 exchange can defer both). Figures are a year-1 estimate at your 24.0% rate — not tax advice; consult a CPA.
Schools (NCES district)
- District
- Central A & M CUD 21
- NCES district ID
- 1709100
- Math proficiency
- 13% ▼ -5.00%
- Reading proficiency
- 20% ▼ -7.00%
- Median HH income
- $50,388
- Composite
- 15.02/100
- National rank
- #9357
- State rank
- #477 of 620 in IL
Livability — Moweaqua
- Score
- 65/100
- State rank
- #616
- US rank
- #12660
Category grades
Schools grade is shown separately in the Schools card above.
Census & demographics
- Census place
- Moweaqua, IL
- Population (ZIP)
- 3,070
Population outlook (Shelby County) Hauer SSP2
- Today (2025)
- 20,512 people
- By 2030
- 19,675 · -4.1%
- By 2040
- 17,851 · -13.0%
- By 2050
- 15,973 · -22.1%
- By 2075
- 11,799 · -42.5%
- By 2100
- 8,030 · -60.9%
Race, ethnicity, and origin ACS 2023
- Neighborhood character
- Predominantly White (94%)
- Race & ethnicity
- White 94% Hispanic / Latino 3% Two or more races 2% Native American 1%
- Common ancestry
- Iranian 3% Slovak 3% Lithuanian 2%
- Foreign-born
- 0%
- Languages at home
- 98% English-only · Spanish 1%
Political lean MEDSL · Shelby
- 2024 margin
- Solid R (+60.2) · D 19.2% · R 79.5% · Other 1.4%
- 2008→2024 swing
- -40.5pp toward R · 2008: -19.8pp · 2024: -60.2pp
- All cycles
- 2024: R+60.2 2020: R+57.2 2016: R+54.3 2012: R+33.7 2008: R+19.8
Not yet ingested
- Civics
- —
Market trends
- HPI YoY
- ▲ 6.72%
- Current HPI
- 197.0448
- Rent YoY
- —
- Metro
- —
- State GDP YoY
- ▲ 1.59%
- F500 in state
- 60
Industry mix (Fortune 500 HQ in IL)
| Industry | F500 HQs | Revenue |
|---|---|---|
| Insurance | 4 | $201B |
|
||
| Consumer Goods | 4 | $87B |
|
||
| Industrial Machinery | 3 | $64B |
|
||
| Healthcare | 2 | $55B |
|
||
| Retail / Pharmacy | 1 | $148B |
|
||
| Agriculture / Food | 1 | $86B |
|
||
Price history
1 event — show timeline
- 2026-05-14 Listed $115,000 CIBR
Property tax history
+8.6%/yrLatest (2024): $2,844 · +7.6% YoY. Source: county tax records.
Cash-flow waterfall
monthlySold comps — $/sqft
last 12 mo · ≤1 miLoading sold comps…