2105 Highway 865 · Winnsboro, LA
Flood risk 1/10 · Minimal
- FEMA flood zone
- X (unshaded)
- Chance of flooding over 30 yrs
- 0.0%
- Est. flood insurance / yr
- $507 – $1,088
Fire risk 3/10 · Minor
- Est. fire insurance / yr
- $1,269 – $2,357
Heat risk 7/10 · Major
- Hot days now (above 112°F)
- 7 days/yr
- Hot days in 30 yrs
- 19 days/yr
Wind risk 8/10 · Major
- Chance of severe wind over 30 yrs
- 80.0%
Air-quality risk 1/10 · Minimal
- Unhealthy air days now
- 0 days/yr
- Unhealthy air days in 30 yrs
- 0 days/yr
Risk factors via First Street. Map © Google.
Why this score? — see what drove the B grade
The composite is a weighted blend of 9 inputs, each scored 0–100. Each bar is that input's sub-score; the figure is the points it added to the 100-point composite (weight × sub-score).
- Cash flow +30.0/30.0
- ARV discount +12.7/15.0
- DSCR +10.0/10.0
- 1% rule +8.6/10.0
- Livability +3.0/5.0
- Rent growth +2.5/5.0
- Condition / age +2.5/5.0
- Schools +1.5/10.0
- Appreciation +0.0/10.0
$155,000
🖨 Deal sheet 📄 Offer letter ✓ Due diligence
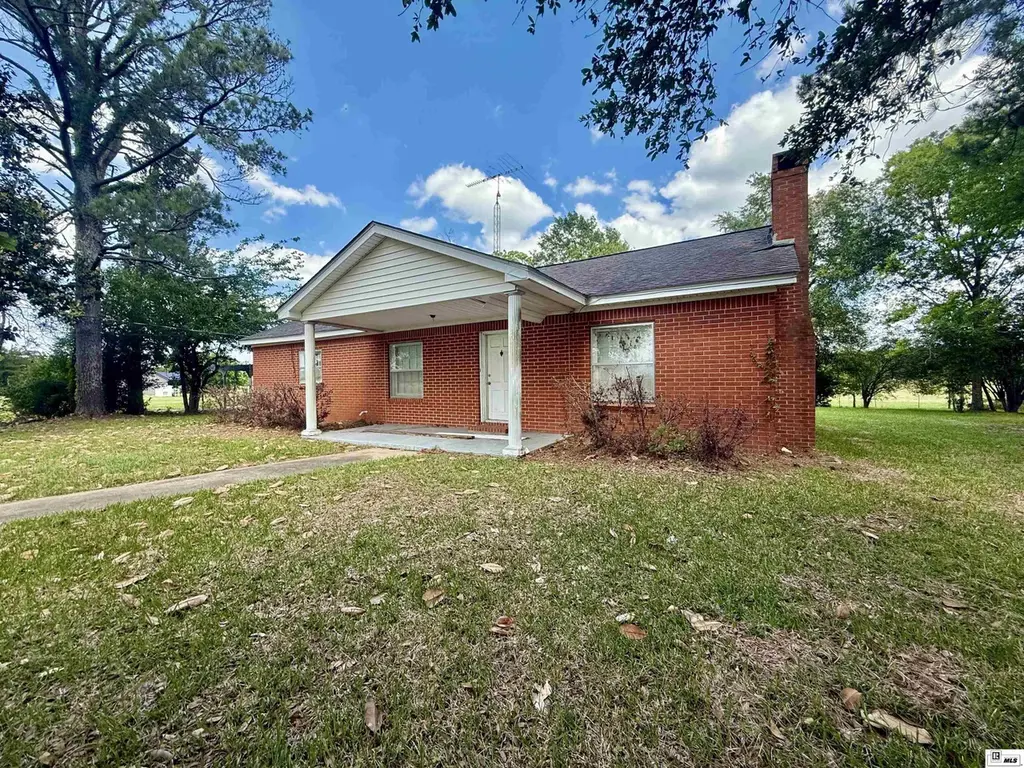
Listing remarks
Come see what hit the market in Winnsboro! Looking to not break the bank but get you a nice place then look no further than 2109 Highway 865. Nice 3 bed 1.5 bath brick home on a nice 3 Acre track of land! Set way off the road towards the back of the property and perfectly situated! Drive down the long driveway up and into your new home with mature oak trees greeting you on the way in! Pull up one of the two car carport and step inside. Inside is a nice open sunroom with large windows that is separate from the other side of the house! Right off of the dining room area is a nice sized master suite! The kitchen is large and spacious with lots of cabinet space and countertop space! Right of
Key facts
- 3 acre track of land
- Mature oak trees
- Long driveway
Tags
Property features AI
Finance
- HOA & community: No association amenities
Exterior
- Parking: 3-car garage; Carport; Open parking
- Utilities: Propane for utilities; Septic tank; Other water source
- Home design: Single-family residence, site-built; One level, entry at level 1
- Construction: Brick veneer construction; Asphalt roof; Slab foundation; Built as residential (site build)
- Exterior features: Covered patio/porch; Landscaped lot with views; No fencing
Interior
- Bedrooms: 3 main-level bedrooms
- Bathrooms: 2 full bathrooms (both on main level)
- Heating & cooling: Central heating; Central air conditioning
- Interior features: Fireplace (1); Wood window frames; Other interior features
Neighborhood map
What this means for you Summary
Snapshot
- This is a 3-bed/2.0-bath single-family listed at $155k.
Deal economics
- At list price, monthly cash flow is $704 ($8k/yr) — positive.
- The deal already cash-flows at list — no discount required.
- Meets the 1% rule at list price ($2k rent vs $155k).
Location & tenants
- Location reads 59/100 on livability (#278 in LA) — a working-class tenant base; expect higher turnover. Strengths: cost of living A+; Watch: health & safety D, schools F, crime D-.
- Franklin Parish (rural): math 14% / reading 22% proficiency, ranked #71 of 98 in LA (top 72%) — low school quality limits family demand, transient renter base, plan for 1-2y turnover; 78% free/reduced lunch — lower-income household profile, screen leases tightly.
- Market conditions: 44 active listings in the ZIP; 17 units permitted in Franklin Parish in 2024 (0 in 5+ unit buildings).
Forward outlook
- Local home prices are declining (-3.0%/yr); year-one equity from $1k of loan paydown is wiped out by about $5k of value loss. Plan a longer hold.
- Franklin County population projected at -14% by 2050 — secular population decline; favor cash flow + early exit over multi-decade hold.
- At projected returns (-3.0% appreciation + 3.0% rent growth), your $43k cash investment doubles in ~7 years — after that, you're playing with house money.
Negotiation context
- Only 14 days on market — expect competitive offers; lowballing is unlikely to land.
- 2 sale attempts with the ask held roughly flat each time — persistent listings suggest the price (not the market) is what's stuck; bring a comps-based counter.
- Current owner paid $75k; list at $155k implies a 107% gain — meaningful room to come down on a strong offer.
Risks & watch-outs
- Climate carrying-cost: severe wind risk, 80% chance of damaging wind over 30y; extreme-heat days projected 7→19/yr by 2055 (HVAC capex compounding) — expect insurance premiums to compound above CPI over the hold.
Questions for the listing agent
- Is there a deadline driving the sale (1031 exchange, divorce, estate, relocation)? That informs how much negotiation room exists.
- Schools are F-rated, which usually means shorter tenancies and higher turnover. Who's the typical renter profile here, and what's been the actual vacancy rate?
- Crime grade is D in this area — have there been break-ins, vandalism, or insurance claims at this property in the last 3 years? What carrier currently insures it and at what premium?
- What's the average days-on-market for RENTAL listings here right now (not sales)? A rising rental-DOM trend means longer vacancies and softer asking-rent achievability than the comps imply.
- What's the recent tenant-quality profile in this submarket — average credit score on applications, eviction rate, late-payment / NSF rate, and stable-employment percentage? A property-management company in the area should have these aggregated.
- How much new for-sale + rental construction is in the pipeline within 1–3 miles? Heavy new supply typically softens prices + rents 12–24 months out; constrained supply supports both.
Investment metrics
- 1% rule
- 1.36% ✓
- Cap rate
- 11.75%
- Cash-on-cash
- 19.48%
- DSCR
- 1.87
- GRM
- 6.1
CMA / ARV
- ARV (on-the-fly)
- $175,440
- Comps found
- 4
Show comp detail 4 sales within ~0.75 mi
| Address | Dist | Beds/Ba | Sqft | Sold | Price | $/sf | Match |
|---|---|---|---|---|---|---|---|
| 177 Collins Rd | 0.69mi | 3/3.0 | 2,009 (-2%) | 21mo | $175,000 | $87 | 43 |
| 2010 West St | 0.72mi | 4/2.0 (+1) | 1,913 (-6%) | 11mo | $164,000 | $86 | 42 |
| 2609 Loop Rd | 0.60mi | 3/2.0 | 2,229 (+9%) | 20mo | $175,000 | $79 | 40 |
| 811 Kennon Dr | 0.75mi | 3/1.5 | 1,816 (-11%) | 21mo | $125,000 | $69 | 27 |
Match score weights: distance 35% · size 25% · config 20% · recency 20%. Top-matched comps best support the ARV.
Projected returns pro-forma
-3.0% appreciation · 3.0% rent growth · sell at horizon
- IRR
- 11.5%
- Equity multiple
- 1.45×
- Total profit
- $19,705
- Equity at exit
- $23,111
- IRR
- 20.4%
- Equity multiple
- 2.72×
- Total profit
- $74,765
- Equity at exit
- $13,402
Cash invested: $43,400 (down + closing). Projections, not guarantees.
Landlord ↔ Tenant lean methodology
- Overall (STATE)
- 90 Strongly Landlord-Friendly
- State Louisiana
- 90 Strongly Landlord-Friendly · R+12
- County
- — inherits STATE
- City
- — inherits STATE
ZIP-level market 71295
- Home prices YoY
- -20.6%
- Active inventory
- 44
- Price-to-rent
- 6.1×
Monthly cashflow live
- Estimated rent
- $2,102 medium interval (Pro) →
- Mortgage (P&I)
- −$813
- Tax from tax record
- −$79 /mo · $943/yr
- Insurance
- −$65
- HOA
- −$0
- Vacancy / Maint / Mgmt
- −$441
- Net cashflow
- $704
Break-even live
UW: 25.0% down · 7.5% · 30yr · 1.5% tax · 5.0% vac · 8.0% maint · 8.0% mgmt
Financing live
Cash to close
- Down payment
- $38,750
- Closing costs
- $4,650
- Reserves months
- —
- Total cash needed
- —
Loan-product check · same deal, 3 products live
Conventional
25% down · 7.5% · 30yr
- Down + closing
- —
- Monthly P&I
- —
- Monthly cashflow
- —
- DSCR
- —
- Eligible?
- —
Personal DTI + credit; lowest rate.
DSCR
20% down · 8.5% · 30yr
- Down + closing
- —
- Monthly P&I
- —
- Monthly cashflow
- —
- DSCR
- —
- Eligible?
- —
No personal income docs; deal must DSCR.
Hard money
10% down · 12.0% · 12mo
- Down + closing
- —
- Monthly P&I
- —
- Monthly cashflow
- —
- DSCR
- —
- Eligible?
- —
Short-term bridge; refi at stabilization.
Listing history 8 events
-
2026-06-01status $155,000 Pending 14 DOM
-
2026-06-01days on market $155,000 Active 14 DOM
-
2026-05-31days on market $155,000 Active 13 DOM
-
2026-05-31days on market $155,000 Active 12 DOM
-
2026-05-15$155,000 Active
-
2025-12-13$200,000 Active
-
2013-05-23soldstatus $75,000
-
2011-08-15soldstatus $48,000
ⓘ Source: listings_history table (triggers on properties + properties_extension) + one-shot
backfill from property_details.listing_events for pre-trigger history.
Tax reassessment forecast LA · Resets to sale price
- Current annual tax
- $943 · $79/mo
- Projected year-2 tax
- $943 · $79/mo
- Expected delta
- $0/yr ($0/mo · 0.0%)
ⓘ Screening estimate from a state-policy table — verify with the county assessor before closing.
Climate risk First Street
- Flood 1/10 Low FEMA zone X (unshaded) · 0% chance over 30 yrs
- Wildfire 3/10 Moderate
- Heat 7/10 Severe 7 d/yr ≥112°F today · 19 d/yr by 30 yrs out
- Wind 8/10 Severe 80% chance of damaging wind over 30 yrs
- Air quality 1/10 Low 0 unhealthy d/yr today · 0 by 30 yrs out
Nearby sold comps map
Loading sold comps map…
Walkable amenities ~0.75 mi
Loading nearby amenities…
Taxation est. · year 1
- Rental income
- $25,220
- − Mortgage interest
- −$8,682
- − Property taxes
- −$943
- − Insurance
- −$775
- − Repairs & maintenance
- −$2,018
- − Management
- −$2,018
- − Depreciation
- −$4,509
- Taxable income
- $6,276
- Est. tax owed @ 24.0%
- −$1,506
- After-tax cash flow
- $6,946/yr
For passive investors: Depreciation is non-cash, so a rental often shows a tax loss while cash-flowing — sheltering income. Rental losses are passive: they offset passive income freely, and up to $25,000/yr can offset ordinary (W-2) income if you actively participate and your MAGI is under $100k (phasing out to $0 by $150k); unused losses carry forward. On sale, claimed depreciation is recaptured at up to 25%, and gains may owe capital-gains tax (a 1031 exchange can defer both). Figures are a year-1 estimate at your 24.0% rate — not tax advice; consult a CPA.
Schools (NCES district)
- District
- Franklin Parish
- NCES district ID
- 2200660
- Math proficiency
- 14% ▼ -42.00%
- Reading proficiency
- 22% ▼ -35.00%
- Median HH income
- $32,403
- Composite
- 14.55/100
- National rank
- #9416
- State rank
- #71 of 98 in LA
Livability — Winnsboro
- Score
- 59/100
- State rank
- #278
- US rank
- #20151
Category grades
Schools grade is shown separately in the Schools card above.
Census & demographics
- Population (ZIP)
- 14,008
Population outlook (Franklin County) Hauer SSP2
- Today (2025)
- 19,537 people
- By 2030
- 18,985 · -2.8%
- By 2040
- 17,886 · -8.5%
- By 2050
- 16,828 · -13.9%
- By 2075
- 14,273 · -26.9%
- By 2100
- 11,435 · -41.5%
Race, ethnicity, and origin ACS 2023
- Neighborhood character
- Majority White (61%)
- Race & ethnicity
- White 61% Black 33% Two or more races 4% Hispanic / Latino 2%
- Common ancestry
- Lithuanian 2% Italian 1% Slovak 1%
- Foreign-born
- 0%
- Languages at home
- 96% English-only · Spanish 2% French/Haitian/Cajun 1%
Political lean MEDSL · Franklin
- 2024 margin
- Solid R (+49.2) · D 25.0% · R 74.2%
- 2008→2024 swing
- -13.7pp toward R · 2008: -35.5pp · 2024: -49.2pp
- All cycles
- 2024: R+49.2 2020: R+44.4 2016: R+43.8 2012: R+36.1 2008: R+35.5
Not yet ingested
- Civics
- —
Market trends
- HPI YoY
- ▼ -35.67%
- Current HPI
- 137.0883
- Rent YoY
- —
- Metro
- —
- State GDP YoY
- ▲ 3.29%
- F500 in state
- 10
Industry mix (Fortune 500 HQ in LA)
| Industry | F500 HQs | Revenue |
|---|---|---|
| Telecommunications | 2 | $23B |
|
||
| Utilities | 1 | $12B |
|
||
| Wholesale / Distribution | 1 | $5B |
|
||
| Advertising | 1 | $2B |
|
||
Price history
+222.9% since first listed4 events — show timeline
- 2026-05-15 Listed $155,000 NELABOR
- 2025-12-13 Listed $200,000 NELABOR
- 2013-05-23 Sold (Public Records) $75,000 Public Records
- 2011-08-15 Sold (Public Records) $48,000 Public Records
Property tax history
+2.8%/yrLatest (2025): $943 · +0.1% YoY. Source: county tax records.
Cash-flow waterfall
monthlySold comps — $/sqft
last 12 mo · ≤1 miLoading sold comps…