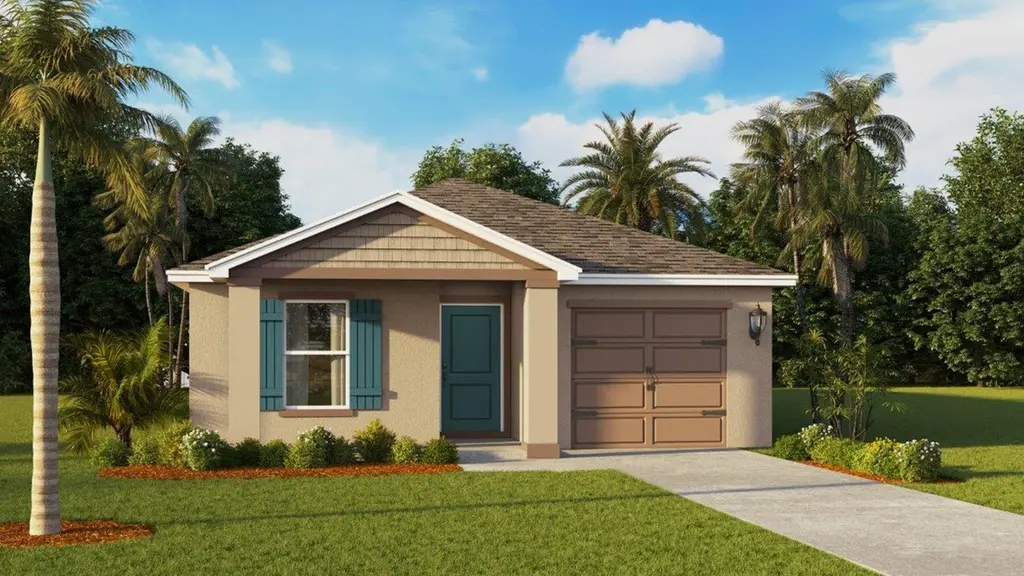
1114 Amber Waves Ct · Lake Wales, FL
Flood risk 1/10 · Minimal
- FEMA flood zone
- X (unshaded)
- Chance of flooding over 30 yrs
- 0.0%
- Est. flood insurance / yr
- $507 – $1,088
Fire risk 5/10 · Moderate
- Est. fire insurance / yr
- $947 – $1,759
Heat risk 8/10 · Major
- Hot days now (above 108°F)
- 7 days/yr
- Hot days in 30 yrs
- 23 days/yr
Wind risk 10/10 · Severe
- Chance of severe wind over 30 yrs
- 99.0%
Air-quality risk 1/10 · Minimal
- Unhealthy air days now
- 0 days/yr
- Unhealthy air days in 30 yrs
- 0 days/yr
Risk factors via First Street. Map © Google.
Why this score? — see what drove the D- grade
The composite is a weighted blend of 9 inputs, each scored 0–100. Each bar is that input's sub-score; the figure is the points it added to the 100-point composite (weight × sub-score).
- Cash flow +11.6/30.0
- ARV discount +7.5/15.0
- Condition / age +4.0/5.0
- Schools +3.5/10.0
- DSCR +3.4/10.0
- Livability +3.4/5.0
- 1% rule +3.3/10.0
- Rent growth +2.5/5.0
- Appreciation +0.0/10.0
$259,900
🖨 Deal sheet 📄 Offer letter ✓ Due diligence
Listing remarks
The property is located at 1114 Amber Waves Court LAKE WALES FL 33859 priced at 259900, the square foot and stories are 1739, 1.The number of bath is 2, halfbath is 0 there are 5 bedrooms and 1 garages. For more details please, call or email.
Key facts
- Garage
- Built 2026
- Listed 22 days
Property features AI
Finance
- Other: Address: 1114 Amber Waves Ct, Lake Wales FL 33859; Status: Active; Last modified: 2026-05-27
- Financial info: List price $261,990
Exterior
- Parking: 1 garage space (1 parking space total)
- Home design: Single-family property
- Exterior features: Living area 1,739
Interior
- Bedrooms: 5 bedrooms
- Bathrooms: 2 full bathrooms
- Interior features: Spec-built home (ALFORD plan)
Neighborhood map
What this means for you Summary
Snapshot
- This is a 5-bed/2.0-bath single-family listed at $260k. Condition is rated good.
Deal economics
- At list price, monthly cash flow is $-82 ($-987/yr) — negative.
- To cash-flow at today's rent, offer at most $248k (4.6% below list).
- To meet the 1% rule (rent ≥ 1% of price), the offer needs to be $217k (16.5% below list).
- Recommended offer: $217k (16.5% below list) — sets the bar for 1% rule.
Location & tenants
- Location reads 68/100 on livability (#535 in FL) — a middle-class / working-renter tenant base. Strengths: cost of living A+, housing A+; Watch: employment D+, schools D, amenities F.
- Polk (suburban): math 39% / reading 43% proficiency, ranked #62 of 73 in FL (top 85%) — families likely to look elsewhere, expect single-tenant / working-renter base with shorter leases.
- Market conditions: 261 active listings in the ZIP; 11 comparable units currently listed for rent nearby; rentals at typical pace (median 15d on market — plan ~3-4 weeks tenant-placement turnaround); 10,384 units permitted in Polk County in 2024 (1,716 in 5+ unit buildings).
- At $2,169/mo this rent would consume 45% of the median local household income ($58k/yr) (locally 408% of renters already pay >50% of income on rent) — very limited rent-growth headroom before tenants either downsize or default.
Forward outlook
- Local home prices are declining (-3.0%/yr); year-one equity from $2k of loan paydown is wiped out by about $8k of value loss. Plan a longer hold.
- Polk County population projected at +33% by 2050 — long-run rental-demand tailwind backs the buy-and-hold thesis.
Negotiation context
- It's been on market 22 days — a 2% lower offer ($256k) is reasonable based on typical stale-listing flexibility.
Risks & watch-outs
- Climate carrying-cost: severe wind risk, 99% chance of damaging wind over 30y; moderate wildfire risk; extreme-heat days projected 7→23/yr by 2055 (HVAC capex compounding) — expect insurance premiums to compound above CPI over the hold.
Questions for the listing agent
- What do current leases actually rent for vs. the listed asking? Can we see a recent rent roll and the last 12 months of T-12 income?
- Is there a deadline driving the sale (1031 exchange, divorce, estate, relocation)? That informs how much negotiation room exists.
- Schools are D-rated, which usually means shorter tenancies and higher turnover. Who's the typical renter profile here, and what's been the actual vacancy rate?
- The area grade is low — what's the realistic commute time and amenity access for the typical tenant pool here? Any planned neighborhood developments (good or bad) we should know about?
- What's the average days-on-market for RENTAL listings here right now (not sales)? A rising rental-DOM trend means longer vacancies and softer asking-rent achievability than the comps imply.
- What's the recent tenant-quality profile in this submarket — average credit score on applications, eviction rate, late-payment / NSF rate, and stable-employment percentage? A property-management company in the area should have these aggregated.
- How much new for-sale + rental construction is in the pipeline within 1–3 miles? Heavy new supply typically softens prices + rents 12–24 months out; constrained supply supports both.
Investment metrics
- 1% rule
- 0.83% ✗
- Cap rate
- 5.91%
- Cash-on-cash
- -1.36%
- DSCR
- 0.94
- GRM
- 10.0
CMA / ARV
No comps found within radius.
Projected returns pro-forma
-3.0% appreciation · 3.0% rent growth · sell at horizon
- IRR
- -18.5%
- Equity multiple
- 0.35×
- Total profit
- $-47,318
- Equity at exit
- $38,752
- IRR
- -10.9%
- Equity multiple
- 0.34×
- Total profit
- $-47,814
- Equity at exit
- $22,471
Cash invested: $72,772 (down + closing). Projections, not guarantees.
Landlord ↔ Tenant lean methodology
- Overall (STATE)
- 87 Strongly Landlord-Friendly
- State Florida
- 87 Strongly Landlord-Friendly · R+3
- County
- — inherits STATE
- City
- — inherits STATE
ZIP-level market 33859
- Home prices YoY
- -16.6%
- Active inventory
- 261
- Price-to-rent
- 10.0×
Monthly cashflow live
- Estimated rent
- $2,169 high interval (Pro) →
- Mortgage (P&I)
- −$1,363
- Tax est. 1.5%
- −$325 /mo · $3,898/yr
- Insurance
- −$108
- HOA
- −$0
- Vacancy / Maint / Mgmt
- −$456
- Net cashflow
- $-82
Break-even live
UW: 25.0% down · 7.5% · 30yr · 1.5% tax · 5.0% vac · 8.0% maint · 8.0% mgmt
Financing live
Cash to close
- Down payment
- $64,975
- Closing costs
- $7,797
- Reserves months
- —
- Total cash needed
- —
Loan-product check · same deal, 3 products live
Conventional
25% down · 7.5% · 30yr
- Down + closing
- —
- Monthly P&I
- —
- Monthly cashflow
- —
- DSCR
- —
- Eligible?
- —
Personal DTI + credit; lowest rate.
DSCR
20% down · 8.5% · 30yr
- Down + closing
- —
- Monthly P&I
- —
- Monthly cashflow
- —
- DSCR
- —
- Eligible?
- —
No personal income docs; deal must DSCR.
Hard money
10% down · 12.0% · 12mo
- Down + closing
- —
- Monthly P&I
- —
- Monthly cashflow
- —
- DSCR
- —
- Eligible?
- —
Short-term bridge; refi at stabilization.
Rent comps 11 comps
| Address | Beds | Baths | Sqft | Rent | $/sqft | DOM | Units | Dist |
|---|---|---|---|---|---|---|---|---|
| 1139 Amber Waves Ct Lake Wales, FL | 5.0 | 2.0 | 1739 | $1,795 | $1.03 | 14d | 1 | 0.02mi |
| 517 Bell Prairie Cir Lake Wales, FL | 4.0 | 2.5 | 1897 | $2,100 | $1.11 | 14d | 1 | 0.08mi |
| 626 Bell Prairie Cir Lake Wales, FL | 4.0 | 2.0 | 1931 | $2,600 | $1.35 | 23d | 1 | 0.13mi |
| 645 Bell Prairie Cir Lake Wales, FL | 4.0 | 2.5 | 1933 | $2,000 | $1.03 | 11d | 1 | 0.14mi |
| 338 Rustic Rail Dr Lake Wales, FL | 4.0 | 2.0 | 1841 | $2,150 | $1.17 | 14d | 1 | 0.14mi |
| 346 Rustic Rail Dr Lake Wales, FL | 4.0 | 2.0 | 1844 | $2,150 | $1.17 | 14d | 1 | 0.16mi |
| 598 Bell Prairie Cir Lake Wales, FL | 4.0 | 2.5 | 1931 | $2,100 | $1.09 | 23d | 1 | 0.18mi |
| 413 Singing Sands Cir Lake Wales, FL | 4.0 | 2.0 | 1817 | $1,950 | $1.07 | 3d | 1 | 0.18mi |
| 343 Dinner Lake Ct Lake Wales, FL | 4.0 | 2.0 | 1801 | $2,400 | $1.33 | 14d | 1 | 0.36mi |
| 238 Dinner Lake Pl Lake Wales, FL | 4.0 | 2.0 | 1913 | $1,950 | $1.02 | 23d | 1 | 0.41mi |
| 802 Ballantyne Dr Lake Wales, FL | 4.0 | 2.0 | 1928 | $2,100 | $1.09 | 23d | 1 | 0.65mi |
Listing history 13 events
-
2026-06-18days on market $259,900 Active 22 DOM
-
2026-06-17days on market $259,900 Active 21 DOM
-
2026-06-16days on market $259,900 Active 20 DOM
-
2026-06-15days on market $259,900 Active 19 DOM
-
2026-06-13pricedays on market $259,900 Active 17 DOM
-
2026-06-10days on market $261,990 Active 14 DOM
-
2026-06-09days on market $261,990 Active 13 DOM
-
2026-06-08days on market $261,990 Active 12 DOM
-
2026-06-07days on market $261,990 Active 11 DOM
-
2026-06-05days on market $261,990 Active 8 DOM
-
2026-06-03days on market $261,990 Active 6 DOM
-
2026-06-01days on market $261,990 Active 5 DOM
-
2026-05-31days on market $261,990 Active 4 DOM
ⓘ Source: listings_history table (triggers on properties + properties_extension) + one-shot
backfill from property_details.listing_events for pre-trigger history.
Climate risk First Street
- Flood 1/10 Low FEMA zone X (unshaded) · 0% chance over 30 yrs
- Wildfire 5/10 Major
- Heat 8/10 Severe 7 d/yr ≥108°F today · 23 d/yr by 30 yrs out
- Wind 10/10 Extreme 99% chance of damaging wind over 30 yrs
- Air quality 1/10 Low 0 unhealthy d/yr today · 0 by 30 yrs out
Nearby sold comps map
Loading sold comps map…
Walkable amenities ~0.75 mi
Loading nearby amenities…
Taxation est. · year 1
- Rental income
- $26,034
- − Mortgage interest
- −$14,558
- − Property taxes
- −$3,898
- − Insurance
- −$1,300
- − Repairs & maintenance
- −$2,083
- − Management
- −$2,083
- − Depreciation
- −$7,561
- Taxable loss
- −$5,449
- Est. tax savings @ 24.0%
- +$1,308
- After-tax cash flow
- $321/yr
For passive investors: Depreciation is non-cash, so a rental often shows a tax loss while cash-flowing — sheltering income. Rental losses are passive: they offset passive income freely, and up to $25,000/yr can offset ordinary (W-2) income if you actively participate and your MAGI is under $100k (phasing out to $0 by $150k); unused losses carry forward. On sale, claimed depreciation is recaptured at up to 25%, and gains may owe capital-gains tax (a 1031 exchange can defer both). Figures are a year-1 estimate at your 24.0% rate — not tax advice; consult a CPA.
Condition & rehab AI · 3 photos
This single-family home is in excellent condition with no visible repairs needed. It offers a good investment opportunity with potential for minor updates to enhance its resale and rental value.
Value-add opportunities
- Both Painting exterior and interior — Enhances curb appeal and interior aesthetics
- Both Landscaping improvements — Enhances curb appeal and adds value
- Both New flooring in bathrooms and kitchen — Improves functionality and aesthetics
- Both New paint in interior walls — Enhances interior aesthetics and value
Renovation cost estimate screening
Value-add ROI direction
- Both Painting exterior and interior — Enhances curb appeal and interior aesthetics ↑
- Both Landscaping improvements — Enhances curb appeal and adds value ↑
- Both New flooring in bathrooms and kitchen — Improves functionality and aesthetics ↑
- Both New paint in interior walls — Enhances interior aesthetics and value ↑
ⓘ Cost ranges are severity-bucket heuristics (US national rule-of-thumb). Get contractor quotes + a written scope before underwriting a rehab budget.
Schools (NCES district)
- District
- Polk
- NCES district ID
- 1201590
- Math proficiency
- 39% ▼ -11.00%
- Reading proficiency
- 43% ▼ -4.00%
- Median HH income
- $43,979
- Composite
- 34.74/100
- National rank
- #5132
- State rank
- #62 of 73 in FL
Livability — Lake Wales
- Score
- 68/100
- State rank
- #535
- US rank
- #10036
Category grades
Schools grade is shown separately in the Schools card above.
Census & demographics
- Census place
- Lake Wales, FL
- County
- Polk County · 740,051 people
- City population
- 30,351
- Metro
- Lakeland-Winter Haven, FL
- Population (ZIP)
- 11,824
- Household income
- $57,760
- Rent vs Own
- Severe rent burden
- 408.0
Population outlook (Polk County) Hauer SSP2
- Today (2025)
- 752,975 people
- By 2030
- 804,621 · +6.9%
- By 2040
- 906,117 · +20.3%
- By 2050
- 1,000,476 · +32.9%
- By 2075
- 1,197,520 · +59.0%
- By 2100
- 1,271,518 · +68.9%
Race, ethnicity, and origin ACS 2023
- Neighborhood character
- Majority White (61%)
- Race & ethnicity
- White 61% Hispanic / Latino 25% Two or more races 13% Black 11%
- Hispanic origin (detail)
- Mexican 11% Puerto Rican 6% Cuban 1% Dominican 4%
- Common ancestry
- Lithuanian 2% Romanian 1% Serbian 1%
- Foreign-born
- 10% · Canada
- Languages at home
- 79% English-only · Spanish 19% French/Haitian/Cajun 1%
Political lean MEDSL · Polk
- 2024 margin
- Strong R (+20.7) · D 39.2% · R 59.9%
- 2008→2024 swing
- -14.6pp toward R · 2008: -6.1pp · 2024: -20.7pp
- All cycles
- 2024: R+20.7 2020: R+14.4 2016: R+14.1 2012: R+6.8 2008: R+6.1
Not yet ingested
- Civics
- —
Market trends
- HPI YoY
- ▼ -53.19%
- Current HPI
- 267.4537
- Rent YoY
- —
- Metro
- Lakeland-Winter Haven, FL
- State GDP YoY
- ▲ 3.28%
- F500 in state
- 36
Industry mix (Fortune 500 HQ in FL)
| Industry | F500 HQs | Revenue |
|---|---|---|
| Industrial Technology | 2 | $29B |
|
||
| Insurance | 2 | $17B |
|
||
| Retail | 1 | $60B |
|
||
| Technology Distribution | 1 | $58B |
|
||
| Homebuilding | 1 | $35B |
|
||
| Technology Manufacturing | 1 | $35B |
|
||
Cash-flow waterfall
monthlySold comps — $/sqft
last 12 mo · ≤1 miLoading sold comps…