73 S Elmer Ave · Halifax, PA
Flood risk 9/10 · Severe
- FEMA flood zone
- X (unshaded)
- Chance of flooding over 30 yrs
- 0.99%
- Est. flood insurance / yr
- $473 – $860
Fire risk 1/10 · Minimal
- Est. fire insurance / yr
- $511 – $949
Heat risk 5/10 · Moderate
- Hot days now (above 100°F)
- 7 days/yr
- Hot days in 30 yrs
- 16 days/yr
Wind risk 2/10 · Minimal
- Chance of severe wind over 30 yrs
- 3.0%
Air-quality risk 1/10 · Minimal
- Unhealthy air days now
- 0 days/yr
- Unhealthy air days in 30 yrs
- 0 days/yr
Risk factors via First Street. Map © Google.
Why this score? — see what drove the B- grade
The composite is a weighted blend of 9 inputs, each scored 0–100. Each bar is that input's sub-score; the figure is the points it added to the 100-point composite (weight × sub-score).
- Cash flow +30.0/30.0
- DSCR +10.0/10.0
- 1% rule +9.8/10.0
- ARV discount +7.5/15.0
- Schools +3.6/10.0
- Livability +3.5/5.0
- Rent growth +2.5/5.0
- Condition / age +2.5/5.0
- Appreciation +0.0/10.0
$65,000
🖨 Deal sheet 📄 Offer letter ✓ Due diligence
Listing remarks MLS
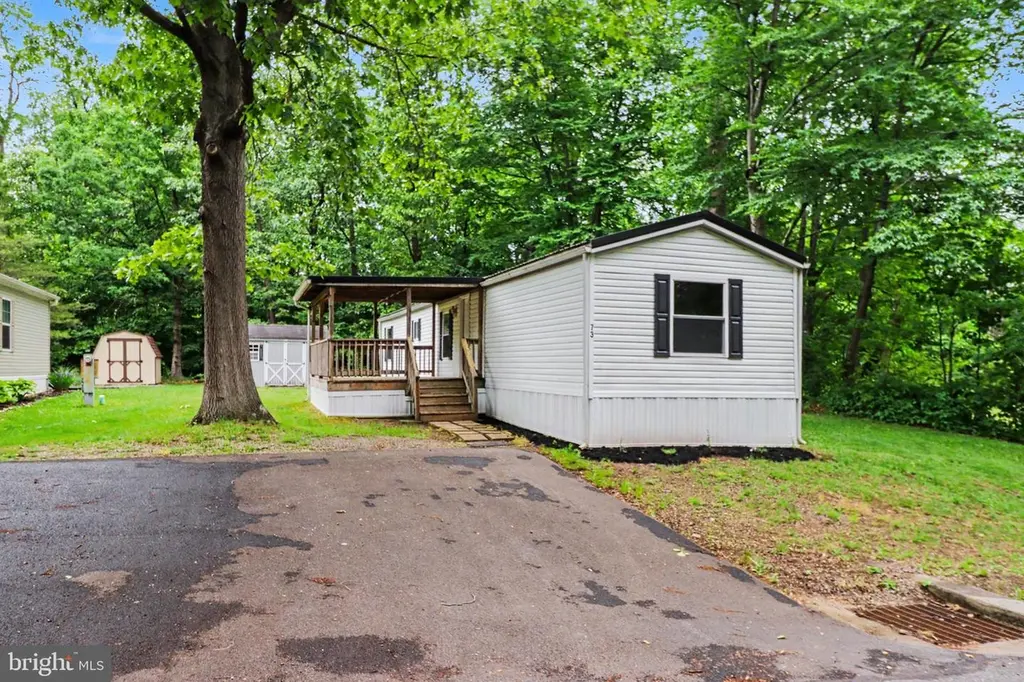
Check out this 3/1 mobile home in this well-cared-for community in Halifax. This property needs some TLC, but is ready to move in to by the beginning of February. At $350, the lot rent is very reasonable. Will add more pics as available.
Key facts
- Covered front porch
- Brand-new flooring
- Storage shed
Tags
Property features AI
Finance
- Other: Property manager present; Annual ground rent noted in income/expense list
- Financial info: Ground rent $450 per month; Ownership: ground rent (ground rent exists)
Exterior
- Parking: Asphalt driveway with space for three vehicles (three driveway spaces, three total parking spaces)
- Utilities: Community water; Private sewer
- Home design: Manufactured single-wide home; Manufactured structure; Estimated year built with effective year 2025; Above-grade finished living area
- Construction: Modular/Manufactured construction; Fleetwood make
- Exterior features: Not in a federal flood zone; Ground rent exists and is paid monthly
Interior
- Bedrooms: Three bedrooms on the main level
- Bathrooms: One full bathroom on the main level
- Heating & cooling: Central air conditioning; Forced air heating; Propane hot water (leased propane)
- Interior features: No basement; Multiple access exits
Neighborhood map
What this means for you Summary
Snapshot
- This is a 3-bed/1.0-bath manufactured listed at $65k.
Deal economics
- At list price, monthly cash flow is $258 ($3k/yr) — positive.
- The deal already cash-flows at list — no discount required.
- Meets the 1% rule at list price ($959 rent vs $65k).
- Recommended offer: $64k (1.5% below list) — sets the bar for market timing.
Location & tenants
- Location reads 69/100 on livability (#822 in PA) — a middle-class / working-renter tenant base. Strengths: crime A+, cost of living A+, housing A+; Watch: amenities F, commute F, health & safety F.
- Halifax Area SD (rural): math 28% / reading 55% proficiency, ranked #310 of 539 in PA (top 58%) — families likely to look elsewhere, expect single-tenant / working-renter base with shorter leases.
- Zoned schools: Halifax Area Ms (math 13% / reading 50%, grade F, #367 of 512 statewide, top 73%, 273 students, 31% FRL); Halifax Area Hs (math 54%, 244 students, 30% FRL) — zoned schools at 30% FRL track the district average.
- Market conditions: 47 active listings in the ZIP; 1 comparable units currently listed for rent nearby; 540 units permitted in Dauphin County in 2024 (194 in 5+ unit buildings).
Forward outlook
- Local home prices are declining (-3.0%/yr); year-one equity from $449 of loan paydown is wiped out by about $2k of value loss. Plan a longer hold.
- At projected returns (-3.0% appreciation + 3.0% rent growth), your $18k cash investment doubles in ~8 years — after that, you're playing with house money.
Negotiation context
- It's been on market 23 days — a 2% lower offer ($64k) is reasonable based on typical stale-listing flexibility.
- 6 sale attempts since 2y ago with the ask held roughly flat each time — persistent listings suggest the price (not the market) is what's stuck; bring a comps-based counter.
- Current owner paid $23k; list at $65k implies a 183% gain — meaningful room to come down on a strong offer.
Risks & watch-outs
- Watch-outs: flood insurance adds $56/mo.
- Climate carrying-cost: severe flood risk; extreme-heat days projected 7→16/yr by 2055 (HVAC capex compounding) — expect insurance premiums to compound above CPI over the hold.
Questions for the listing agent
- What's the actual annual flood-insurance premium (NFIP or private), and is the property in a SFHA with mandatory coverage?
- Is there a deadline driving the sale (1031 exchange, divorce, estate, relocation)? That informs how much negotiation room exists.
- Schools are B-rated — typically a magnet for longer-tenancy family renters. What's the average tenant stay here, and is there a school-zone premium baked into asking?
- What's the average days-on-market for RENTAL listings here right now (not sales)? A rising rental-DOM trend means longer vacancies and softer asking-rent achievability than the comps imply.
- What's the recent tenant-quality profile in this submarket — average credit score on applications, eviction rate, late-payment / NSF rate, and stable-employment percentage? A property-management company in the area should have these aggregated.
- How much new for-sale + rental construction is in the pipeline within 1–3 miles? Heavy new supply typically softens prices + rents 12–24 months out; constrained supply supports both.
Investment metrics
- 1% rule
- 1.48% ✓
- Cap rate
- 12.08%
- Cash-on-cash
- 20.67%
- DSCR
- 1.92
- GRM
- 5.6
CMA / ARV
No comps found within radius.
Projected returns pro-forma
-3.0% appreciation · 3.0% rent growth · sell at horizon
- IRR
- 8.3%
- Equity multiple
- 1.33×
- Total profit
- $5,942
- Equity at exit
- $9,692
- IRR
- 17.6%
- Equity multiple
- 2.46×
- Total profit
- $26,514
- Equity at exit
- $5,620
Cash invested: $18,200 (down + closing). Projections, not guarantees.
Landlord ↔ Tenant lean methodology
- Overall (STATE)
- 62 Landlord-Friendly
- State Pennsylvania
- 62 Landlord-Friendly · EVEN
- County
- — inherits STATE
- City
- — inherits STATE
ZIP-level market 17032
- Home prices YoY
- -8.3%
- Active inventory
- 47
- Price-to-rent
- 5.6×
Monthly cashflow live
- Estimated rent
- $959 medium interval (Pro) →
- Mortgage (P&I)
- −$341
- Tax from tax record
- −$76 /mo · $914/yr
- Insurance
- −$27
- Flood insurance flood zone
- −$56 /mo · $666/yr
- HOA
- −$0
- Vacancy / Maint / Mgmt
- −$201
- Net cashflow
- $258
Break-even live
UW: 25.0% down · 7.5% · 30yr · 1.5% tax · 5.0% vac · 8.0% maint · 8.0% mgmt
Financing live
Cash to close
- Down payment
- $16,250
- Closing costs
- $1,950
- Reserves months
- —
- Total cash needed
- —
Loan-product check · same deal, 3 products live
Conventional
25% down · 7.5% · 30yr
- Down + closing
- —
- Monthly P&I
- —
- Monthly cashflow
- —
- DSCR
- —
- Eligible?
- —
Personal DTI + credit; lowest rate.
DSCR
20% down · 8.5% · 30yr
- Down + closing
- —
- Monthly P&I
- —
- Monthly cashflow
- —
- DSCR
- —
- Eligible?
- —
No personal income docs; deal must DSCR.
Hard money
10% down · 12.0% · 12mo
- Down + closing
- —
- Monthly P&I
- —
- Monthly cashflow
- —
- DSCR
- —
- Eligible?
- —
Short-term bridge; refi at stabilization.
Rent comps 1 comps
| Address | Beds | Baths | Sqft | Rent | $/sqft | DOM | Units | Dist |
|---|---|---|---|---|---|---|---|---|
| 161 Hillside Hts Millersburg, PA | 2.0 | 1.0 | 1000 | $959 | $0.96 | 23d | 1 | 1.47mi |
Listing history 31 events
-
2026-06-18days on market $65,000 Active 23 DOM
-
2026-06-17days on market $65,000 Active 22 DOM
-
2026-06-16days on market $65,000 Active 21 DOM
-
2026-06-15days on market $65,000 Active 20 DOM
-
2026-06-13days on market $65,000 Active 18 DOM
-
2026-06-12days on market $65,000 Active 17 DOM
-
2026-06-09days on market $65,000 Active 14 DOM
-
2026-06-08days on market $65,000 Active 13 DOM
-
2026-06-08days on market $65,000 Active 12 DOM
-
2026-06-07days on market $65,000 Active 11 DOM
-
2026-06-04days on market $65,000 Active 8 DOM
-
2026-06-02days on market $65,000 Active 7 DOM
-
2026-06-01days on market $65,000 Active 6 DOM
-
2026-05-31days on market $65,000 Active 5 DOM
-
2026-05-26$65,000 Active
-
2026-01-15historical
-
2025-09-26$60,000 Active
-
2025-09-02historical
-
2025-03-25soldstatus $23,000 Closed 237-char remark
Show marketing remark (237 chars)
Check out this 3/1 mobile home in this well-cared-for community in Halifax. This property needs some TLC, but is ready to move in to by the beginning of February. At $350, the lot rent is very reasonable. Will add more pics as available.
-
2025-03-09price $44,900 237-char remark
Show marketing remark (237 chars)
Check out this 3/1 mobile home in this well-cared-for community in Halifax. This property needs some TLC, but is ready to move in to by the beginning of February. At $350, the lot rent is very reasonable. Will add more pics as available.
-
2025-01-23$54,900 Active 237-char remark
Show marketing remark (237 chars)
Check out this 3/1 mobile home in this well-cared-for community in Halifax. This property needs some TLC, but is ready to move in to by the beginning of February. At $350, the lot rent is very reasonable. Will add more pics as available.
-
2024-11-15historical
-
2024-11-13price $25,000
-
2024-11-11price $30,000
-
2024-11-07$35,000 Active
-
2024-10-07historical
-
2024-09-26price $30,000
-
2024-09-16status Active
-
2024-08-26status Pending
-
2024-07-31price $34,500
-
2024-07-12$39,500 Active
ⓘ Source: listings_history table (triggers on properties + properties_extension) + one-shot
backfill from property_details.listing_events for pre-trigger history.
Tax reassessment forecast PA · Partial reset (capped growth)
- Current annual tax
- $914 · $76/mo
- Projected year-2 tax
- $970 · $81/mo
- Expected delta
- +$57/yr (+$5/mo · 6.2%)
ⓘ Screening estimate from a state-policy table — verify with the county assessor before closing.
Climate risk First Street
- Flood 9/10 Extreme FEMA zone X (unshaded) · 99% chance over 30 yrs
- Wildfire 1/10 Low
- Heat 5/10 Major 7 d/yr ≥100°F today · 16 d/yr by 30 yrs out
- Wind 2/10 Low 3% chance of damaging wind over 30 yrs
- Air quality 1/10 Low 0 unhealthy d/yr today · 0 by 30 yrs out
Nearby sold comps map
Loading sold comps map…
Walkable amenities ~0.75 mi
Loading nearby amenities…
Taxation est. · year 1
- Rental income
- $11,508
- − Mortgage interest
- −$3,641
- − Property taxes
- −$914
- − Insurance
- −$992
- − Repairs & maintenance
- −$921
- − Management
- −$921
- − Depreciation
- −$1,891
- Taxable income
- $2,229
- Est. tax owed @ 24.0%
- −$535
- After-tax cash flow
- $2,560/yr
For passive investors: Depreciation is non-cash, so a rental often shows a tax loss while cash-flowing — sheltering income. Rental losses are passive: they offset passive income freely, and up to $25,000/yr can offset ordinary (W-2) income if you actively participate and your MAGI is under $100k (phasing out to $0 by $150k); unused losses carry forward. On sale, claimed depreciation is recaptured at up to 25%, and gains may owe capital-gains tax (a 1031 exchange can defer both). Figures are a year-1 estimate at your 24.0% rate — not tax advice; consult a CPA.
Schools (NCES district)
- District
- Halifax Area SD
- NCES district ID
- 4211310
- Math proficiency
- 28% ▼ -15.00%
- Reading proficiency
- 55% ▼ -12.00%
- Median HH income
- $56,462
- Composite
- 36.25/100
- National rank
- #4713
- State rank
- #310 of 539 in PA
Livability — Halifax
- Score
- 69/100
- State rank
- #822
- US rank
- #8539
Category grades
Schools grade is shown separately in the Schools card above.
Census & demographics
- Population (ZIP)
- 7,630
Population outlook (Dauphin County) Hauer SSP2
- Today (2025)
- 281,628 people
- By 2030
- 283,549 · +0.7%
- By 2040
- 285,385 · +1.3%
- By 2050
- 286,188 · +1.6%
- By 2075
- 291,053 · +3.3%
- By 2100
- 282,374 · +0.3%
Race, ethnicity, and origin ACS 2023
- Neighborhood character
- Predominantly White (93%)
- Race & ethnicity
- White 93% Two or more races 5% Hispanic / Latino 2%
- Common ancestry
- Romanian 3% Iranian 1% Lithuanian 1%
- Foreign-born
- 1% · Canada
- Languages at home
- 99% English-only · Spanish 1%
Political lean MEDSL · Dauphin
- 2024 margin
- Lean D (+5.9) · D 52.4% · R 46.5% · Other 1.1%
- 2008→2024 swing
- -3.1pp toward R · 2008: 9.1pp · 2024: 5.9pp
- All cycles
- 2024: D+5.9 2020: D+8.5 2016: D+2.8 2012: D+6.0 2008: D+9.1
Not yet ingested
- Civics
- —
Market trends
- HPI YoY
- ▼ -25.19%
- Current HPI
- 276.6399
- Rent YoY
- —
- Metro
- —
- State GDP YoY
- ▲ 1.68%
- F500 in state
- 34
Industry mix (Fortune 500 HQ in PA)
| Industry | F500 HQs | Revenue |
|---|---|---|
| Healthcare | 2 | $309B |
|
||
| Insurance | 2 | $27B |
|
||
| Telecommunications / Media | 1 | $124B |
|
||
| Industrial Distribution | 1 | $22B |
|
||
| Financial Services | 1 | $20B |
|
||
| Chemicals / Materials | 1 | $18B |
|
||
Price history
+64.6% since first listed17 events — show timeline
- 2026-05-26 Listed $65,000 BRIGHT MLS
- 2026-01-15 Listing Removed — BRIGHT MLS
- 2025-09-26 Listed $60,000 BRIGHT MLS
- 2025-09-02 Coming Soon — BRIGHT MLS
- 2025-03-25 Sold (MLS) $23,000 BRIGHT MLS
- 2025-03-09 Price Changed $44,900 BRIGHT MLS
- 2025-01-23 Listed $54,900 BRIGHT MLS
- 2024-11-15 Listing Removed — BRIGHT MLS
- 2024-11-13 Price Changed $25,000 BRIGHT MLS
- 2024-11-11 Price Changed $30,000 BRIGHT MLS
- 2024-11-07 Listed $35,000 BRIGHT MLS
- 2024-10-07 Listing Removed — BRIGHT MLS
- 2024-09-26 Price Changed $30,000 BRIGHT MLS
- 2024-09-16 Relisted — BRIGHT MLS
- 2024-08-26 Pending — BRIGHT MLS
- 2024-07-31 Price Changed $34,500 BRIGHT MLS
- 2024-07-12 Listed $39,500 BRIGHT MLS
Property tax history
+2.5%/yrLatest (2026): $914 · +4.2% YoY. Source: county tax records.
Cash-flow waterfall
monthlySold comps — $/sqft
last 12 mo · ≤1 miLoading sold comps…