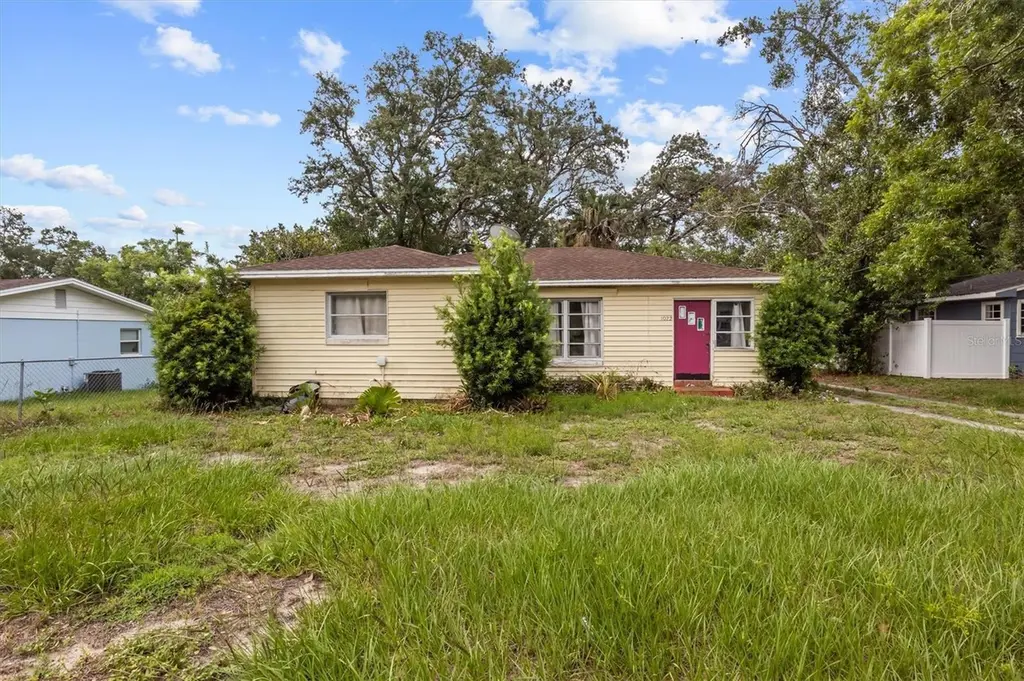
1022 W Marjorie St · Lakeland, FL
Flood risk 1/10 · Minimal
- FEMA flood zone
- X (unshaded)
- Chance of flooding over 30 yrs
- 0.0%
- Est. flood insurance / yr
- $507 – $1,088
Fire risk 1/10 · Minimal
- Est. fire insurance / yr
- $947 – $1,759
Heat risk 8/10 · Major
- Hot days now (above 108°F)
- 7 days/yr
- Hot days in 30 yrs
- 23 days/yr
Wind risk 10/10 · Severe
- Chance of severe wind over 30 yrs
- 99.0%
Air-quality risk 2/10 · Minimal
- Unhealthy air days now
- 1 days/yr
- Unhealthy air days in 30 yrs
- 2 days/yr
Risk factors via First Street. Map © Google.
Why this score? — see what drove the C- grade
The composite is a weighted blend of 9 inputs, each scored 0–100. Each bar is that input's sub-score; the figure is the points it added to the 100-point composite (weight × sub-score).
- Cash flow +12.3/30.0
- Appreciation +10.0/10.0
- ARV discount +7.5/15.0
- Rent growth +4.0/5.0
- Livability +3.9/5.0
- DSCR +3.7/10.0
- 1% rule +3.5/10.0
- Schools +3.5/10.0
- Condition / age +2.5/5.0
$185,000
🖨 Deal sheet 📄 Offer letter ✓ Due diligence
Listing remarks MLS
Historic Lakeland cottage with a * new roof! * Conveniently located near downtown with ample shopping and dining options. Lake Hunter is very close by with beautifully wooded trails. This is a spacious home with polished original hardwood floors throughout. The beautiful picture window in the living room allows natural light in. The living room is large and airy. Generously sized bedrooms are very comfortable. The kitchen has classic white cabinets and drawers that provide ample storage for gadgets and pantry items, and there are closets just past the kitchen for additional storage. There is plenty of parking available outside, with a long driveway to the detached garage. The front and back yards are both good size, with room to do just about anything you want.
Key facts
- Power and water
- Lake views
- Large open windows
Tags
Property features AI
Finance
- Other: Homestead exempt; Zoned RA-3
- HOA & community: No HOA (no association); Street lights in community; Pets allowed
Exterior
- Parking: Oversized driveway; 1-car garage (22x14)
- Utilities: Public water; Public sewer; Propane available; Public utilities
- Home design: Single family residence; One story; Faces north; Residential property
- Construction: Block and vinyl siding construction; Shingle roof; Crawlspace foundation; Built as single-family residence
- Exterior features: Rear porch; Storage; Chain link fencing; Workshop / other outbuilding; Mature landscaping with fruit trees; Near public transit; Brick street
Interior
- Kitchen: Refrigerator; Gas water heater
- Bedrooms: 2 bedrooms
- Flooring: Laminate; Tile; Wood
- Bathrooms: 1 full bathroom
- Heating & cooling: Central heating; Central air conditioning
- Interior features: Open floorplan with living room/dining room combo; Tinted windows; Inside utility / additional storage
- Laundry & utility: Laundry in garage; Interior laundry (inside)
Neighborhood map
What this means for you Summary
Snapshot
- This is a 3-bed/2.0-bath single-family listed at $185k.
Deal economics
- At list price, monthly cash flow is $-34 ($-403/yr) — negative.
- To cash-flow at today's rent, offer at most $179k (3.2% below list).
- To meet the 1% rule (rent ≥ 1% of price), the offer needs to be $158k (14.7% below list).
- Recommended offer: $158k (14.7% below list) — sets the bar for 1% rule.
Location & tenants
- Location reads 77/100 on livability (#206 in FL, #3,179 nationally) — a middle-class / working-renter tenant base. Strengths: cost of living A+, housing A+, health & safety A+; Watch: employment D+, amenities F, commute F.
- Polk (suburban): math 39% / reading 43% proficiency, ranked #62 of 73 in FL (top 85%) — families likely to look elsewhere, expect single-tenant / working-renter base with shorter leases.
- Zoned schools: Rosabelle W. Blake Academy (math 42% / reading 40%, grade F, #1,454 of 2,144 statewide, top 69%, 642 students, 63% FRL); Kathleen Senior High School (math 19% / reading 31%, grade F, #501 of 667 statewide, top 75%, 2,051 students, 59% FRL) — zoned schools at 61% FRL track the district average.
- Market conditions: Rents rising fast (+6.1%/yr); 72 active listings in the ZIP; 40 comparable units currently listed for rent nearby; rentals at typical pace (median 14d on market — plan ~3-4 weeks tenant-placement turnaround); lower-income renter base — watch delinquency; 10,384 units permitted in Polk County in 2024 (1,716 in 5+ unit buildings).
Forward outlook
- In year one you build about $20k of equity ($1k loan paydown + $18k appreciation (10.0% local appreciation)).
- Polk County population projected at +33% by 2050 — long-run rental-demand tailwind backs the buy-and-hold thesis.
- At projected returns (10.0% appreciation + 6.1% rent growth), your $52k cash investment doubles in ~3 years — after that, you're playing with house money.
- By year 2, paydown + projected appreciation supports a ~$32k cash-out refi (75% LTV) — recoverable capital for the next deal without selling this one.
Negotiation context
- It's been on market 16 days — a 2% lower offer ($182k) is reasonable based on typical stale-listing flexibility.
- 2 sale attempts since 7y ago with the ask held roughly flat each time — persistent listings suggest the price (not the market) is what's stuck; bring a comps-based counter.
- Current owner paid $130k; 42% above their basis — modest negotiation headroom, anchor on the comps not their cost.
Risks & watch-outs
- Watch-outs: built in 1953 — expect roof / HVAC / electrical / plumbing capex.
- Climate carrying-cost: severe wind risk, 99% chance of damaging wind over 30y; extreme-heat days projected 7→23/yr by 2055 (HVAC capex compounding) — expect insurance premiums to compound above CPI over the hold.
Questions for the listing agent
- What do current leases actually rent for vs. the listed asking? Can we see a recent rent roll and the last 12 months of T-12 income?
- Built in 1953 — when were the roof, HVAC, electrical panel, plumbing, and water heater last replaced?
- Is there a deadline driving the sale (1031 exchange, divorce, estate, relocation)? That informs how much negotiation room exists.
- What's the average days-on-market for RENTAL listings here right now (not sales)? A rising rental-DOM trend means longer vacancies and softer asking-rent achievability than the comps imply.
- What's the recent tenant-quality profile in this submarket — average credit score on applications, eviction rate, late-payment / NSF rate, and stable-employment percentage? A property-management company in the area should have these aggregated.
- How much new for-sale + rental construction is in the pipeline within 1–3 miles? Heavy new supply typically softens prices + rents 12–24 months out; constrained supply supports both.
Investment metrics
- 1% rule
- 0.85% ✗
- Cap rate
- 6.08%
- Cash-on-cash
- -0.78%
- DSCR
- 0.97
- GRM
- 9.8
CMA / ARV
No comps found within radius.
Projected returns pro-forma
10.0% appreciation · 6.14% rent growth · sell at horizon
- IRR
- 24.8%
- Equity multiple
- 3.00×
- Total profit
- $103,787
- Equity at exit
- $166,663
- IRR
- 22.7%
- Equity multiple
- 7.16×
- Total profit
- $319,217
- Equity at exit
- $359,414
Cash invested: $51,800 (down + closing). Projections, not guarantees.
Landlord ↔ Tenant lean methodology
- Overall (STATE)
- 87 Strongly Landlord-Friendly
- State Florida
- 87 Strongly Landlord-Friendly · R+3
- County
- — inherits STATE
- City
- — inherits STATE
ZIP-level market 33815
- Home prices YoY
- 12.6%
- Rents YoY
- 6.1%
- Active inventory
- 72
- Price-to-rent
- 9.8×
Monthly cashflow live
- Estimated rent
- $1,579 high interval (Pro) →
- Mortgage (P&I)
- −$970
- Tax from tax record
- −$234 /mo · $2,804/yr
- Insurance
- −$77
- HOA
- −$0
- Vacancy / Maint / Mgmt
- −$332
- Net cashflow
- $-34
Break-even live
UW: 25.0% down · 7.5% · 30yr · 1.5% tax · 5.0% vac · 8.0% maint · 8.0% mgmt
Financing live
Cash to close
- Down payment
- $46,250
- Closing costs
- $5,550
- Reserves months
- —
- Total cash needed
- —
Loan-product check · same deal, 3 products live
Conventional
25% down · 7.5% · 30yr
- Down + closing
- —
- Monthly P&I
- —
- Monthly cashflow
- —
- DSCR
- —
- Eligible?
- —
Personal DTI + credit; lowest rate.
DSCR
20% down · 8.5% · 30yr
- Down + closing
- —
- Monthly P&I
- —
- Monthly cashflow
- —
- DSCR
- —
- Eligible?
- —
No personal income docs; deal must DSCR.
Hard money
10% down · 12.0% · 12mo
- Down + closing
- —
- Monthly P&I
- —
- Monthly cashflow
- —
- DSCR
- —
- Eligible?
- —
Short-term bridge; refi at stabilization.
Rent comps 40 comps
| Address | Beds | Baths | Sqft | Rent | $/sqft | DOM | Units | Dist |
|---|---|---|---|---|---|---|---|---|
| 1040 Ruby St Lakeland, FL | 3.0 | 2.0 | 1110 | $1,595 | $1.44 | 10d | 1 | 0.16mi |
| 808 S Central Ave Lakeland, FL | 2.0 | 1.0 | 700 | $1,100 | $1.57 | 23d | 1 | 0.22mi |
| 1206 W Highland St Lakeland, FL | 2.0 | 1.0 | 972 | $1,495 | $1.54 | 23d | 1 | 0.30mi |
| 1246 Dorothy St Lakeland, FL | 3.0 | 2.0 | 1484 | $2,300 | $1.55 | 23d | 1 | 0.32mi |
| 1238 Herschell St Lakeland, FL | 2.0 | 1.0 | 1323 | $1,300 | $0.98 | 23d | 1 | 0.37mi |
| 1213 W Patterson St Lakeland, FL | 3.0 | 1.0 | 840 | $1,350 | $1.61 | 14d | 1 | 0.39mi |
| 518 Pinewood Ave Lakeland, FL | 2.0 | 1.0 | 891 | $1,175 | $1.32 | 23d | 1 | 0.41mi |
| 101 Lake Hunter Dr #8 Lakeland, FL | 2.0 | 1.0 | 905 | $1,400 | $1.55 | 23d | 1 | 0.41mi |
| 1139 Olive St Lakeland, FL | 2.0 | 2.0 | 984 | $1,725 | $1.75 | 3d | 1 | 0.42mi |
| 510 Dade Ave Lakeland, FL | 2.0 | 1.0 | 936 | $1,149 | $1.23 | 14d | 1 | 0.46mi |
| 512 Dade Ave Lakeland, FL | 2.0 | 1.0 | 936 | $1,149 | $1.23 | 23d | 1 | 0.47mi |
| 1301 W Walnut St Lakeland, FL | 3.0 | 1.0 | 756 | $1,300 | $1.72 | 14d | 1 | 0.47mi |
| 1149 Sycamore St Unit 1149 Lakeland, FL | 2.0 | 2.0 | 970 | $1,700 | $1.75 | 23d | 1 | 0.47mi |
| 915 Ariana St Lakeland, FL | 2.0 | 2.0 | 819 | $1,395 | $1.70 | 3d | 1 | 0.55mi |
| 1618 Wayman St Lakeland, FL | 3.0 | 1.0 | 994 | $1,750 | $1.76 | 23d | 1 | 0.65mi |
| 515 Oregon Ave Lakeland, FL | 3.0 | 2.0 | 1024 | $1,500 | $1.46 | 3d | 1 | 0.66mi |
| 524 Montana Ave Lakeland, FL | 2.0 | 1.0 | 817 | $1,300 | $1.59 | 23d | 1 | 0.66mi |
| 1005 S New York Ave Unit 2 Lakeland, FL | 2.0 | 1.0 | 800 | $1,350 | $1.69 | 14d | 1 | 0.68mi |
| 1005 S New York Ave Unit 6 Lakeland, FL | 2.0 | 1.0 | 900 | $1,275 | $1.42 | 14d | 1 | 0.68mi |
| 1545 King Ave Lakeland, FL | 2.0 | 2.0 | 1020 | $1,450 | $1.42 | 3d | 1 | 0.73mi |
| 607 Kansas Ave Lakeland, FL | 2.0 | 1.0 | 829 | $1,150 | $1.39 | 23d | 1 | 0.73mi |
| 302 W Park St Lakeland, FL | 3.0 | 2.0 | 1100 | $2,200 | $2.00 | 14d | 1 | 0.76mi |
| 305 W Hancock St Lakeland, FL | 2.0 | 1.0 | 821 | $1,195 | $1.46 | 23d | 1 | 0.81mi |
| 1061 S Tennessee Ave Lakeland, FL | 2.0 | 2.5 | 1100 | $2,100 | $1.91 | 14d | 1 | 0.94mi |
| 455 Arapahoe Ave Lakeland, FL | 2.0 | 1.0 | 750 | $1,199 | $1.60 | 19d | 1 | 0.94mi |
| 457 Arapahoe Ave Lakeland, FL | 2.0 | 1.0 | 750 | $1,095 | $1.46 | 2d | 1 | 0.94mi |
| 1116 S Tennessee Ave Lakeland, FL | 2.0 | 1.0 | 761 | $1,250 | $1.64 | 23d | 1 | 0.99mi |
| 1112 South Blvd Unit E Lakeland, FL | 2.0 | 1.0 | 729 | $1,250 | $1.71 | 23d | 1 | 1.06mi |
| 411 E Park St Unit A Lakeland, FL | 2.0 | 1.5 | 1063 | $1,500 | $1.41 | 23d | 1 | 1.08mi |
| 411 E Park St Unit B Lakeland, FL | 2.0 | 1.5 | 1063 | $1,500 | $1.41 | 3d | 1 | 1.08mi |
| 519 Charles St Unit 1 Lakeland, FL | 2.0 | 1.5 | 1000 | $1,795 | $1.79 | 23d | 1 | 1.09mi |
| 830 W Beacon Rd #13 Lakeland, FL | 2.0 | 1.0 | 750 | $1,295 | $1.73 | 11d | 1 | 1.09mi |
| 830 W Beacon Rd Lakeland, FL | 1.0–2.0 | 1.0 | 690 | $1,295 | $1.88 | 23d | 2 | 1.10mi |
| 1 Lake Hollingsworth Dr Lakeland, FL | 3.0 | 2.0 | 1492 | $2,095 | $1.40 | 2d | 2 | 1.15mi |
| 1514 Alice Ave Lakeland, FL | 3.0 | 2.0 | 924 | $1,250 | $1.35 | 14d | 1 | 1.23mi |
| 400 W Beacon Rd Lakeland, FL | 1.0–2.0 | 1.0–2.0 | 862 | $2,001 | $2.32 | 3d | 6 | 1.25mi |
| 728 Johnson Ave Unit 1234479P Lakeland, FL | 2.0 | 1.0 | 893 | $6,611 | $7.40 | 14d | 1 | 1.25mi |
| 270 E Bay St Lakeland, FL | 2.0 | 1.0–2.0 | 892 | $1,725 | $1.93 | 3d | 6 | 1.26mi |
| 809 Adams St Lakeland, FL | 3.0 | 1.0 | 1164 | $1,525 | $1.31 | 14d | 1 | 1.29mi |
| 2206 W Highland St Unit 2208 Lakeland, FL | 2.0 | 1.0 | 756 | $1,125 | $1.49 | 10d | 1 | 1.31mi |
Listing history 12 events
-
2026-06-18days on market $185,000 Active 16 DOM
-
2026-06-17days on market $185,000 Active 15 DOM
-
2026-06-16days on market $185,000 Active 14 DOM
-
2026-06-15days on market $185,000 Active 13 DOM
-
2026-06-13days on market $185,000 Active 11 DOM
-
2026-06-10days on market $185,000 Active 8 DOM
-
2026-06-09days on market $185,000 Active 7 DOM
-
2026-06-08days on market $185,000 Active 6 DOM
-
2026-06-07days on market $185,000 Active 5 DOM
-
2026-06-05days on market $185,000 Active 2 DOM
-
2026-06-03remarks 687-char remark
-
2026-06-03$185,000 Active 1 DOM
ⓘ Source: listings_history table (triggers on properties + properties_extension) + one-shot
backfill from property_details.listing_events for pre-trigger history.
Tax reassessment forecast FL · Resets to sale price
- Current annual tax
- $2,804 · $234/mo
- Projected year-2 tax
- $2,804 · $234/mo
- Expected delta
- $0/yr ($0/mo · 0.0%)
ⓘ Screening estimate from a state-policy table — verify with the county assessor before closing.
Climate risk First Street
- Flood 1/10 Low FEMA zone X (unshaded) · 0% chance over 30 yrs
- Wildfire 1/10 Low
- Heat 8/10 Severe 7 d/yr ≥108°F today · 23 d/yr by 30 yrs out
- Wind 10/10 Extreme 99% chance of damaging wind over 30 yrs
- Air quality 2/10 Low 1 unhealthy d/yr today · 2 by 30 yrs out
Nearby sold comps map
Loading sold comps map…
Walkable amenities ~0.75 mi
Loading nearby amenities…
Taxation est. · year 1
- Rental income
- $18,947
- − Mortgage interest
- −$10,363
- − Property taxes
- −$2,804
- − Insurance
- −$925
- − Repairs & maintenance
- −$1,516
- − Management
- −$1,516
- − Depreciation
- −$5,382
- Taxable loss
- −$3,559
- Est. tax savings @ 24.0%
- +$854
- After-tax cash flow
- $451/yr
For passive investors: Depreciation is non-cash, so a rental often shows a tax loss while cash-flowing — sheltering income. Rental losses are passive: they offset passive income freely, and up to $25,000/yr can offset ordinary (W-2) income if you actively participate and your MAGI is under $100k (phasing out to $0 by $150k); unused losses carry forward. On sale, claimed depreciation is recaptured at up to 25%, and gains may owe capital-gains tax (a 1031 exchange can defer both). Figures are a year-1 estimate at your 24.0% rate — not tax advice; consult a CPA.
Schools (NCES district)
- District
- Polk
- NCES district ID
- 1201590
- Math proficiency
- 39% ▼ -11.00%
- Reading proficiency
- 43% ▼ -4.00%
- Median HH income
- $43,979
- Composite
- 34.74/100
- National rank
- #5132
- State rank
- #62 of 73 in FL
Livability — Lakeland
- Score
- 77/100
- State rank
- #206
- US rank
- #3179
Category grades
Schools grade is shown separately in the Schools card above.
Census & demographics
- Census place
- Lakeland, FL
- County
- Polk County · 740,051 people
- City population
- 277,690
- Metro
- Lakeland-Winter Haven, FL
- Population (ZIP)
- 13,975
- Household income
- $37,487
- Rent vs Own
- Severe rent burden
- 700.0
Population outlook (Polk County) Hauer SSP2
- Today (2025)
- 752,975 people
- By 2030
- 804,621 · +6.9%
- By 2040
- 906,117 · +20.3%
- By 2050
- 1,000,476 · +32.9%
- By 2075
- 1,197,520 · +59.0%
- By 2100
- 1,271,518 · +68.9%
Race, ethnicity, and origin ACS 2023
- Neighborhood character
- Diverse neighborhood (Simpson 0.67)
- Race & ethnicity
- White 43% Black 27% Hispanic / Latino 26% Two or more races 10% Asian 1%
- Hispanic origin (detail)
- Mexican 12% Puerto Rican 10%
- Common ancestry
- Romanian 1% German 1% Lithuanian 1%
- Foreign-born
- 11% · Canada, Jamaica, China
- Languages at home
- 75% English-only · Spanish 23% German/W. Germanic 1%
Political lean MEDSL · Polk
- 2024 margin
- Strong R (+20.7) · D 39.2% · R 59.9%
- 2008→2024 swing
- -14.6pp toward R · 2008: -6.1pp · 2024: -20.7pp
- All cycles
- 2024: R+20.7 2020: R+14.4 2016: R+14.1 2012: R+6.8 2008: R+6.1
Not yet ingested
- Civics
- —
Market trends
- HPI YoY
- ▲ 47.45%
- Current HPI
- 424.0956
- Rent YoY
- ▲ 6.14%
- Metro
- Lakeland-Winter Haven, FL
- State GDP YoY
- ▲ 3.28%
- F500 in state
- 36
Industry mix (Fortune 500 HQ in FL)
| Industry | F500 HQs | Revenue |
|---|---|---|
| Industrial Technology | 2 | $29B |
|
||
| Insurance | 2 | $17B |
|
||
| Retail | 1 | $60B |
|
||
| Technology Distribution | 1 | $58B |
|
||
| Homebuilding | 1 | $35B |
|
||
| Technology Manufacturing | 1 | $35B |
|
||
Price history
+1323.1% since first listed7 events — show timeline
- 2026-06-02 Listed $185,000 Stellar MLS as Distributed by MLS Grid
- 2019-11-07 Sold (Public Records) $129,900 Public Records
- 2019-11-01 Sold (MLS) $129,900 Stellar MLS as Distributed by MLS Grid
- 2019-10-04 Pending — Stellar MLS as Distributed by MLS Grid
- 2019-09-27 Listed $129,900 Stellar MLS as Distributed by MLS Grid
- 1991-01-01 Sold (Public Records) $42,000 Public Records
- 1971-06-01 Sold (Public Records) $13,000 Public Records
Property tax history
+50.2%/yrLatest (2025): $2,804 · +5.4% YoY. Source: county tax records.
Cash-flow waterfall
monthlySold comps — $/sqft
last 12 mo · ≤1 miLoading sold comps…