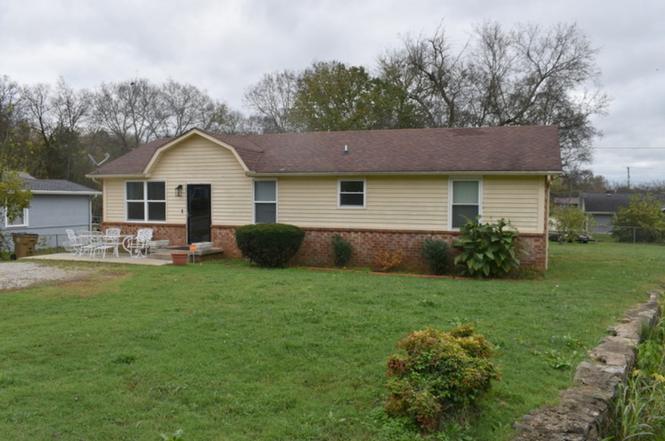
3785 Lunn Dr · Nashville-Davidson metropolitan government (balance), TN
Flood risk 5/10 · Moderate
- FEMA flood zone
- X (unshaded)
- Chance of flooding over 30 yrs
- 0.67%
- Est. flood insurance / yr
- $507 – $1,088
Fire risk 3/10 · Minor
- Est. fire insurance / yr
- $949 – $1,763
Heat risk 6/10 · Moderate
- Hot days now (above 106°F)
- 7 days/yr
- Hot days in 30 yrs
- 20 days/yr
Wind risk 4/10 · Minor
- Chance of severe wind over 30 yrs
- 9.0%
Air-quality risk 2/10 · Minimal
- Unhealthy air days now
- 1 days/yr
- Unhealthy air days in 30 yrs
- 2 days/yr
Risk factors via First Street. Map © Google.
Why this score? — see what drove the C+ grade
The composite is a weighted blend of 9 inputs, each scored 0–100. Each bar is that input's sub-score; the figure is the points it added to the 100-point composite (weight × sub-score).
- Cash flow +23.5/30.0
- ARV discount +15.0/15.0
- DSCR +7.6/10.0
- 1% rule +5.4/10.0
- Livability +2.5/5.0
- Condition / age +2.5/5.0
- Rent growth +2.3/5.0
- Schools +1.4/10.0
- Appreciation +0.0/10.0
$239,900
🖨 Deal sheet 📄 Offer letter ✓ Due diligence
Listing remarks
Perfect for someone looking to make their own. 4 bedrooms, 1 ½ baths, laundry room, hardwood floors, replacement windows, and HVAC and a concrete patio
Key facts
- 0.36 acre lot
- Built 1980
- Listed 129 days
Property features AI
Finance
- Other: Living area reported as 1,250 square feet; Property type listed as Residential; Year built listed as existing
- HOA & community: Pets allowed
Exterior
- Parking: No covered parking reported; No total parking spaces reported
- Utilities: Public water; Private sewer; Water available
- Home design: Single-family residence; One level
- Construction: Brick construction
- Exterior features: Lot approximately 0.36 acres; Lot dimensions 90 x 172
Interior
- Kitchen: Cooktop
- Bedrooms: 4 bedrooms (all on main level)
- Flooring: Carpet
- Bathrooms: 1 full bath; 1 half bath
- Heating & cooling: Central heating; Central air conditioning
- Interior features: Cooktop; Carpet flooring; Crawl space basement
Neighborhood map
What this means for you Summary
Snapshot
- This is a 4-bed/1.5-bath single-family listed at $240k.
Deal economics
- At list price, monthly cash flow is $449 ($5k/yr) — positive.
- The deal already cash-flows at list — no discount required.
- Meets the 1% rule at list price ($2k rent vs $240k).
- Recommended offer: $211k (12.0% below list) — sets the bar for market timing.
- Cap rate 8.5% vs local median 2.9% in Nashville-Davidson metropolitan government (balance) — top-decile yield for the area; either an underpriced asset or a hidden risk that comps aren't pricing in. Stress-test before assuming the spread holds.
Location & tenants
- Location reads: area grade C — affects rentability + tenant quality, not the cash-flow math above.
- Davidson County (urban): math 12% / reading 19% proficiency, ranked #126 of 139 in TN (top 91%) — low school quality limits family demand, transient renter base, plan for 1-2y turnover; 66% free/reduced lunch — lower-income household profile, screen leases tightly.
- Zoned schools: Cumberland Elementary (math 2% / reading 2%, grade F, #926 of 952 statewide, top 100%, 438 students, 0% FRL); Whites Creek High (math 2% / reading 12%, grade F, #294 of 332 statewide, top 91%, 587 students, 0% FRL) — zoned schools average 0% FRL vs 66% district-wide (66 pts lower); this property's tenant base skews higher-income than the district average.
- Market conditions: Rents soft (-0.7%/yr); 209 active listings in the ZIP; 3 comparable units currently listed for rent nearby; rentals at typical pace (median 15d on market — plan ~3-4 weeks tenant-placement turnaround); 6,873 units permitted in Davidson County in 2024 (4,138 in 5+ unit buildings).
- At $2,491/mo this rent would consume 48% of the median local household income ($62k/yr) (locally 532% of renters already pay >50% of income on rent) — very limited rent-growth headroom before tenants either downsize or default.
Forward outlook
- Local home prices are declining (-3.0%/yr); year-one equity from $2k of loan paydown is wiped out by about $7k of value loss. Plan a longer hold.
- Davidson County population projected at +42% by 2050 — long-run rental-demand tailwind backs the buy-and-hold thesis.
Negotiation context
- It's been on market 129 days — a 12% lower offer ($211k) is reasonable based on typical stale-listing flexibility.
- 4 sale attempts; this cycle's ask has dropped $50k (17%) from the opening price — seller is motivated, your offer sets the floor, not the list.
- Current owner paid $75k; list at $240k implies a 220% gain — meaningful room to come down on a strong offer.
Risks & watch-outs
- Climate carrying-cost: moderate flood risk; extreme-heat days projected 7→20/yr by 2055 (HVAC capex compounding) — expect insurance premiums to compound above CPI over the hold.
Questions for the listing agent
- It's been on market 129 days. Have you received any prior offers? Is the seller open to a 12% concession, seller financing, or rate buy-down credit?
- Why hasn't it sold? Are there any deal-killer items the seller is aware of (foundation, flood, title, zoning, code violations)?
- Is there a deadline driving the sale (1031 exchange, divorce, estate, relocation)? That informs how much negotiation room exists.
- What's the average days-on-market for RENTAL listings here right now (not sales)? A rising rental-DOM trend means longer vacancies and softer asking-rent achievability than the comps imply.
- What's the recent tenant-quality profile in this submarket — average credit score on applications, eviction rate, late-payment / NSF rate, and stable-employment percentage? A property-management company in the area should have these aggregated.
- How much new for-sale + rental construction is in the pipeline within 1–3 miles? Heavy new supply typically softens prices + rents 12–24 months out; constrained supply supports both.
Investment metrics
- 1% rule
- 1.04% ✓
- Cap rate
- 8.54%
- Cash-on-cash
- 8.03%
- DSCR
- 1.36
- GRM
- 8.0
CMA / ARV
- ARV (on-the-fly)
- $328,750
- Comps found
- 12
Show comp detail 12 sales within ~0.75 mi
| Address | Dist | Beds/Ba | Sqft | Sold | Price | $/sf | Match |
|---|---|---|---|---|---|---|---|
| 3785 Lunn Dr | 0.00mi | 4/1.5 | 1,250 (0%) | 1mo | $220,000 | $176 | 99 |
| 638 Putnam Dr | 0.40mi | 3/1.5 (-1) | 1,250 (0%) | 6mo | $327,500 | $262 | 71 |
| 3880 Lunn Dr | 0.40mi | 3/1.5 (-1) | 1,242 (-1%) | 8mo | $165,000 | $133 | 69 |
| 3883 Lunn Dr | 0.43mi | 3/1.5 (-1) | 1,242 (-1%) | 7mo | $270,000 | $217 | 68 |
| 3717 Fairview Dr | 0.54mi | 4/2.0 | 1,290 (+3%) | 4mo | $369,000 | $286 | 64 |
| 4016 Meadow Rd | 0.48mi | 3/2.0 (-1) | 1,300 (+4%) | 5mo | $342,500 | $263 | 60 |
| 552 Judd Dr | 0.33mi | 3/1.0 (-1) | 1,200 (-4%) | 14mo | $300,000 | $250 | 60 |
| 568 Phipps Dr | 0.29mi | 4/2.0 | 1,426 (+14%) | 8mo | $375,000 | $263 | 55 |
| 3329 Kings Ln | 0.56mi | 3/1.0 (-1) | 1,107 (-11%) | 1mo | $239,500 | $216 | 46 |
| 4220 Home Haven Dr | 0.68mi | 3/2.0 (-1) | 1,332 (+7%) | 10mo | $355,800 | $267 | 42 |
| 373 Kingview Dr | 0.66mi | 4/2.0 | 1,425 (+14%) | 4mo | $375,000 | $263 | 41 |
| 4009 Fairview Dr | 0.47mi | 3/2.0 (-1) | 1,100 (-12%) | 12mo | $364,900 | $332 | 41 |
Match score weights: distance 35% · size 25% · config 20% · recency 20%. Top-matched comps best support the ARV.
Projected returns pro-forma
-3.0% appreciation · 0.0% rent growth · sell at horizon
- IRR
- -7.3%
- Equity multiple
- 0.74×
- Total profit
- $-17,612
- Equity at exit
- $35,770
- IRR
- -1.7%
- Equity multiple
- 0.90×
- Total profit
- $-6,904
- Equity at exit
- $20,742
Cash invested: $67,172 (down + closing). Projections, not guarantees.
Landlord ↔ Tenant lean methodology
- Overall (STATE)
- 87 Strongly Landlord-Friendly
- State Tennessee
- 87 Strongly Landlord-Friendly · R+13
- County
- — inherits STATE
- City
- — inherits STATE
ZIP-level market 37218
- Home prices YoY
- -25.0%
- Rents YoY
- -0.7%
- Active inventory
- 209
- Price-to-rent
- 8.0×
Monthly cashflow live
- Estimated rent
- $2,491 medium interval (Pro) →
- Mortgage (P&I)
- −$1,258
- Tax from tax record
- −$161 /mo · $1,930/yr
- Insurance
- −$100
- HOA
- −$0
- Vacancy / Maint / Mgmt
- −$523
- Net cashflow
- $449
Break-even live
UW: 25.0% down · 7.5% · 30yr · 1.5% tax · 5.0% vac · 8.0% maint · 8.0% mgmt
Financing live
Cash to close
- Down payment
- $59,975
- Closing costs
- $7,197
- Reserves months
- —
- Total cash needed
- —
Loan-product check · same deal, 3 products live
Conventional
25% down · 7.5% · 30yr
- Down + closing
- —
- Monthly P&I
- —
- Monthly cashflow
- —
- DSCR
- —
- Eligible?
- —
Personal DTI + credit; lowest rate.
DSCR
20% down · 8.5% · 30yr
- Down + closing
- —
- Monthly P&I
- —
- Monthly cashflow
- —
- DSCR
- —
- Eligible?
- —
No personal income docs; deal must DSCR.
Hard money
10% down · 12.0% · 12mo
- Down + closing
- —
- Monthly P&I
- —
- Monthly cashflow
- —
- DSCR
- —
- Eligible?
- —
Short-term bridge; refi at stabilization.
Rent comps 3 comps
| Address | Beds | Baths | Sqft | Rent | $/sqft | DOM | Units | Dist |
|---|---|---|---|---|---|---|---|---|
| 4064 Cedar Cir Nashville, TN | 3.0 | 2.5 | 1500 | $2,400 | $1.60 | 14d | 1 | 0.40mi |
| 923 Millstream Dr Nashville, TN | 3.0 | 2.0 | 1502 | $2,300 | $1.53 | 11d | 1 | 0.62mi |
| 4010 Tucker Rd Nashville, TN | 3.0 | 1.0 | 1200 | $1,850 | $1.54 | 21d | 1 | 1.06mi |
Listing history 11 events
-
2026-05-20status Pending
-
2026-05-04status Active
-
2026-05-01historical
-
2026-04-16price $239,900
-
2026-03-30status Active
-
2026-03-21historical Active Under Contract
-
2026-03-20status Active
-
2026-03-20historical Active Under Contract
-
2026-01-09$290,000 Active
-
1980-06-01soldstatus $75,000
-
1980-06-01soldstatus $90,000
ⓘ Source: listings_history table (triggers on properties + properties_extension) + one-shot
backfill from property_details.listing_events for pre-trigger history.
Tax reassessment forecast TN · Resets to sale price
- Current annual tax
- $1,930 · $161/mo
- Projected year-2 tax
- $1,930 · $161/mo
- Expected delta
- $0/yr ($0/mo · -0.0%)
ⓘ Screening estimate from a state-policy table — verify with the county assessor before closing.
Climate risk First Street
- Flood 5/10 Major FEMA zone X (unshaded) · 67% chance over 30 yrs
- Wildfire 3/10 Moderate
- Heat 6/10 Major 7 d/yr ≥106°F today · 20 d/yr by 30 yrs out
- Wind 4/10 Moderate 9% chance of damaging wind over 30 yrs
- Air quality 2/10 Low 1 unhealthy d/yr today · 2 by 30 yrs out
Nearby sold comps map
Loading sold comps map…
Walkable amenities ~0.75 mi
Loading nearby amenities…
Taxation est. · year 1
- Rental income
- $29,895
- − Mortgage interest
- −$13,438
- − Property taxes
- −$1,930
- − Insurance
- −$1,200
- − Repairs & maintenance
- −$2,392
- − Management
- −$2,392
- − Depreciation
- −$6,979
- Taxable income
- $1,565
- Est. tax owed @ 24.0%
- −$376
- After-tax cash flow
- $5,015/yr
For passive investors: Depreciation is non-cash, so a rental often shows a tax loss while cash-flowing — sheltering income. Rental losses are passive: they offset passive income freely, and up to $25,000/yr can offset ordinary (W-2) income if you actively participate and your MAGI is under $100k (phasing out to $0 by $150k); unused losses carry forward. On sale, claimed depreciation is recaptured at up to 25%, and gains may owe capital-gains tax (a 1031 exchange can defer both). Figures are a year-1 estimate at your 24.0% rate — not tax advice; consult a CPA.
Schools (NCES district)
- District
- Davidson County
- NCES district ID
- 4703180
- Math proficiency
- 12% ▼ -17.00%
- Reading proficiency
- 19% ▼ -7.00%
- Median HH income
- $48,667
- Composite
- 14.03/100
- National rank
- #9472
- State rank
- #126 of 139 in TN
Livability — Nashville-Davidson metropolitan government (balance)
No livability data for this city. (Only ~50 U.S. cities are tracked.)
Census & demographics
- Census place
- Nashville-Davidson metropolitan government (balance), TN
- County
- Davidson County · 680,067 people
- City population
- 677,595
- Metro
- Nashville-Davidson--Murfreesboro--Franklin, TN
- Population (ZIP)
- 15,292
- Household income
- $61,919
- Rent vs Own
- Severe rent burden
- 532.0
Population outlook (Davidson County) Hauer SSP2
- Today (2025)
- 808,568 people
- By 2030
- 874,489 · +8.2%
- By 2040
- 1,009,046 · +24.8%
- By 2050
- 1,147,294 · +41.9%
- By 2075
- 1,475,439 · +82.5%
- By 2100
- 1,714,101 · +112.0%
Race, ethnicity, and origin ACS 2023
- Neighborhood character
- Predominantly Black (68%)
- Race & ethnicity
- Black 68% White 19% Two or more races 6% Hispanic / Latino 4% Asian 1%
- Common ancestry
- Italian 1%
- Foreign-born
- 3% · Canada, Vietnam
- Languages at home
- 96% English-only · Spanish 2% Vietnamese 1%
Political lean MEDSL · Davidson
- 2024 margin
- Strong D (+27.4) · D 62.7% · R 35.3% · Other 2.0%
- 2008→2024 swing
- +6.5pp toward D · 2008: 21.0pp · 2024: 27.4pp
- All cycles
- 2024: D+27.4 2020: D+32.1 2016: D+26.0 2012: D+18.7 2008: D+21.0
Not yet ingested
- Civics
- —
Market trends
- HPI YoY
- ▼ -105.30%
- Current HPI
- 315.1728
- Rent YoY
- ▼ -0.70%
- Metro
- Nashville-Davidson--Murfreesboro--Franklin, TN
- State GDP YoY
- ▲ 2.78%
- F500 in state
- 22
Industry mix (Fortune 500 HQ in TN)
| Industry | F500 HQs | Revenue |
|---|---|---|
| Healthcare | 3 | $91B |
|
||
| Retail | 3 | $72B |
|
||
| Transportation / Logistics | 1 | $88B |
|
||
| Paper / Packaging | 1 | $19B |
|
||
| Insurance | 1 | $13B |
|
||
| Energy | 1 | $12B |
|
||
Price history
+219.9% since first listed11 events — show timeline
- 2026-05-20 Pending — REALTRACS as Distributed by MLS Grid
- 2026-05-04 Relisted — REALTRACS as Distributed by MLS Grid
- 2026-05-01 Listing Removed — REALTRACS as Distributed by MLS Grid
- 2026-04-16 Price Changed $239,900 REALTRACS as Distributed by MLS Grid
- 2026-03-30 Relisted — REALTRACS as Distributed by MLS Grid
- 2026-03-21 Contingent — REALTRACS as Distributed by MLS Grid
- 2026-03-20 Relisted — REALTRACS as Distributed by MLS Grid
- 2026-03-20 Contingent — REALTRACS as Distributed by MLS Grid
- 2026-01-09 Listed $290,000 REALTRACS as Distributed by MLS Grid
- 1980-06-01 Sold (Public Records) $90,000 Public Records
- 1980-06-01 Sold (Public Records) $75,000 Public Records
Property tax history
+6.0%/yrLatest (2025): $1,930 · +20.8% YoY. Source: county tax records.
Cash-flow waterfall
monthlySold comps — $/sqft
last 12 mo · ≤1 miLoading sold comps…