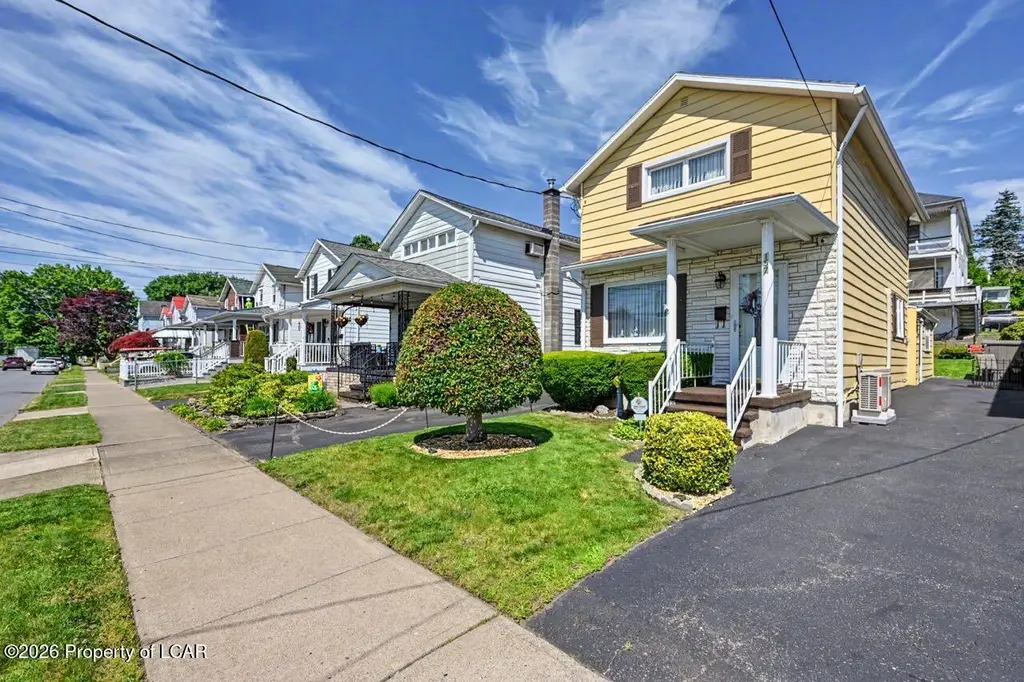
157 Empire St · Wilkes-Barre, PA
Flood risk 9/10 · Severe
- FEMA flood zone
- X (unshaded)
- Chance of flooding over 30 yrs
- 0.99%
- Est. flood insurance / yr
- $507 – $1,088
Fire risk 4/10 · Minor
- Est. fire insurance / yr
- $511 – $949
Heat risk 5/10 · Moderate
- Hot days now (above 90°F)
- 7 days/yr
- Hot days in 30 yrs
- 17 days/yr
Wind risk 3/10 · Minor
- Chance of severe wind over 30 yrs
- 5.0%
Air-quality risk 2/10 · Minimal
- Unhealthy air days now
- 1 days/yr
- Unhealthy air days in 30 yrs
- 2 days/yr
Risk factors via First Street. Map © Google.
Why this score? — see what drove the D+ grade
The composite is a weighted blend of 9 inputs, each scored 0–100. Each bar is that input's sub-score; the figure is the points it added to the 100-point composite (weight × sub-score).
- Cash flow +17.9/30.0
- ARV discount +7.6/15.0
- DSCR +5.6/10.0
- 1% rule +4.8/10.0
- Rent growth +4.2/5.0
- Livability +2.5/5.0
- Condition / age +2.5/5.0
- Schools +2.1/10.0
- Appreciation +0.0/10.0
$130,000
🖨 Deal sheet (PDF) 📄 Offer letter ✓ Due diligence
Listing remarks
This is it! Sweet, well cared for home with first floor laundry, ductless A/C, enclosed side porch, private driveway, and tidy landscaped yard. This is an estate and is being sold as is. Cash or conventional financing only. Furniture and contents can be included at no additional cost to the buyer. This cutie won't last long. Schedule your tour today!
Key facts
- Enclosed side porch
- Ductless a/c
- Private driveway
Tags
Property features AI
Exterior
- Security: Security system
- Utilities: Public water; Public sewer
- Home design: Single family residence; Two levels
- Construction: Aluminum siding
- Exterior features: Porch
Interior
- Kitchen: Eat-in kitchen
- Bedrooms: Total of 5 rooms (includes bedrooms and living spaces)
- Bathrooms: 1 full bathroom; 1 half bathroom
- Heating & cooling: Electric heating; Baseboard heating; Ceiling fan(s) for cooling
- Interior features: Eat-in kitchen; Basement
Neighborhood map
What this means for you Summary
Snapshot
- This is a 2-bed/1.5-bath single-family listed at $130k.
Deal economics
- At list price, monthly cash flow is $42 ($507/yr) — positive.
- The deal already cash-flows at list — no discount required.
- To meet the 1% rule (rent ≥ 1% of price), the offer needs to be $127k (1.9% below list).
- Recommended offer: $127k (1.9% below list) — sets the bar for 1% rule.
- Cap rate 7.3% vs local median 5.9% in Wilkes-Barre — meaningfully above typical; check what's discounted (condition, days-on-market, listing class) to confirm the premium yield is real.
Location & tenants
- Location reads: area grade D — affects rentability + tenant quality, not the cash-flow math above.
- Wilkes-Barre Area SD (urban): math 19% / reading 32% proficiency, ranked #469 of 539 in PA (top 87%) — low school quality limits family demand, transient renter base, plan for 1-2y turnover; 61% free/reduced lunch — lower-income household profile, screen leases tightly.
- Zoned schools: Heights/Murray El Sch (math 8% / reading 25%, grade F, #1,312 of 1,518 statewide, top 87%, 837 students, 100% FRL); G A R Ms (math 17% / reading 22%, grade F, #444 of 512 statewide, top 87%, 1,026 students, 100% FRL) — zoned schools average 100% FRL vs 61% district-wide (39 pts higher); higher-poverty schools than district average — tighter screening recommended.
- Market conditions: Rents rising fast (+6.8%/yr); 225 active listings in the ZIP; 39 comparable units currently listed for rent nearby; rentals at typical pace (median 23d on market — plan ~3-4 weeks tenant-placement turnaround); 41% of comp listings sitting > 30 days — soft ceiling on asking rent; 349 units permitted in Luzerne County in 2024 (16 in 5+ unit buildings).
Forward outlook
- Local home prices are declining (-3.0%/yr); year-one equity from $899 of loan paydown is wiped out by about $4k of value loss. Plan a longer hold.
- Luzerne County population projected at +4% by 2050 — modest demand growth; plan on rents tracking national, not racing it.
Negotiation context
- Only 5 days on market — expect competitive offers; lowballing is unlikely to land.
Risks & watch-outs
- Watch-outs: flood insurance adds $66/mo; built in 1925 — expect roof / HVAC / electrical / plumbing capex.
- Climate carrying-cost: severe flood risk; extreme-heat days projected 7→17/yr by 2055 (HVAC capex compounding) — expect insurance premiums to compound above CPI over the hold.
Questions for the listing agent
- Built in 1925 — when were the roof, HVAC, electrical panel, plumbing, and water heater last replaced?
- What's the actual annual flood-insurance premium (NFIP or private), and is the property in a SFHA with mandatory coverage?
- Is there a deadline driving the sale (1031 exchange, divorce, estate, relocation)? That informs how much negotiation room exists.
- The area grade is low — what's the realistic commute time and amenity access for the typical tenant pool here? Any planned neighborhood developments (good or bad) we should know about?
- What's the average days-on-market for RENTAL listings here right now (not sales)? A rising rental-DOM trend means longer vacancies and softer asking-rent achievability than the comps imply.
- What's the recent tenant-quality profile in this submarket — average credit score on applications, eviction rate, late-payment / NSF rate, and stable-employment percentage? A property-management company in the area should have these aggregated.
- How much new for-sale + rental construction is in the pipeline within 1–3 miles? Heavy new supply typically softens prices + rents 12–24 months out; constrained supply supports both.
Investment metrics
- 1% rule
- 0.98% ✗
- Cap rate
- 7.30%
- Cash-on-cash
- 3.58%
- DSCR
- 1.16
- GRM
- 8.5
CMA / ARV
- ARV (on-the-fly)
- $130,416
- Comps found
- 12
Show comp detail 12 sales within ~0.75 mi
| Address | Dist | Beds/Ba | Sqft | Sold | Price | $/sf | Match |
|---|---|---|---|---|---|---|---|
| 299 Lehigh St | 0.33mi | 3/1.0 (+1) | 1,150 (+0%) | 3mo | $120,000 | $104 | 74 |
| 119 Meade St | 0.17mi | 3/1.0 (+1) | 1,211 (+6%) | 6mo | $170,000 | $140 | 71 |
| 255 Lehigh St | 0.39mi | 3/1.5 (+1) | 1,100 (-4%) | 0mo | $170,000 | $155 | 70 |
| 9 Joseph Ln | 0.07mi | 3/1.5 (+1) | 1,000 (-13%) | 3mo | $135,000 | $135 | 68 |
| 403 Northampton St | 0.15mi | 3/1.5 (+1) | 1,280 (+12%) | 6mo | $128,000 | $100 | 63 |
| 22 Hayes Ln | 0.51mi | 3/1.5 (+1) | 1,100 (-4%) | 5mo | $87,000 | $79 | 61 |
| 65 Hutson St | 0.68mi | 2/2.0 | 1,100 (-4%) | 6mo | $125,000 | $114 | 55 |
| 3 Spencer St | 0.65mi | 3/1.5 (+1) | 1,200 (+5%) | 6mo | $160,000 | $133 | 51 |
| 220 Noble Ln | 0.62mi | 2/1.0 | 1,052 (-8%) | 10mo | $90,000 | $86 | 48 |
| 69 Hutson St | 0.68mi | 2/1.0 | 1,044 (-9%) | 8mo | $125,000 | $120 | 45 |
| 113 Meade St | 0.50mi | 3/1.0 (+1) | 1,304 (+14%) | 4mo | $87,500 | $67 | 43 |
| 16 Hutson St | 0.62mi | 3/1.0 (+1) | 1,304 (+14%) | 7mo | $145,000 | $111 | 35 |
Match score weights: distance 35% · size 25% · config 20% · recency 20%. Top-matched comps best support the ARV.
Projected returns pro-forma
-3.0% appreciation · 6.84% rent growth · sell at horizon
- IRR
- -9.5%
- Equity multiple
- 0.64×
- Total profit
- $-13,201
- Equity at exit
- $19,383
- IRR
- 4.7%
- Equity multiple
- 1.41×
- Total profit
- $14,932
- Equity at exit
- $11,240
Cash invested: $36,400 (down + closing). Projections, not guarantees.
Landlord ↔ Tenant lean methodology
- Overall (STATE)
- 62 Landlord-Friendly
- State Pennsylvania
- 62 Landlord-Friendly · EVEN
- County
- — inherits STATE
- City
- — inherits STATE
ZIP-level market 18702
- Rents YoY
- 6.8%
- Active inventory
- 225
- Price-to-rent
- 8.5×
Monthly cashflow live
- Estimated rent
- $1,275 high interval (Pro) →
- Mortgage (P&I)
- −$682
- Tax est. 1.5%
- −$162 /mo · $1,950/yr
- Insurance
- −$54
- Flood insurance flood zone
- −$66 /mo · $798/yr
- HOA
- −$0
- Vacancy / Maint / Mgmt
- −$268
- Net cashflow
- $42
Break-even live
Sensitivity live
| Price | -10% $132 | -5% $87 | +0% $42 | +5% $-3 | +10% $-48 |
|---|---|---|---|---|---|
| Rent | -10% $-58 | -5% $-8 | +0% $42 | +5% $93 | +10% $143 |
| Rate | -1.0pp $108 | -0.5pp $75 | base $42 | +0.5pp $9 | +1.0pp $-26 |
UW: 25.0% down · 7.5% · 30yr · 1.5% tax · 5.0% vac · 8.0% maint · 8.0% mgmt
Financing live
Cash to close
- Down payment
- $32,500
- Closing costs
- $3,900
- Reserves months
- —
- Total cash needed
- —
Loan-product check · same deal, 3 products live
Conventional
25% down · 7.5% · 30yr
- Down + closing
- —
- Monthly P&I
- —
- Monthly cashflow
- —
- DSCR
- —
- Eligible?
- —
Personal DTI + credit; lowest rate.
DSCR
20% down · 8.5% · 30yr
- Down + closing
- —
- Monthly P&I
- —
- Monthly cashflow
- —
- DSCR
- —
- Eligible?
- —
No personal income docs; deal must DSCR.
Hard money
10% down · 12.0% · 12mo
- Down + closing
- —
- Monthly P&I
- —
- Monthly cashflow
- —
- DSCR
- —
- Eligible?
- —
Short-term bridge; refi at stabilization.
Rent comps 39 comps
| Address | Beds | Baths | Sqft | Rent | $/sqft | DOM | Units | Dist |
|---|---|---|---|---|---|---|---|---|
| 83 S Empire St Unit 1 Wilkes-Barre, PA | 1.0 | 1.0 | 900 | $850 | $0.94 | 23d | 1 | 0.16mi |
| 92 S Diamond St Wilkes-Barre, PA | 3.0 | 1.0 | 1150 | $1,400 | $1.22 | 45d | 1 | 0.29mi |
| 2 S Empire St Unit 2R Wilkes-Barre, PA | 2.0 | 1.0 | 850 | $1,250 | $1.47 | 23d | 1 | 0.32mi |
| 36 Logan St Wilkes-Barre, PA | 3.0 | 1.0 | 1200 | $1,125 | $0.94 | 45d | 1 | 0.38mi |
| 62 Hutson St Wilkes Barre, PA | 2.0 | 1.0 | 1100 | $1,150 | $1.05 | 45d | 1 | 0.64mi |
| 62 Hutson St Unit 1 Wilkes-Barre, PA | 2.0 | 1.0 | 730 | $1,250 | $1.71 | 15d | 1 | 0.64mi |
| 32 Murray St Unit 34 Wilkes-Barre, PA | 3.0 | 1.0 | 930 | $1,100 | $1.18 | 23d | 1 | 0.78mi |
| 67-69 Public Sq #1203 Wilkes Barre, PA | 2.0 | 1.0 | 875 | $1,825 | $2.09 | 45d | 1 | 0.89mi |
| 273 New Hancock St Unit 2 Wilkes-Barre, PA | 2.0 | 1.0 | 725 | $1,300 | $1.79 | 23d | 1 | 0.89mi |
| 67-69 Public Sq Wilkes-Barre, PA | 2.0 | 1.0 | 910 | $1,875 | $2.06 | 45d | 1 | 0.90mi |
| 2 N Diamond St Wilkes-Barre, PA | 3.0 | 1.0 | 1000 | $1,500 | $1.50 | 23d | 1 | 0.93mi |
| 131 Scott St Wilkes-Barre Township, PA | 2.0 | 1.0 | 1144 | $1,300 | $1.14 | 45d | 1 | 0.96mi |
| 150 S Franklin St Wilkes Barre, PA | 2.0 | 1.0 | 850 | $1,750 | $2.06 | 45d | 1 | 0.98mi |
| 30 Chapel St Wilkes Barre, PA | 1.0 | 1.0 | 700 | $1,150 | $1.64 | 23d | 1 | 1.03mi |
| 407 McLean St Wilkes Barre, PA | 3.0 | 1.0 | 1482 | $1,400 | $0.94 | 15d | 1 | 1.06mi |
| 38 W Market St Unit 3 Wilkes-Barre, PA | 2.0 | 1.0 | 1388 | $1,295 | $0.93 | 15d | 1 | 1.06mi |
| 268 N Pennsylvania Ave Unit 2 Wilkes-Barre, PA | 3.0 | 1.0 | 758 | $1,300 | $1.72 | 23d | 1 | 1.07mi |
| 261 N Washington St Wilkes Barre, PA | 3.0 | 1.0 | 1050 | $1,400 | $1.33 | 45d | 1 | 1.11mi |
| 403 S Franklin St Wilkes Barre, PA | 2.0 | 1.0 | 900 | $1,050 | $1.17 | 23d | 1 | 1.11mi |
| 98 N Franklin St Unit 2 Wilkes-Barre, PA | 2.0 | 2.0 | 1254 | $1,650 | $1.32 | 15d | 1 | 1.11mi |
| 19 N River St Unit 403 Wilkes-Barre, PA | 2.0 | 1.0 | 723 | $1,600 | $2.21 | 15d | 1 | 1.12mi |
| 19 N River St Unit 308 Wilkes-Barre, PA | 2.0 | 1.5 | 910 | $1,600 | $1.76 | 15d | 1 | 1.12mi |
| 44 Eagle Ct Wilkes Barre, PA | 1.0–3.0 | 1.0–1.5 | 910 | $1,722 | $1.89 | 15d | 5 | 1.12mi |
| 132 Sambourne St Wilkes Barre, PA | 2.0 | 1.0 | 1000 | $1,250 | $1.25 | 23d | 1 | 1.15mi |
| 366 S River St Apt 3 Wilkes-Barre, PA | 1.0 | 1.0 | 1000 | $975 | $0.97 | 23d | 1 | 1.16mi |
| 168-170 Kidder St Wilkes-Barre, PA | 2.0 | 1.0 | 750 | $1,250 | $1.67 | 23d | 1 | 1.23mi |
| 168 Kidder St City of Wilkes Barre, PA | 2.0 | 1.0 | 750 | $1,250 | $1.67 | 23d | 1 | 1.24mi |
| 131 Academy St Wilkes Barre, PA | 3.0 | 1.0 | 1300 | $1,500 | $1.15 | 45d | 1 | 1.24mi |
| 155 W River St Wilkes Barre, PA | 3.0 | 2.0 | 1100 | $1,425 | $1.30 | 45d | 1 | 1.25mi |
| 233 Gilligan St Wilkes Barre, PA | 3.0 | 1.0 | 1440 | $1,600 | $1.11 | 23d | 1 | 1.26mi |
| 301 N Main St Unit 2 Wilkes-Barre, PA | 3.0 | 1.0 | 1050 | $1,300 | $1.24 | 23d | 1 | 1.27mi |
| 239 Poplar St Wilkes Barre, PA | 3.0 | 1.5 | 1100 | $1,350 | $1.23 | 45d | 1 | 1.27mi |
| 100 E Newport St Hanover Township, PA | 2.0 | 1.5 | 1344 | $1,250 | $0.93 | 45d | 1 | 1.31mi |
| 402 Scott St Fl 3 Wilkes-Barre, PA | 2.0 | 1.0 | 761 | $950 | $1.25 | 45d | 1 | 1.35mi |
| 75 Wood St Wilkes Barre, PA | 2.0 | 1.0 | 990 | $1,300 | $1.31 | 45d | 1 | 1.37mi |
| 26 Stanley St Wilkes Barre, PA | 2.0 | 1.0 | 950 | $1,650 | $1.74 | 45d | 1 | 1.38mi |
| 423 Scott St Apt 1 Wilkes-Barre, PA | 3.0 | 1.0 | 1100 | $1,450 | $1.32 | 45d | 1 | 1.38mi |
| 26 Bradford St Wilkes Barre, PA | 3.0 | 1.5 | 1056 | $1,400 | $1.33 | 15d | 1 | 1.39mi |
| 780 Hazle St Unit Rear 2nd Fl Ashley, PA | 2.0 | 1.0 | 850 | $975 | $1.15 | 15d | 1 | 1.43mi |
Listing history 5 events
-
2026-06-15status $130,000 Pending 5 DOM
-
2026-06-15days on market $130,000 Active 5 DOM
-
2026-06-14days on market $130,000 Active 3 DOM
-
2026-06-13remarks 352-char remark
-
2026-06-13$130,000 Active 2 DOM
ⓘ Source: listings_history table (triggers on properties + properties_extension) + one-shot
backfill from property_details.listing_events for pre-trigger history.
Climate risk First Street
- Flood 9/10 Extreme FEMA zone X (unshaded) · 99% chance over 30 yrs
- Wildfire 4/10 Moderate
- Heat 5/10 Major 7 d/yr ≥90°F today · 17 d/yr by 30 yrs out
- Wind 3/10 Moderate 5% chance of damaging wind over 30 yrs
- Air quality 2/10 Low 1 unhealthy d/yr today · 2 by 30 yrs out
Nearby sold comps map
Loading sold comps map…
Walkable amenities ~0.75 mi
Loading nearby amenities…
Taxation est. · year 1
- Rental income
- $15,297
- − Mortgage interest
- −$7,282
- − Property taxes
- −$1,950
- − Insurance
- −$1,448
- − Repairs & maintenance
- −$1,224
- − Management
- −$1,224
- − Depreciation
- −$3,782
- Taxable loss
- −$1,611
- Est. tax savings @ 24.0%
- +$387
- After-tax cash flow
- $893/yr
For passive investors: Depreciation is non-cash, so a rental often shows a tax loss while cash-flowing — sheltering income. Rental losses are passive: they offset passive income freely, and up to $25,000/yr can offset ordinary (W-2) income if you actively participate and your MAGI is under $100k (phasing out to $0 by $150k); unused losses carry forward. On sale, claimed depreciation is recaptured at up to 25%, and gains may owe capital-gains tax (a 1031 exchange can defer both). Figures are a year-1 estimate at your 24.0% rate — not tax advice; consult a CPA.
Schools (NCES district)
- District
- Wilkes-Barre Area SD
- NCES district ID
- 4226300
- Math proficiency
- 19% ▼ -2.00%
- Reading proficiency
- 32% ▼ -9.00%
- Median HH income
- $37,420
- Composite
- 21.22/100
- National rank
- #8409
- State rank
- #469 of 539 in PA
Livability — Wilkes-Barre
No livability data for this city. (Only ~50 U.S. cities are tracked.)
Census & demographics
- Census place
- Wilkes-Barre, PA
- County
- Luzerne County · 118,885 people
- City population
- 73,981
- Metro
- Scranton--Wilkes-Barre, PA
- Population (ZIP)
- 41,970
- Household income
- $56,378
- Rent vs Own
- Severe rent burden
- 1632.0
Population outlook (Luzerne County) Hauer SSP2
- Today (2025)
- 319,505 people
- By 2030
- 319,943 · +0.1%
- By 2040
- 322,643 · +1.0%
- By 2050
- 330,817 · +3.5%
- By 2075
- 379,145 · +18.7%
- By 2100
- 431,908 · +35.2%
Race, ethnicity, and origin ACS 2023
- Neighborhood character
- Diverse neighborhood (Simpson 0.59)
- Race & ethnicity
- White 58% Hispanic / Latino 25% Black 12% Two or more races 11% Asian 2%
- Hispanic origin (detail)
- Mexican 6% Puerto Rican 6% Dominican 9%
- Common ancestry
- Romanian 14% Scotch-Irish 2% Iranian 1%
- Foreign-born
- 13% · Canada, Jamaica
- Languages at home
- 79% English-only · Spanish 17% Other Asian/Pacific 1% Other Indo-European 1%
Political lean MEDSL · Luzerne
- 2024 margin
- R (+19.2) · D 40.0% · R 59.2%
- 2008→2024 swing
- -27.6pp toward R · 2008: 8.4pp · 2024: -19.2pp
- All cycles
- 2024: R+19.2 2020: R+14.4 2016: R+19.6 2012: D+4.8 2008: D+8.4
Not yet ingested
- Civics
- —
Market trends
- HPI YoY
- ▼ -156.99%
- Current HPI
- 216.9373
- Rent YoY
- ▲ 6.84%
- Metro
- Scranton--Wilkes-Barre, PA
- State GDP YoY
- ▲ 1.68%
- F500 in state
- 34
Industry mix (Fortune 500 HQ in PA)
| Industry | F500 HQs | Revenue |
|---|---|---|
| Healthcare | 2 | $309B |
|
||
| Insurance | 2 | $27B |
|
||
| Telecommunications / Media | 1 | $124B |
|
||
| Industrial Distribution | 1 | $22B |
|
||
| Financial Services | 1 | $20B |
|
||
| Chemicals / Materials | 1 | $18B |
|
||
Price history
1 event — show timeline
- 2026-06-10 Listed $130,000 LCAR
Property tax history
+20.4%/yrLatest (2026): $8,743 · +0.1% YoY. Source: county tax records.
Cash-flow waterfall
monthlySold comps — $/sqft
last 12 mo · ≤1 miLoading sold comps…