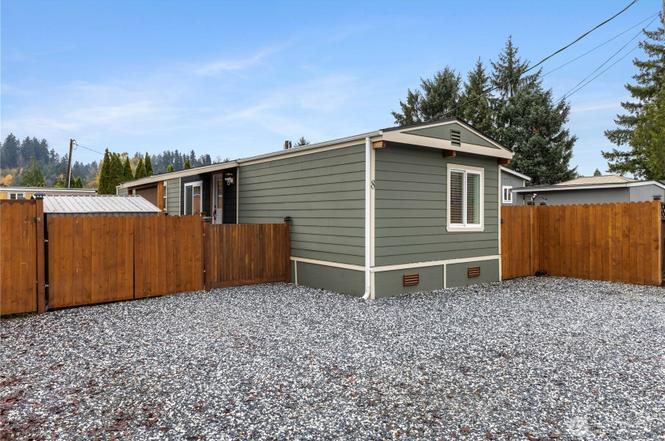
322 Chicago Blvd S #8 · Pacific, WA
Flood risk 5/10 · Moderate
- FEMA flood zone
- X (unshaded)
- Chance of flooding over 30 yrs
- 0.26%
- Est. flood insurance / yr
- $507 – $1,088
Fire risk 1/10 · Minimal
- Est. fire insurance / yr
- $604 – $1,122
Heat risk 3/10 · Minor
- Hot days now (above 88°F)
- 7 days/yr
- Hot days in 30 yrs
- 15 days/yr
Wind risk 1/10 · Minimal
- Chance of severe wind over 30 yrs
- —
Air-quality risk 7/10 · Major
- Unhealthy air days now
- 10 days/yr
- Unhealthy air days in 30 yrs
- 11 days/yr
Risk factors via First Street. Map © Google.
Why this score? — see what drove the B grade
The composite is a weighted blend of 9 inputs, each scored 0–100. Each bar is that input's sub-score; the figure is the points it added to the 100-point composite (weight × sub-score).
- Cash flow +30.0/30.0
- DSCR +10.0/10.0
- 1% rule +9.2/10.0
- ARV discount +7.5/15.0
- Schools +4.7/10.0
- Livability +4.0/5.0
- Rent growth +2.5/5.0
- Condition / age +2.5/5.0
- Appreciation +0.0/10.0
$129,000
🖨 Deal sheet 📄 Offer letter ✓ Due diligence
Listing remarks
Beautifully remodeled 1984 manufactured home featuring 3 bedrooms and 1 full bath. This 980 sq ft home offers a brand-new roof, fresh updates throughout, and an open, inviting layout. Located in Central Valley Mobile Home Park, an all-ages community in Pacific, WA, with easy access to main roads, shopping, and local amenities. Affordable and move-in ready!
Key facts
- Brand new roof
- Local amenities
- Open inviting layout
Tags
Property features AI
Finance
- Other: Buyer to verify school information
- Financial info: Listing terms: Cash or Conventional
- HOA & community: Located in Central Valley Mobile Home Park (park approved for sale); Approximately 17 homes in the park; Land lease: $1,100
Exterior
- Parking: 2 open/uncovered parking spaces
- Utilities: Electric energy source; Public water; Public sewer; Power provided by PSE
- Home design: Manufactured single-wide home; One story; Residential property in good condition; Manufactured after 6/15/1976
- Construction: Wood construction; Composition roof; Tie-down foundation
- Exterior features: Wood exterior products; Recreational area (manufactured home park amenity)
Interior
- Kitchen: Dishwasher; Stove/Range; Refrigerator
- Bedrooms: 3 bedrooms
- Flooring: Vinyl plank flooring
- Bathrooms: 1 full bathroom
- Heating & cooling: Forced air heating; No central cooling
- Interior features: Dishwasher; Dryer; Refrigerator; Stove/Range; Washer
- Laundry & utility: Washer and Dryer included
Neighborhood map
What this means for you Summary
Snapshot
- This is a 3-bed/1.0-bath manufactured listed at $129k.
Deal economics
- At list price, monthly cash flow is $554 ($7k/yr) — positive.
- The deal already cash-flows at list — no discount required.
- Meets the 1% rule at list price ($2k rent vs $129k).
- Recommended offer: $114k (12.0% below list) — sets the bar for market timing.
Location & tenants
- Location reads 80/100 on livability (#99 in WA, #1,917 nationally) — a professional / high-income tenant draw. Strengths: housing A+, health & safety A+, employment A-; Watch: schools C-, amenities F, cost of living D-.
- Auburn School District (urban): math 47% / reading 56% proficiency, ranked #125 of 291 in WA (top 43%) — acceptable for families but not a draw, mixed tenant base, ~2y average lease.
- Market conditions: 18 active listings in the ZIP; 5 comparable units currently listed for rent nearby; rentals leasing fast (median 5d on market — plan ~1-2 weeks tenant-placement turnaround); high-income renter base; 10,555 units permitted in King County in 2024 (7,119 in 5+ unit buildings).
Forward outlook
- Local home prices are declining (-3.0%/yr); year-one equity from $892 of loan paydown is wiped out by about $4k of value loss. Plan a longer hold.
- King County population projected at +44% by 2050 — long-run rental-demand tailwind backs the buy-and-hold thesis.
- At projected returns (-3.0% appreciation + 3.0% rent growth), your $36k cash investment doubles in ~7 years — after that, you're playing with house money.
Negotiation context
- It's been on market 198 days — a 12% lower offer ($114k) is reasonable based on typical stale-listing flexibility.
Risks & watch-outs
- Climate carrying-cost: moderate flood risk — expect insurance premiums to compound above CPI over the hold.
Questions for the listing agent
- It's been on market 198 days. Have you received any prior offers? Is the seller open to a 12% concession, seller financing, or rate buy-down credit?
- Why hasn't it sold? Are there any deal-killer items the seller is aware of (foundation, flood, title, zoning, code violations)?
- Is there a deadline driving the sale (1031 exchange, divorce, estate, relocation)? That informs how much negotiation room exists.
- What's the average days-on-market for RENTAL listings here right now (not sales)? A rising rental-DOM trend means longer vacancies and softer asking-rent achievability than the comps imply.
- What's the recent tenant-quality profile in this submarket — average credit score on applications, eviction rate, late-payment / NSF rate, and stable-employment percentage? A property-management company in the area should have these aggregated.
- How much new for-sale + rental construction is in the pipeline within 1–3 miles? Heavy new supply typically softens prices + rents 12–24 months out; constrained supply supports both.
Investment metrics
- 1% rule
- 1.42% ✓
- Cap rate
- 11.44%
- Cash-on-cash
- 18.39%
- DSCR
- 1.82
- GRM
- 5.9
CMA / ARV
No comps found within radius.
Projected returns pro-forma
-3.0% appreciation · 3.0% rent growth · sell at horizon
- IRR
- 10.1%
- Equity multiple
- 1.40×
- Total profit
- $14,377
- Equity at exit
- $19,234
- IRR
- 19.2%
- Equity multiple
- 2.61×
- Total profit
- $58,026
- Equity at exit
- $11,154
Cash invested: $36,120 (down + closing). Projections, not guarantees.
Landlord ↔ Tenant lean methodology
- Overall (STATE)
- 28 Tenant-Leaning
- State Washington
- 28 Tenant-Leaning · D+8
- County
- — inherits STATE
- City
- — inherits STATE
ZIP-level market 98047
- Home prices YoY
- -21.2%
- Active inventory
- 18
- Price-to-rent
- 5.9×
Monthly cashflow live
- Estimated rent
- $1,829 high interval (Pro) →
- Mortgage (P&I)
- −$676
- Tax est. 1.5%
- −$161 /mo · $1,935/yr
- Insurance
- −$54
- HOA
- −$0
- Vacancy / Maint / Mgmt
- −$384
- Net cashflow
- $554
Break-even live
UW: 25.0% down · 7.5% · 30yr · 1.5% tax · 5.0% vac · 8.0% maint · 8.0% mgmt
Financing live
Cash to close
- Down payment
- $32,250
- Closing costs
- $3,870
- Reserves months
- —
- Total cash needed
- —
Loan-product check · same deal, 3 products live
Conventional
25% down · 7.5% · 30yr
- Down + closing
- —
- Monthly P&I
- —
- Monthly cashflow
- —
- DSCR
- —
- Eligible?
- —
Personal DTI + credit; lowest rate.
DSCR
20% down · 8.5% · 30yr
- Down + closing
- —
- Monthly P&I
- —
- Monthly cashflow
- —
- DSCR
- —
- Eligible?
- —
No personal income docs; deal must DSCR.
Hard money
10% down · 12.0% · 12mo
- Down + closing
- —
- Monthly P&I
- —
- Monthly cashflow
- —
- DSCR
- —
- Eligible?
- —
Short-term bridge; refi at stabilization.
Rent comps 5 comps
| Address | Beds | Baths | Sqft | Rent | $/sqft | DOM | Units | Dist |
|---|---|---|---|---|---|---|---|---|
| 116 Tacoma Blvd N Unit A1 Pacific, WA | 2.0 | 1.0 | 845 | $1,425 | $1.69 | 2d | 1 | 0.33mi |
| 112 Tacoma Blvd N Unit B2 Pacific, WA | 2.0 | 1.0 | 845 | $1,525 | $1.80 | 2d | 1 | 0.35mi |
| 104 Tacoma Blvd N Unit 12 Pacific, WA | 2.0 | 1.0 | 880 | $1,445 | $1.64 | 22d | 1 | 0.36mi |
| 508 4th Ave SE Pacific, WA | 2.0 | 1.0 | 885 | $2,100 | $2.37 | 24d | 1 | 0.74mi |
| 732 4th Ave NE Pacific, WA | 2.0 | 1.0 | 850 | $1,805 | $2.12 | 5d | 2 | 1.23mi |
Listing history 18 events
-
2026-06-18days on market $129,000 Active 198 DOM
-
2026-06-17days on market $129,000 Active 197 DOM
-
2026-06-16days on market $129,000 Active 196 DOM
-
2026-06-15days on market $129,000 Active 195 DOM
-
2026-06-13days on market $129,000 Active 193 DOM
-
2026-06-13days on market $129,000 Active 192 DOM
-
2026-06-09days on market $129,000 Active 189 DOM
-
2026-06-08days on market $129,000 Active 188 DOM
-
2026-06-07days on market $129,000 Active 187 DOM
-
2026-06-04days on market $129,000 Active 184 DOM
-
2026-06-03days on market $129,000 Active 183 DOM
-
2026-06-02days on market $129,000 Active 182 DOM
-
2026-06-01days on market $129,000 Active 181 DOM
-
2026-05-31days on market $129,000 Active 180 DOM
-
2026-02-25price $129,000
-
2026-01-20price $139,000
-
2025-12-19price $149,500
-
2025-12-02$157,000 Active
ⓘ Source: listings_history table (triggers on properties + properties_extension) + one-shot
backfill from property_details.listing_events for pre-trigger history.
Climate risk First Street
- Flood 5/10 Major FEMA zone X (unshaded) · 26% chance over 30 yrs
- Wildfire 1/10 Low
- Heat 3/10 Moderate 7 d/yr ≥88°F today · 15 d/yr by 30 yrs out
- Wind 1/10 Low
- Air quality 7/10 Severe 10 unhealthy d/yr today · 11 by 30 yrs out
Nearby sold comps map
Loading sold comps map…
Walkable amenities ~0.75 mi
Loading nearby amenities…
Taxation est. · year 1
- Rental income
- $21,949
- − Mortgage interest
- −$7,226
- − Property taxes
- −$1,935
- − Insurance
- −$645
- − Repairs & maintenance
- −$1,756
- − Management
- −$1,756
- − Depreciation
- −$3,753
- Taxable income
- $4,879
- Est. tax owed @ 24.0%
- −$1,171
- After-tax cash flow
- $5,471/yr
For passive investors: Depreciation is non-cash, so a rental often shows a tax loss while cash-flowing — sheltering income. Rental losses are passive: they offset passive income freely, and up to $25,000/yr can offset ordinary (W-2) income if you actively participate and your MAGI is under $100k (phasing out to $0 by $150k); unused losses carry forward. On sale, claimed depreciation is recaptured at up to 25%, and gains may owe capital-gains tax (a 1031 exchange can defer both). Figures are a year-1 estimate at your 24.0% rate — not tax advice; consult a CPA.
Schools (NCES district)
- District
- Auburn School District
- NCES district ID
- 5300300
- Math proficiency
- 47% ▼ -3.00%
- Reading proficiency
- 56% ▼ -1.00%
- Median HH income
- $58,048
- Composite
- 46.73/100
- National rank
- #5240
- State rank
- #125 of 291 in WA
Livability — Pacific
- Score
- 80/100
- State rank
- #99
- US rank
- #1917
Category grades
Schools grade is shown separately in the Schools card above.
Census & demographics
- Census place
- Pacific, WA
- County
- King County · 2,251,916 people
- City population
- 6,817
- Metro
- Seattle-Tacoma-Bellevue, WA
- Population (ZIP)
- 6,817
- Household income
- $115,188
- Rent vs Own
- Severe rent burden
- 248.0
Population outlook (King County) Hauer SSP2
- Today (2025)
- 2,576,485 people
- By 2030
- 2,803,316 · +8.8%
- By 2040
- 3,255,921 · +26.4%
- By 2050
- 3,706,444 · +43.9%
- By 2075
- 4,746,063 · +84.2%
- By 2100
- 5,407,730 · +109.9%
Race, ethnicity, and origin ACS 2023
- Neighborhood character
- Diverse neighborhood (Simpson 0.69)
- Race & ethnicity
- White 50% Hispanic / Latino 24% Two or more races 17% Asian 8% Black 6% Pacific Islander 6%
- Hispanic origin (detail)
- Mexican 23%
- Common ancestry
- Italian 6% Scotch-Irish 5% Subsaharan African 4%
- Foreign-born
- 23% · Canada, Vietnam
- Languages at home
- 63% English-only · Spanish 19% Russian/Polish/Slavic 10% Other Asian/Pacific 4%
Political lean MEDSL · King
- 2024 margin
- Solid D (+51.7) · D 74.2% · R 22.5% · Other 3.4%
- 2008→2024 swing
- +9.6pp toward D · 2008: 42.1pp · 2024: 51.7pp
- All cycles
- 2024: D+51.7 2020: D+52.7 2016: D+50.4 2012: D+39.9 2008: D+42.1
Not yet ingested
- Civics
- —
Market trends
- HPI YoY
- ▼ -88.97%
- Current HPI
- 331.3061
- Rent YoY
- —
- Metro
- Seattle-Tacoma-Bellevue, WA
- State GDP YoY
- ▲ 4.65%
- F500 in state
- 22
Industry mix (Fortune 500 HQ in WA)
| Industry | F500 HQs | Revenue |
|---|---|---|
| Retail | 2 | $269B |
|
||
| Technology / Retail | 1 | $638B |
|
||
| Technology | 1 | $245B |
|
||
| Telecommunications | 1 | $38B |
|
||
| Food / Beverage | 1 | $36B |
|
||
| Automotive / Trucks | 1 | $34B |
|
||
Price history
-17.8% since first listed4 events — show timeline
- 2026-02-25 Price Changed $129,000 NWMLS as Distributed by MLS Grid
- 2026-01-20 Price Changed $139,000 NWMLS as Distributed by MLS Grid
- 2025-12-19 Price Changed $149,500 NWMLS as Distributed by MLS Grid
- 2025-12-02 Listed $157,000 NWMLS as Distributed by MLS Grid
Cash-flow waterfall
monthlySold comps — $/sqft
last 12 mo · ≤1 miLoading sold comps…