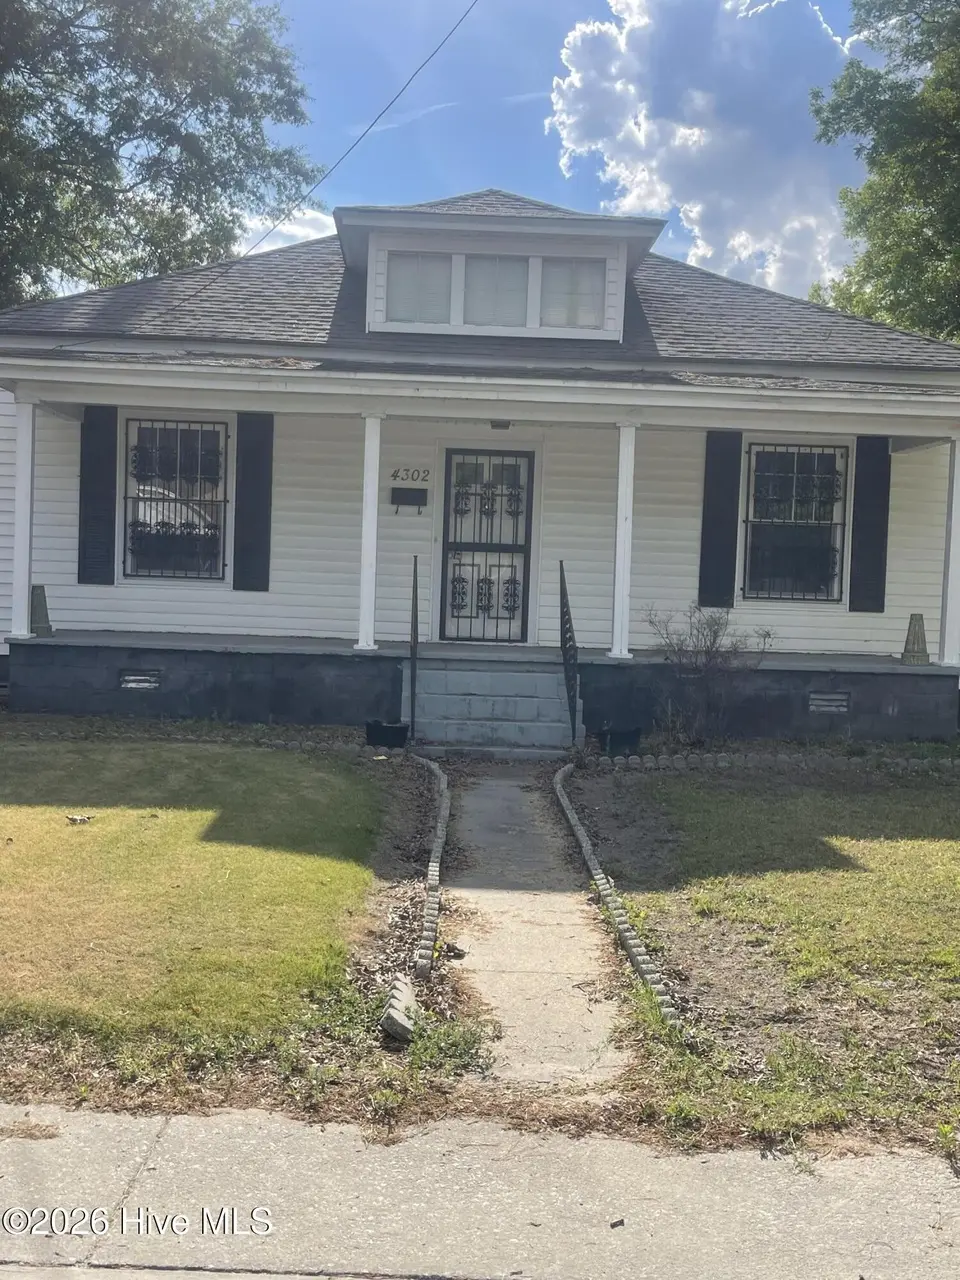
4302 Martin Luther King Junior St · Ayden, NC
Flood risk 1/10 · Minimal
- FEMA flood zone
- X (unshaded)
- Chance of flooding over 30 yrs
- 0.0%
- Est. flood insurance / yr
- $507 – $1,088
Fire risk 2/10 · Minimal
- Est. fire insurance / yr
- $906 – $1,684
Heat risk 8/10 · Major
- Hot days now (above 107°F)
- 7 days/yr
- Hot days in 30 yrs
- 17 days/yr
Wind risk 8/10 · Major
- Chance of severe wind over 30 yrs
- 80.0%
Air-quality risk 3/10 · Minor
- Unhealthy air days now
- 3 days/yr
- Unhealthy air days in 30 yrs
- 3 days/yr
Risk factors via First Street. Map © Google.
Why this score? — see what drove the B- grade
The composite is a weighted blend of 9 inputs, each scored 0–100. Each bar is that input's sub-score; the figure is the points it added to the 100-point composite (weight × sub-score).
- Cash flow +30.0/30.0
- 1% rule +10.0/10.0
- DSCR +10.0/10.0
- ARV discount +7.5/15.0
- Livability +3.8/5.0
- Schools +3.6/10.0
- Rent growth +2.5/5.0
- Condition / age +2.5/5.0
- Appreciation +0.0/10.0
$88,000
🖨 Deal sheet (PDF) 📄 Offer letter ✓ Due diligence
Listing remarks
Investor special or perfect opportunity for a first-time buyer ready to create something special! Nestled in the heart of Ayden, this charming fixer-upper is full of incredible potential and waiting for the right vision to bring it to life. Situated on a spacious . 26-acre lot, this 3-bedroom, 2-bath home offers plenty of room to renovate, personalize, and build equity. Located within the city limits while still offering that warm small-town feel, this property is an affordable opportunity to put down roots, start your investment portfolio, or design the home you've always imagined. With solid space, a great location, and endless possibilities, this hidden gem is ready for transformation. B
Key facts
- 0.26 acre lot
- Built 1935
- Listed 28 days
Property features AI
Exterior
- Parking: Off-street parking
- Utilities: Water connected
- Home design: Single-family residence; One story; Entry level: 1
- Construction: Vinyl siding; Frame construction; Crawl space foundation; Built with standard shingle roofing
- Exterior features: Covered front porch; Shingle roof; No fencing; Has a view; Paved road access; Frontage on city street and state road
Interior
- Bedrooms: 5 total rooms (room count provided)
- Flooring: Carpet; Vinyl
- Bathrooms: 1 full bathroom; 1 half bathroom
- Heating & cooling: Central air conditioning; Ceiling fans; Propane heating; Electric heating; Forced air heating
- Interior features: Ceiling fans
Neighborhood map
What this means for you Summary
Snapshot
- This is a 3-bed/1.0-bath single-family listed at $88k.
Deal economics
- At list price, monthly cash flow is $635 ($8k/yr) — positive.
- The deal already cash-flows at list — no discount required.
- Meets the 1% rule at list price ($2k rent vs $88k).
- Recommended offer: $87k (1.5% below list) — sets the bar for market timing.
- Cap rate 14.9% vs local median 2.8% in Ayden — top-decile yield for the area; either an underpriced asset or a hidden risk that comps aren't pricing in. Stress-test before assuming the spread holds.
Location & tenants
- Location reads 76/100 on livability (#41 in NC, #3,656 nationally) — a middle-class / working-renter tenant base. Strengths: cost of living A+, housing A+, health & safety A+; Watch: amenities D+, employment D, commute F.
- Pitt County Schools (rural): math 41% / reading 44% proficiency, ranked #100 of 178 in NC (top 56%) — families likely to look elsewhere, expect single-tenant / working-renter base with shorter leases.
- Zoned schools: Ayden Elementary (math 30% / reading 34%, grade F, #908 of 1,410 statewide, top 67%, 638 students, 100% FRL); Ayden Middle (math 34% / reading 39%, grade F, #270 of 475 statewide, top 57%, 388 students, 99% FRL); Ayden-Grifton High (math 32% / reading 42%, grade F, #414 of 535 statewide, top 79%, 659 students, 99% FRL) — zoned schools average 99% FRL vs 56% district-wide (43 pts higher); higher-poverty schools than district average — tighter screening recommended.
- Market conditions: 156 active listings in the ZIP; 3 comparable units currently listed for rent nearby; rentals at typical pace (median 22d on market — plan ~3-4 weeks tenant-placement turnaround); 1,300 units permitted in Pitt County in 2024 (204 in 5+ unit buildings).
Forward outlook
- Local home prices are declining (-3.0%/yr); year-one equity from $608 of loan paydown is wiped out by about $3k of value loss. Plan a longer hold.
- Pitt County population projected at +22% by 2050 — long-run rental-demand tailwind backs the buy-and-hold thesis.
- At projected returns (-3.0% appreciation + 3.0% rent growth), your $25k cash investment doubles in ~4 years — after that, you're playing with house money.
Negotiation context
- It's been on market 28 days — a 2% lower offer ($87k) is reasonable based on typical stale-listing flexibility.
Risks & watch-outs
- Watch-outs: built in 1935 — expect roof / HVAC / electrical / plumbing capex.
- Climate carrying-cost: severe wind risk, 80% chance of damaging wind over 30y; extreme-heat days projected 7→17/yr by 2055 (HVAC capex compounding) — expect insurance premiums to compound above CPI over the hold.
Questions for the listing agent
- Built in 1935 — when were the roof, HVAC, electrical panel, plumbing, and water heater last replaced?
- Is there a deadline driving the sale (1031 exchange, divorce, estate, relocation)? That informs how much negotiation room exists.
- Schools are F-rated, which usually means shorter tenancies and higher turnover. Who's the typical renter profile here, and what's been the actual vacancy rate?
- What's the average days-on-market for RENTAL listings here right now (not sales)? A rising rental-DOM trend means longer vacancies and softer asking-rent achievability than the comps imply.
- What's the recent tenant-quality profile in this submarket — average credit score on applications, eviction rate, late-payment / NSF rate, and stable-employment percentage? A property-management company in the area should have these aggregated.
- How much new for-sale + rental construction is in the pipeline within 1–3 miles? Heavy new supply typically softens prices + rents 12–24 months out; constrained supply supports both.
Investment metrics
- 1% rule
- 1.71% ✓
- Cap rate
- 14.95%
- Cash-on-cash
- 30.91%
- DSCR
- 2.38
- GRM
- 4.9
CMA / ARV
- ARV (on-the-fly)
- $241,536
- Comps found
- 12
Show comp detail 12 sales within ~0.75 mi
| Address | Dist | Beds/Ba | Sqft | Sold | Price | $/sf | Match |
|---|---|---|---|---|---|---|---|
| 333 Fifth St | 0.33mi | 3/1.0 | 1,637 (+0%) | 1mo | $185,000 | $113 | 83 |
| 4318 Martin Luther King Jr. St | 0.04mi | 3/2.5 | 1,717 (+5%) | 2mo | $189,000 | $110 | 82 |
| 4214 Park Ave | 0.15mi | 3/2.0 | 1,721 (+6%) | 4mo | $211,000 | $123 | 76 |
| 4191 Washington St | 0.28mi | 3/2.0 | 1,577 (-3%) | 9mo | $254,000 | $161 | 70 |
| 4162 Westhaven Ave | 0.52mi | 3/2.0 | 1,591 (-2%) | 0mo | $246,750 | $155 | 67 |
| 452 Snow Hill St | 0.23mi | 3/1.5 | 1,764 (+8%) | 9mo | $219,900 | $125 | 66 |
| 620 2nd St | 0.60mi | 3/2.0 | 1,630 (-0%) | 10mo | $245,000 | $150 | 60 |
| 316 Allen Dr | 0.59mi | 3/2.0 | 1,573 (-4%) | 4mo | $290,000 | $184 | 59 |
| 4204 Lee St | 0.49mi | 3/1.5 | 1,809 (+11%) | 2mo | $245,000 | $135 | 55 |
| 4187 SE College St | 0.75mi | 3/1.0 | 1,465 (-10%) | 5mo | $90,000 | $61 | 44 |
| 400 Silo Ct | 0.67mi | 4/3.0 (+1) | 1,815 (+11%) | 6mo | $285,000 | $157 | 32 |
| 4502 Bushel Ct | 0.72mi | 4/3.0 (+1) | 1,824 (+12%) | 5mo | $269,500 | $148 | 30 |
Match score weights: distance 35% · size 25% · config 20% · recency 20%. Top-matched comps best support the ARV.
Projected returns pro-forma
-3.0% appreciation · 3.0% rent growth · sell at horizon
- IRR
- 25.7%
- Equity multiple
- 2.06×
- Total profit
- $26,146
- Equity at exit
- $13,121
- IRR
- 33.4%
- Equity multiple
- 4.03×
- Total profit
- $74,765
- Equity at exit
- $7,609
Cash invested: $24,640 (down + closing). Projections, not guarantees.
Landlord ↔ Tenant lean methodology
- Overall (STATE)
- 85 Strongly Landlord-Friendly
- State North Carolina
- 85 Strongly Landlord-Friendly · R+3
- County
- — inherits STATE
- City
- — inherits STATE
ZIP-level market 28513
- Home prices YoY
- -8.8%
- Active inventory
- 156
- Price-to-rent
- 4.9×
Monthly cashflow live
- Estimated rent
- $1,502 medium interval (Pro) →
- Mortgage (P&I)
- −$461
- Tax from tax record
- −$54 /mo · $648/yr
- Insurance
- −$37
- HOA
- −$0
- Vacancy / Maint / Mgmt
- −$315
- Net cashflow
- $635
Break-even live
Sensitivity live
| Price | -10% $684 | -5% $660 | +0% $635 | +5% $610 | +10% $585 |
|---|---|---|---|---|---|
| Rent | -10% $516 | -5% $575 | +0% $635 | +5% $694 | +10% $753 |
| Rate | -1.0pp $679 | -0.5pp $657 | base $635 | +0.5pp $612 | +1.0pp $589 |
UW: 25.0% down · 7.5% · 30yr · 1.5% tax · 5.0% vac · 8.0% maint · 8.0% mgmt
Financing live
Cash to close
- Down payment
- $22,000
- Closing costs
- $2,640
- Reserves months
- —
- Total cash needed
- —
Loan-product check · same deal, 3 products live
Conventional
25% down · 7.5% · 30yr
- Down + closing
- —
- Monthly P&I
- —
- Monthly cashflow
- —
- DSCR
- —
- Eligible?
- —
Personal DTI + credit; lowest rate.
DSCR
20% down · 8.5% · 30yr
- Down + closing
- —
- Monthly P&I
- —
- Monthly cashflow
- —
- DSCR
- —
- Eligible?
- —
No personal income docs; deal must DSCR.
Hard money
10% down · 12.0% · 12mo
- Down + closing
- —
- Monthly P&I
- —
- Monthly cashflow
- —
- DSCR
- —
- Eligible?
- —
Short-term bridge; refi at stabilization.
Rent comps 3 comps
| Address | Beds | Baths | Sqft | Rent | $/sqft | DOM | Units | Dist |
|---|---|---|---|---|---|---|---|---|
| 482 Snow Hill St Ayden, NC | 3.0 | 2.0 | 1989 | $1,550 | $0.78 | 21d | 1 | 0.25mi |
| 4058 West Ave Ayden, NC | 2.0 | 1.0 | 1350 | $1,500 | $1.11 | 21d | 1 | 0.56mi |
| 4335 Legacy Park Way Ayden, NC | 2.0 | 2.0 | 1050 | $1,325 | $1.26 | 21d | 1 | 0.75mi |
Listing history 19 events
-
2026-06-19days on market $88,000 Active 28 DOM
-
2026-06-18days on market $88,000 Active 27 DOM
-
2026-06-17days on market $88,000 Active 26 DOM
-
2026-06-16days on market $88,000 Active 25 DOM
-
2026-06-15days on market $88,000 Active 24 DOM
-
2026-06-13days on market $88,000 Active 21 DOM
-
2026-06-10days on market $88,000 Active 19 DOM
-
2026-06-09days on market $88,000 Active 18 DOM
-
2026-06-09price $88,000 Active 17 DOM
-
2026-06-08days on market $108,000 Active 17 DOM
-
2026-06-07days on market $108,000 Active 16 DOM
-
2026-06-05days on market $108,000 Active 13 DOM
-
2026-06-03days on market $108,000 Active 12 DOM
-
2026-06-03price $108,000 Active 11 DOM
-
2026-06-02days on market $125,000 Active 11 DOM
-
2026-06-01days on market $125,000 Active 10 DOM
-
2026-05-31days on market $125,000 Active 9 DOM
-
2026-05-30days on market $125,000 Active 8 DOM
-
2026-05-22$125,000 Active
ⓘ Source: listings_history table (triggers on properties + properties_extension) + one-shot
backfill from property_details.listing_events for pre-trigger history.
Tax reassessment forecast NC · Resets to sale price
- Current annual tax
- $648 · $54/mo
- Projected year-2 tax
- $722 · $60/mo
- Expected delta
- +$73/yr (+$6/mo · 11.3%)
ⓘ Screening estimate from a state-policy table — verify with the county assessor before closing.
Climate risk First Street
- Flood 1/10 Low FEMA zone X (unshaded) · 0% chance over 30 yrs
- Wildfire 2/10 Low
- Heat 8/10 Severe 7 d/yr ≥107°F today · 17 d/yr by 30 yrs out
- Wind 8/10 Severe 80% chance of damaging wind over 30 yrs
- Air quality 3/10 Moderate 3 unhealthy d/yr today · 3 by 30 yrs out
Nearby sold comps map
Loading sold comps map…
Walkable amenities ~0.75 mi
Loading nearby amenities…
Taxation est. · year 1
- Rental income
- $18,027
- − Mortgage interest
- −$4,929
- − Property taxes
- −$648
- − Insurance
- −$440
- − Repairs & maintenance
- −$1,442
- − Management
- −$1,442
- − Depreciation
- −$2,560
- Taxable income
- $6,565
- Est. tax owed @ 24.0%
- −$1,576
- After-tax cash flow
- $6,040/yr
For passive investors: Depreciation is non-cash, so a rental often shows a tax loss while cash-flowing — sheltering income. Rental losses are passive: they offset passive income freely, and up to $25,000/yr can offset ordinary (W-2) income if you actively participate and your MAGI is under $100k (phasing out to $0 by $150k); unused losses carry forward. On sale, claimed depreciation is recaptured at up to 25%, and gains may owe capital-gains tax (a 1031 exchange can defer both). Figures are a year-1 estimate at your 24.0% rate — not tax advice; consult a CPA.
Schools (NCES district)
- District
- Pitt County Schools
- NCES district ID
- 3700012
- Math proficiency
- 41% ▬ 0.00%
- Reading proficiency
- 44% ▲ 2.00%
- Median HH income
- $40,631
- Composite
- 35.67/100
- National rank
- #4877
- State rank
- #100 of 178 in NC
Livability — Ayden
- Score
- 76/100
- State rank
- #41
- US rank
- #3656
Category grades
Schools grade is shown separately in the Schools card above.
Census & demographics
- Census place
- Ayden, NC
- Population (ZIP)
- 9,754
Population outlook (Pitt County) Hauer SSP2
- Today (2025)
- 194,585 people
- By 2030
- 203,756 · +4.7%
- By 2040
- 220,807 · +13.5%
- By 2050
- 236,614 · +21.6%
- By 2075
- 275,940 · +41.8%
- By 2100
- 300,058 · +54.2%
Race, ethnicity, and origin ACS 2023
- Neighborhood character
- Diverse neighborhood (Simpson 0.58)
- Race & ethnicity
- White 57% Black 29% Hispanic / Latino 13% Two or more races 4%
- Hispanic origin (detail)
- Mexican 10% Puerto Rican 2% Cuban 1%
- Common ancestry
- Serbian 3% Italian 1% Iranian 1%
- Foreign-born
- 4% · Canada, Jamaica
- Languages at home
- 90% English-only · Spanish 10%
Political lean MEDSL · Pitt
- 2024 margin
- Lean D (+6.0) · D 52.5% · R 46.5% · Other 1.1%
- 2008→2024 swing
- -2.8pp toward R · 2008: 8.8pp · 2024: 6.0pp
- All cycles
- 2024: D+6.0 2020: D+9.4 2016: D+7.4 2012: D+6.7 2008: D+8.8
Not yet ingested
- Civics
- —
Market trends
- HPI YoY
- ▼ -18.36%
- Current HPI
- 190.2552
- Rent YoY
- —
- Metro
- —
- State GDP YoY
- ▲ 3.28%
- F500 in state
- 26
Industry mix (Fortune 500 HQ in NC)
| Industry | F500 HQs | Revenue |
|---|---|---|
| Financial Services | 2 | $213B |
|
||
| Retail | 2 | $95B |
|
||
| Industrial Conglomerate | 1 | $38B |
|
||
| Metals / Steel | 1 | $35B |
|
||
| Utilities | 1 | $30B |
|
||
| Industrial Machinery | 1 | $19B |
|
||
Price history
1 event — show timeline
- 2026-05-22 Listed $125,000 Hive MLS
Property tax history
+18.6%/yrLatest (2025): $648 · +1.9% YoY. Source: county tax records.
Cash-flow waterfall
monthlySold comps — $/sqft
last 12 mo · ≤1 miLoading sold comps…