None · Greenwood, MS
Flood risk 6/10 · Moderate
- FEMA flood zone
- X
- Chance of flooding over 30 yrs
- 0.7%
- Est. flood insurance / yr
- $507 – $1,088
Fire risk 1/10 · Minimal
- Est. fire insurance / yr
- $1,241 – $2,305
Heat risk 7/10 · Major
- Hot days now (above 110°F)
- 7 days/yr
- Hot days in 30 yrs
- 21 days/yr
Wind risk 6/10 · Moderate
- Chance of severe wind over 30 yrs
- 27.0%
Air-quality risk 1/10 · Minimal
- Unhealthy air days now
- 0 days/yr
- Unhealthy air days in 30 yrs
- 0 days/yr
Risk factors via First Street. Map © Google.
Why this score? — see what drove the C grade
The composite is a weighted blend of 9 inputs, each scored 0–100. Each bar is that input's sub-score; the figure is the points it added to the 100-point composite (weight × sub-score).
- Cash flow +18.2/30.0
- ARV discount +15.0/15.0
- 1% rule +6.7/10.0
- DSCR +5.7/10.0
- Schools +5.0/10.0
- Livability +3.6/5.0
- Rent growth +2.5/5.0
- Condition / age +2.5/5.0
- Appreciation +0.0/10.0
$60,000
🖨 Deal sheet 📄 Offer letter ✓ Due diligence
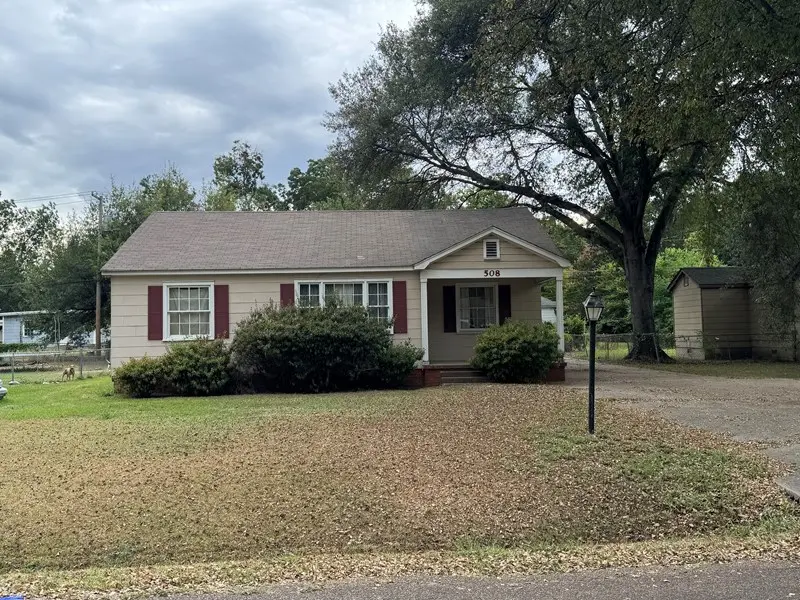
Listing remarks MLS
Spacious 3 bedroom 1 bath home that is very affordable! With some TLC this home could be amazing!
Key facts
- Affordable home
- Spacious home
- 9,088 sq ft lot
Tags
Neighborhood map
What this means for you Summary
Snapshot
- This is a 2-bed/1.0-bath single-family listed at $60k.
Deal economics
- At list price, monthly cash flow is $54 ($652/yr) — positive.
- The deal already cash-flows at list — no discount required.
- Meets the 1% rule at list price ($700 rent vs $60k).
- Recommended offer: $53k (12.0% below list) — sets the bar for market timing.
- Cap rate 7.4% vs local median 4.9% in Greenwood — top-decile yield for the area; either an underpriced asset or a hidden risk that comps aren't pricing in. Stress-test before assuming the spread holds.
Location & tenants
- Location reads 71/100 on livability (#31 in MS) — a middle-class / working-renter tenant base. Strengths: cost of living A+, health & safety A+, housing A; Watch: schools D, amenities F, commute F.
- Market conditions: 100 active listings in the ZIP; 1 comparable units currently listed for rent nearby; 9 units permitted in Leflore County in 2024 (0 in 5+ unit buildings).
Forward outlook
- Local home prices are declining (-3.0%/yr); year-one equity from $415 of loan paydown is wiped out by about $2k of value loss. Plan a longer hold.
- Leflore County population projected at -29% by 2050 — secular population decline; favor cash flow + early exit over multi-decade hold.
Negotiation context
- It's been on market 657 days — a 12% lower offer ($53k) is reasonable based on typical stale-listing flexibility.
Risks & watch-outs
- Watch-outs: property tax is 3.2% of price; built in 1940 — expect roof / HVAC / electrical / plumbing capex.
- Climate carrying-cost: major flood risk; major wind risk, 27% chance of damaging wind over 30y; extreme-heat days projected 7→21/yr by 2055 (HVAC capex compounding) — expect insurance premiums to compound above CPI over the hold.
Questions for the listing agent
- It's been on market 657 days. Have you received any prior offers? Is the seller open to a 12% concession, seller financing, or rate buy-down credit?
- Built in 1940 — when were the roof, HVAC, electrical panel, plumbing, and water heater last replaced?
- Property tax is high relative to price — has the assessment been appealed recently, and will the sale trigger a re-assessment?
- Why hasn't it sold? Are there any deal-killer items the seller is aware of (foundation, flood, title, zoning, code violations)?
- Is there a deadline driving the sale (1031 exchange, divorce, estate, relocation)? That informs how much negotiation room exists.
- Schools are D-rated, which usually means shorter tenancies and higher turnover. Who's the typical renter profile here, and what's been the actual vacancy rate?
- What's the average days-on-market for RENTAL listings here right now (not sales)? A rising rental-DOM trend means longer vacancies and softer asking-rent achievability than the comps imply.
- What's the recent tenant-quality profile in this submarket — average credit score on applications, eviction rate, late-payment / NSF rate, and stable-employment percentage? A property-management company in the area should have these aggregated.
- How much new for-sale + rental construction is in the pipeline within 1–3 miles? Heavy new supply typically softens prices + rents 12–24 months out; constrained supply supports both.
Investment metrics
- 1% rule
- 1.17% ✓
- Cap rate
- 7.38%
- Cash-on-cash
- 3.88%
- DSCR
- 1.17
- GRM
- 7.1
CMA / ARV
- ARV (median comp)
- $86,311
- List price
- $60,000
- Delta
- -30.48%
- Verdict
- UNDERPRICED
- Comps
- 20 within 1.0 mi
Show comp detail 8 sales within ~0.75 mi
| Address | Dist | Beds/Ba | Sqft | Sold | Price | $/sf | Match |
|---|---|---|---|---|---|---|---|
| 308 W Harding Ave | 0.22mi | 2/1.0 | 1,177 (-1%) | 11mo | $62,000 | $53 | 79 |
| 507 W Jefferson Ave | 0.26mi | 2/1.0 | 1,225 (+3%) | 10mo | $55,000 | $45 | 75 |
| 410 Cherokee Rd | 0.10mi | 3/1.0 (+1) | 1,164 (-2%) | 17mo | $87,500 | $75 | 72 |
| 108 Virginia St | 0.51mi | 2/1.0 | 1,244 (+4%) | 5mo | $85,000 | $68 | 65 |
| 604 W West President Ave | 0.30mi | 2/1.0 | 1,141 (-4%) | 23mo | $74,000 | $65 | 60 |
| 1201-7 Strong Ave | 0.73mi | 2/1.0 | 1,260 (+6%) | 6mo | $35,000 | $28 | 51 |
| 1108 W President Ave | 0.40mi | 3/1.0 (+1) | 1,305 (+10%) | 11mo | $120,000 | $92 | 51 |
| 211 Greenfield Dr | 0.34mi | 2/2.0 | 1,318 (+11%) | 19mo | $99,900 | $76 | 47 |
Match score weights: distance 35% · size 25% · config 20% · recency 20%. Top-matched comps best support the ARV.
Projected returns pro-forma
-3.0% appreciation · 3.0% rent growth · sell at horizon
- IRR
- -10.1%
- Equity multiple
- 0.63×
- Total profit
- $-6,198
- Equity at exit
- $8,946
- IRR
- -0.6%
- Equity multiple
- 0.96×
- Total profit
- $-686
- Equity at exit
- $5,188
Cash invested: $16,800 (down + closing). Projections, not guarantees.
Landlord ↔ Tenant lean methodology
- Overall (STATE)
- 90 Strongly Landlord-Friendly
- State Mississippi
- 90 Strongly Landlord-Friendly · R+11
- County
- — inherits STATE
- City
- — inherits STATE
ZIP-level market 38930
- Home prices YoY
- -18.6%
- Active inventory
- 100
- Price-to-rent
- 7.1×
Monthly cashflow live
- Estimated rent
- $700 medium interval (Pro) →
- Mortgage (P&I)
- −$315
- Tax from tax record
- −$159 /mo · $1,908/yr
- Insurance
- −$25
- HOA
- −$0
- Vacancy / Maint / Mgmt
- −$147
- Net cashflow
- $54
Break-even live
UW: 25.0% down · 7.5% · 30yr · 1.5% tax · 5.0% vac · 8.0% maint · 8.0% mgmt
Financing live
Cash to close
- Down payment
- $15,000
- Closing costs
- $1,800
- Reserves months
- —
- Total cash needed
- —
Loan-product check · same deal, 3 products live
Conventional
25% down · 7.5% · 30yr
- Down + closing
- —
- Monthly P&I
- —
- Monthly cashflow
- —
- DSCR
- —
- Eligible?
- —
Personal DTI + credit; lowest rate.
DSCR
20% down · 8.5% · 30yr
- Down + closing
- —
- Monthly P&I
- —
- Monthly cashflow
- —
- DSCR
- —
- Eligible?
- —
No personal income docs; deal must DSCR.
Hard money
10% down · 12.0% · 12mo
- Down + closing
- —
- Monthly P&I
- —
- Monthly cashflow
- —
- DSCR
- —
- Eligible?
- —
Short-term bridge; refi at stabilization.
Rent comps 1 comps
| Address | Beds | Baths | Sqft | Rent | $/sqft | DOM | Units | Dist |
|---|---|---|---|---|---|---|---|---|
| 207 Martin St Greenwood, MS | 2.0 | 1.0 | 950 | $700 | $0.74 | 44d | 1 | 0.50mi |
Listing history 15 events
-
2026-06-18days on market $60,000 Active 657 DOM
-
2026-06-17days on market $60,000 Active 656 DOM
-
2026-06-16days on market $60,000 Active 655 DOM
-
2026-06-15days on market $60,000 Active 654 DOM
-
2026-06-13days on market $60,000 Active 652 DOM
-
2026-06-12days on market $60,000 Active 651 DOM
-
2026-06-09days on market $60,000 Active 648 DOM
-
2026-06-08days on market $60,000 Active 647 DOM
-
2026-06-07days on market $60,000 Active 646 DOM
-
2026-06-04days on market $60,000 Active 642 DOM
-
2026-06-02days on market $60,000 Active 641 DOM
-
2026-06-01days on market $60,000 Active 640 DOM
-
2026-05-31days on market $60,000 Active 639 DOM
-
2024-08-29$60,000 Active 98-char remark
Show marketing remark (98 chars)
Spacious 3 bedroom 1 bath home that is very affordable! With some TLC this home could be amazing!
-
1978-09-18soldstatus
ⓘ Source: listings_history table (triggers on properties + properties_extension) + one-shot
backfill from property_details.listing_events for pre-trigger history.
Tax reassessment forecast MS · Resets to sale price
- Current annual tax
- $1,908 · $159/mo
- Projected year-2 tax
- $1,908 · $159/mo
- Expected delta
- $0/yr ($0/mo · 0.0%)
ⓘ Screening estimate from a state-policy table — verify with the county assessor before closing.
Climate risk First Street
- Flood 6/10 Major FEMA zone X · 70% chance over 30 yrs
- Wildfire 1/10 Low
- Heat 7/10 Severe 7 d/yr ≥110°F today · 21 d/yr by 30 yrs out
- Wind 6/10 Major 27% chance of damaging wind over 30 yrs
- Air quality 1/10 Low 0 unhealthy d/yr today · 0 by 30 yrs out
Nearby sold comps map
Loading sold comps map…
Walkable amenities ~0.75 mi
Loading nearby amenities…
Taxation est. · year 1
- Rental income
- $8,400
- − Mortgage interest
- −$3,361
- − Property taxes
- −$1,908
- − Insurance
- −$300
- − Repairs & maintenance
- −$672
- − Management
- −$672
- − Depreciation
- −$1,745
- Taxable loss
- −$258
- Est. tax savings @ 24.0%
- +$62
- After-tax cash flow
- $714/yr
For passive investors: Depreciation is non-cash, so a rental often shows a tax loss while cash-flowing — sheltering income. Rental losses are passive: they offset passive income freely, and up to $25,000/yr can offset ordinary (W-2) income if you actively participate and your MAGI is under $100k (phasing out to $0 by $150k); unused losses carry forward. On sale, claimed depreciation is recaptured at up to 25%, and gains may owe capital-gains tax (a 1031 exchange can defer both). Figures are a year-1 estimate at your 24.0% rate — not tax advice; consult a CPA.
Schools (NCES district)
No district data.
Livability — Greenwood
- Score
- 71/100
- State rank
- #31
- US rank
- #6625
Category grades
Schools grade is shown separately in the Schools card above.
Census & demographics
- Census place
- Greenwood, MS
- Population (ZIP)
- 23,326
Population outlook (Leflore County) Hauer SSP2
- Today (2025)
- 27,008 people
- By 2030
- 25,362 · -6.1%
- By 2040
- 22,049 · -18.4%
- By 2050
- 19,188 · -29.0%
- By 2075
- 13,543 · -49.9%
- By 2100
- 8,913 · -67.0%
Race, ethnicity, and origin ACS 2023
- Neighborhood character
- Predominantly Black (70%)
- Race & ethnicity
- Black 70% White 25% Hispanic / Latino 3% Two or more races 1%
- Common ancestry
- Slovak 1% Serbian 1%
- Foreign-born
- 2% · Canada, Jamaica
- Languages at home
- 97% English-only · Spanish 2%
Political lean MEDSL · Leflore
- 2024 margin
- Solid D (+38.5) · D 68.7% · R 30.3%
- 2008→2024 swing
- +1.7pp toward D · 2008: 36.8pp · 2024: 38.5pp
- All cycles
- 2024: D+38.5 2020: D+41.5 2016: D+41.0 2012: D+45.8 2008: D+36.8
Not yet ingested
- Civics
- —
Market trends
- HPI YoY
- ▼ -34.32%
- Current HPI
- 150.2668
- Rent YoY
- —
- Metro
- —
- State GDP YoY
- —
- F500 in state
- 0
Price history
2 events — show timeline
- 2024-08-29 Listed $60,000 GBOR
- 1978-09-18 Sold (Public Records) — Public Records
Property tax history
+9.9%/yrLatest (2025): $1,908 · +138.7% YoY. Source: county tax records.
Cash-flow waterfall
monthlySold comps — $/sqft
last 12 mo · ≤1 miLoading sold comps…