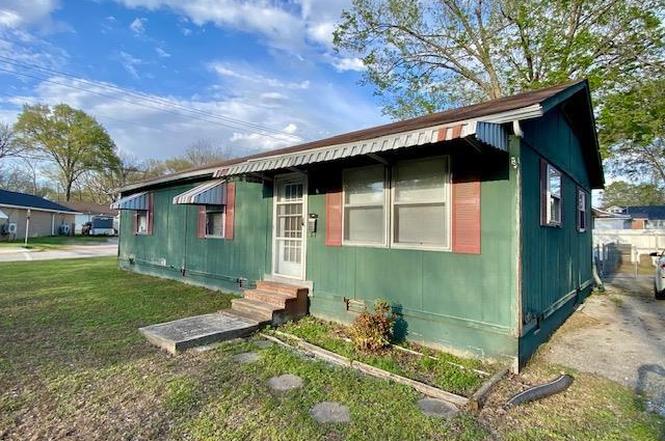
302 Elm St · Martin, TN
Flood risk 1/10 · Minimal
- FEMA flood zone
- X (unshaded)
- Chance of flooding over 30 yrs
- 0.0%
- Est. flood insurance / yr
- $507 – $1,088
Fire risk 1/10 · Minimal
- Est. fire insurance / yr
- $949 – $1,763
Heat risk 6/10 · Moderate
- Hot days now (above 108°F)
- 7 days/yr
- Hot days in 30 yrs
- 21 days/yr
Wind risk 4/10 · Minor
- Chance of severe wind over 30 yrs
- 8.0%
Air-quality risk 1/10 · Minimal
- Unhealthy air days now
- 0 days/yr
- Unhealthy air days in 30 yrs
- 0 days/yr
Risk factors via First Street. Map © Google.
Why this score? — see what drove the B+ grade
The composite is a weighted blend of 9 inputs, each scored 0–100. Each bar is that input's sub-score; the figure is the points it added to the 100-point composite (weight × sub-score).
- Cash flow +30.0/30.0
- ARV discount +15.0/15.0
- DSCR +10.0/10.0
- 1% rule +8.9/10.0
- Livability +3.8/5.0
- Schools +3.0/10.0
- Rent growth +2.5/5.0
- Condition / age +2.5/5.0
- Appreciation +0.0/10.0
$99,900
🖨 Deal sheet 📄 Offer letter ✓ Due diligence
Listing remarks
Three bedroom, two full bath home currently used as a rental.
Key facts
- 8,280 sq ft lot
- Garage
- Built 1981
Neighborhood map
What this means for you Summary
Snapshot
- This is a 3-bed/1.0-bath single-family listed at $100k.
Deal economics
- At list price, monthly cash flow is $505 ($6k/yr) — positive.
- The deal already cash-flows at list — no discount required.
- Meets the 1% rule at list price ($1k rent vs $100k).
- Cap rate 12.4% vs local median 4.0% in Martin — top-decile yield for the area; either an underpriced asset or a hidden risk that comps aren't pricing in. Stress-test before assuming the spread holds.
Location & tenants
- Location reads 75/100 on livability (#15 in TN, #4,330 nationally) — a middle-class / working-renter tenant base. Strengths: cost of living A+, health & safety A+, housing B+; Watch: schools D+, commute F, employment F.
- Weakley County (rural): math 34% / reading 38% proficiency, ranked #32 of 139 in TN (top 23%) — families likely to look elsewhere, expect single-tenant / working-renter base with shorter leases.
- Market conditions: 85 active listings in the ZIP; 69 units permitted in Weakley County in 2024 (0 in 5+ unit buildings).
- This rent runs 32% of the median local income ($52k/yr) — at the standard rent-burdened threshold; future hikes will face affordability resistance.
Forward outlook
- Local home prices are declining (-3.0%/yr); year-one equity from $691 of loan paydown is wiped out by about $3k of value loss. Plan a longer hold.
- Weakley County population projected at -20% by 2050 — secular population decline; favor cash flow + early exit over multi-decade hold.
- At projected returns (-3.0% appreciation + 3.0% rent growth), your $28k cash investment doubles in ~6 years — after that, you're playing with house money.
Negotiation context
- Only 1 days on market — expect competitive offers; lowballing is unlikely to land.
- Current owner paid $47k; list at $100k implies a 114% gain — meaningful room to come down on a strong offer.
Risks & watch-outs
- Climate carrying-cost: extreme-heat days projected 7→21/yr by 2055 (HVAC capex compounding) — expect insurance premiums to compound above CPI over the hold.
Questions for the listing agent
- Is there a deadline driving the sale (1031 exchange, divorce, estate, relocation)? That informs how much negotiation room exists.
- Schools are D-rated, which usually means shorter tenancies and higher turnover. Who's the typical renter profile here, and what's been the actual vacancy rate?
- What's the average days-on-market for RENTAL listings here right now (not sales)? A rising rental-DOM trend means longer vacancies and softer asking-rent achievability than the comps imply.
- What's the recent tenant-quality profile in this submarket — average credit score on applications, eviction rate, late-payment / NSF rate, and stable-employment percentage? A property-management company in the area should have these aggregated.
- How much new for-sale + rental construction is in the pipeline within 1–3 miles? Heavy new supply typically softens prices + rents 12–24 months out; constrained supply supports both.
Investment metrics
- 1% rule
- 1.39% ✓
- Cap rate
- 12.35%
- Cash-on-cash
- 21.65%
- DSCR
- 1.96
- GRM
- 6.0
CMA / ARV
- ARV (on-the-fly)
- $146,625
- Comps found
- 8
Show comp detail 8 sales within ~0.75 mi
| Address | Dist | Beds/Ba | Sqft | Sold | Price | $/sf | Match |
|---|---|---|---|---|---|---|---|
| 309 Summer St | 0.06mi | 2/1.0 (-1) | 1,359 (+7%) | 6mo | $156,000 | $115 | 76 |
| 526 Fonville St | 0.31mi | 3/1.0 | 1,287 (+1%) | 16mo | $130,000 | $101 | 70 |
| 535 Fonville St | 0.37mi | 2/1.0 (-1) | 1,296 (+2%) | 13mo | $160,000 | $123 | 64 |
| 301 Fonville Ave | 0.11mi | 2/1.0 (-1) | 1,327 (+4%) | 23mo | $154,000 | $116 | 64 |
| 434 Parrish St | 0.38mi | 2/2.0 (-1) | 1,344 (+5%) | 10mo | $128,500 | $96 | 56 |
| 226 Marshall St | 0.43mi | 3/2.0 | 1,425 (+12%) | 2mo | $85,000 | $60 | 55 |
| 110 Carter St | 0.64mi | 3/2.0 | 1,168 (-8%) | 8mo | $100,000 | $86 | 46 |
| 120 Crestview St | 0.70mi | 2/1.0 (-1) | 1,121 (-12%) | 14mo | $147,000 | $131 | 31 |
Match score weights: distance 35% · size 25% · config 20% · recency 20%. Top-matched comps best support the ARV.
Projected returns pro-forma
-3.0% appreciation · 3.0% rent growth · sell at horizon
- IRR
- 14.2%
- Equity multiple
- 1.57×
- Total profit
- $15,912
- Equity at exit
- $14,895
- IRR
- 23.0%
- Equity multiple
- 2.97×
- Total profit
- $55,079
- Equity at exit
- $8,638
Cash invested: $27,972 (down + closing). Projections, not guarantees.
Landlord ↔ Tenant lean methodology
- Overall (STATE)
- 87 Strongly Landlord-Friendly
- State Tennessee
- 87 Strongly Landlord-Friendly · R+13
- County
- — inherits STATE
- City
- — inherits STATE
ZIP-level market 38237
- Home prices YoY
- -16.5%
- Active inventory
- 85
- Price-to-rent
- 6.0×
Monthly cashflow live
- Estimated rent
- $1,388 medium interval (Pro) →
- Mortgage (P&I)
- −$524
- Tax from tax record
- −$26 /mo · $313/yr
- Insurance
- −$42
- HOA
- −$0
- Vacancy / Maint / Mgmt
- −$291
- Net cashflow
- $505
Break-even live
UW: 25.0% down · 7.5% · 30yr · 1.5% tax · 5.0% vac · 8.0% maint · 8.0% mgmt
Financing live
Cash to close
- Down payment
- $24,975
- Closing costs
- $2,997
- Reserves months
- —
- Total cash needed
- —
Loan-product check · same deal, 3 products live
Conventional
25% down · 7.5% · 30yr
- Down + closing
- —
- Monthly P&I
- —
- Monthly cashflow
- —
- DSCR
- —
- Eligible?
- —
Personal DTI + credit; lowest rate.
DSCR
20% down · 8.5% · 30yr
- Down + closing
- —
- Monthly P&I
- —
- Monthly cashflow
- —
- DSCR
- —
- Eligible?
- —
No personal income docs; deal must DSCR.
Hard money
10% down · 12.0% · 12mo
- Down + closing
- —
- Monthly P&I
- —
- Monthly cashflow
- —
- DSCR
- —
- Eligible?
- —
Short-term bridge; refi at stabilization.
Listing history 5 events
-
2025-08-22status Pending
-
2025-07-28$99,900 Active
-
2024-07-08soldstatus Closed
-
2007-05-11soldstatus $46,600
-
2001-09-07soldstatus $44,000
ⓘ Source: listings_history table (triggers on properties + properties_extension) + one-shot
backfill from property_details.listing_events for pre-trigger history.
Tax reassessment forecast TN · Resets to sale price
- Current annual tax
- $313 · $26/mo
- Projected year-2 tax
- $709 · $59/mo
- Expected delta
- +$396/yr (+$33/mo · 126.6%)
ⓘ Screening estimate from a state-policy table — verify with the county assessor before closing.
Climate risk First Street
- Flood 1/10 Low FEMA zone X (unshaded) · 0% chance over 30 yrs
- Wildfire 1/10 Low
- Heat 6/10 Major 7 d/yr ≥108°F today · 21 d/yr by 30 yrs out
- Wind 4/10 Moderate 8% chance of damaging wind over 30 yrs
- Air quality 1/10 Low 0 unhealthy d/yr today · 0 by 30 yrs out
Nearby sold comps map
Loading sold comps map…
Walkable amenities ~0.75 mi
Loading nearby amenities…
Taxation est. · year 1
- Rental income
- $16,651
- − Mortgage interest
- −$5,596
- − Property taxes
- −$313
- − Insurance
- −$500
- − Repairs & maintenance
- −$1,332
- − Management
- −$1,332
- − Depreciation
- −$2,906
- Taxable income
- $4,673
- Est. tax owed @ 24.0%
- −$1,121
- After-tax cash flow
- $4,934/yr
For passive investors: Depreciation is non-cash, so a rental often shows a tax loss while cash-flowing — sheltering income. Rental losses are passive: they offset passive income freely, and up to $25,000/yr can offset ordinary (W-2) income if you actively participate and your MAGI is under $100k (phasing out to $0 by $150k); unused losses carry forward. On sale, claimed depreciation is recaptured at up to 25%, and gains may owe capital-gains tax (a 1031 exchange can defer both). Figures are a year-1 estimate at your 24.0% rate — not tax advice; consult a CPA.
Schools (NCES district)
- District
- Weakley County
- NCES district ID
- 4704470
- Math proficiency
- 34% ▼ -10.00%
- Reading proficiency
- 38% ▼ -2.00%
- Median HH income
- $35,389
- Composite
- 29.77/100
- National rank
- #6434
- State rank
- #32 of 139 in TN
Livability — Martin
- Score
- 75/100
- State rank
- #15
- US rank
- #4330
Category grades
Schools grade is shown separately in the Schools card above.
Census & demographics
- Census place
- Martin, TN
- County
- Weakley County · 15,627 people
- City population
- 15,627
- Metro
- Martin, TN
- Population (ZIP)
- 15,627
- Household income
- $51,670
- Rent vs Own
- Severe rent burden
- 636.0
Population outlook (Weakley County) Hauer SSP2
- Today (2025)
- 31,862 people
- By 2030
- 30,688 · -3.7%
- By 2040
- 27,935 · -12.3%
- By 2050
- 25,485 · -20.0%
- By 2075
- 21,080 · -33.8%
- By 2100
- 18,214 · -42.8%
Race, ethnicity, and origin ACS 2023
- Neighborhood character
- Predominantly White (77%)
- Race & ethnicity
- White 77% Black 13% Two or more races 5% Hispanic / Latino 4% Asian 2%
- Common ancestry
- Slovak 2% Italian 1% Serbian 1%
- Foreign-born
- 4% · Canada, Vietnam, South Korea
- Languages at home
- 95% English-only · Spanish 2% Vietnamese 1% Other Indo-European 1%
Political lean MEDSL · Weakley
- 2024 margin
- Solid R (+58.4) · D 20.3% · R 78.7%
- 2008→2024 swing
- -27.2pp toward R · 2008: -31.1pp · 2024: -58.4pp
- All cycles
- 2024: R+58.4 2020: R+53.7 2016: R+51.4 2012: R+41.0 2008: R+31.1
Not yet ingested
- Civics
- —
Market trends
- HPI YoY
- ▼ -46.05%
- Current HPI
- 233.76
- Rent YoY
- —
- Metro
- Martin, TN
- State GDP YoY
- ▲ 2.78%
- F500 in state
- 22
Industry mix (Fortune 500 HQ in TN)
| Industry | F500 HQs | Revenue |
|---|---|---|
| Healthcare | 3 | $91B |
|
||
| Retail | 3 | $72B |
|
||
| Transportation / Logistics | 1 | $88B |
|
||
| Paper / Packaging | 1 | $19B |
|
||
| Insurance | 1 | $13B |
|
||
| Energy | 1 | $12B |
|
||
Price history
+127.0% since first listed5 events — show timeline
- 2025-08-22 Pending — RRAR as distributed by MLS GRID
- 2025-07-28 Listed $99,900 RRAR as distributed by MLS GRID
- 2024-07-08 Sold (MLS) — RRAR as distributed by MLS GRID
- 2007-05-11 Sold (Public Records) $46,600 Public Records
- 2001-09-07 Sold (Public Records) $44,000 Public Records
Property tax history
+1.4%/yrLatest (2025): $313 · +9.1% YoY. Source: county tax records.
Cash-flow waterfall
monthlySold comps — $/sqft
last 12 mo · ≤1 miLoading sold comps…