8126 Bosco St Plan · Conroe, TX
Flood risk No data
- FEMA flood zone
- —
- Chance of flooding over 30 yrs
- —
- Est. flood insurance / yr
- —
Fire risk No data
- Est. fire insurance / yr
- —
Heat risk No data
- Hot days now (above threshold)
- —
- Hot days in 30 yrs
- —
Wind risk No data
- Chance of severe wind over 30 yrs
- —
Air-quality risk No data
- Unhealthy air days now
- —
- Unhealthy air days in 30 yrs
- —
Risk factors via First Street. Map © Google.
Why this score? — see what drove the B+ grade
The composite is a weighted blend of 9 inputs, each scored 0–100. Each bar is that input's sub-score; the figure is the points it added to the 100-point composite (weight × sub-score).
- Cash flow +29.9/30.0
- ARV discount +15.0/15.0
- DSCR +10.0/10.0
- 1% rule +8.4/10.0
- Schools +5.1/10.0
- Condition / age +4.8/5.0
- Livability +3.7/5.0
- Rent growth +2.4/5.0
- Appreciation +0.0/10.0
$154,995
🖨 Deal sheet (PDF) 📄 Offer letter ✓ Due diligence
Listing remarks MLS
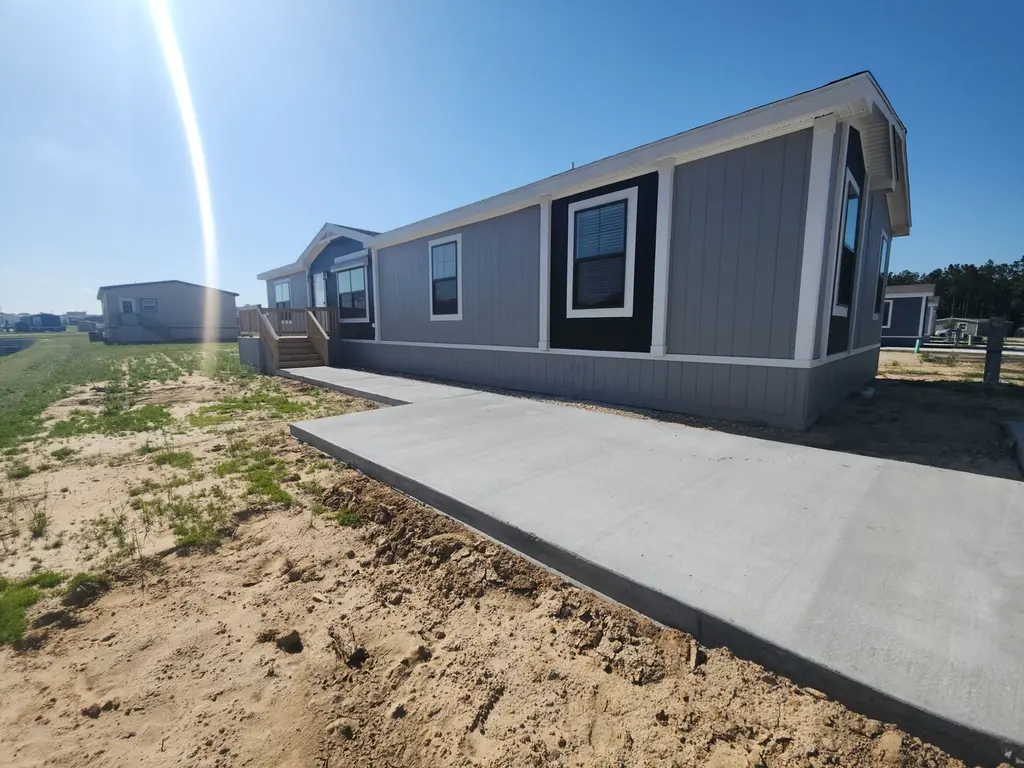
Step into this beautifully designed 4-bedroom, 2-bath modern farmhouse, where warmth and natural light create an inviting atmosphere. The open-concept layout enhances the home s spacious feel, with large windows that fill each room with brightness. Thoughtfully selected warm finishes, including rich wood accents and soft neutral tones, add charm and character. The gourmet kitchen features premium appliances, a generous island, and stylish cabinetry, perfect for cooking and entertaining.
Key facts
- Listed 451 days
Neighborhood map
What this means for you Summary
Snapshot
- This is a 4-bed/3.0-bath manufactured listed at $155k. Condition is rated excellent.
Deal economics
- At list price, monthly cash flow is $573 ($7k/yr) — positive.
- The deal already cash-flows at list — no discount required.
- Meets the 1% rule at list price ($2k rent vs $155k).
- Recommended offer: $136k (12.0% below list) — sets the bar for market timing.
- Cap rate 10.7% vs local median 3.1% in Conroe — top-decile yield for the area; either an underpriced asset or a hidden risk that comps aren't pricing in. Stress-test before assuming the spread holds.
Location & tenants
- Location reads 74/100 on livability (#169 in TX, #4,447 nationally) — a middle-class / working-renter tenant base. Strengths: cost of living A+, housing A+, amenities B; Watch: schools D+, commute F, health & safety F.
- Conroe ISD (other): math 57% / reading 57% proficiency, ranked #69 of 826 in TX (top 8%) — acceptable for families but not a draw, mixed tenant base, ~2y average lease.
- Market conditions: Rents soft (-0.3%/yr); 721 active listings in the ZIP; 4 comparable units currently listed for rent nearby; rentals at typical pace (median 18d on market — plan ~3-4 weeks tenant-placement turnaround); solid renter incomes; 13,259 units permitted in Montgomery County in 2024 (1,402 in 5+ unit buildings).
- This rent runs 33% of the median local income ($75k/yr) — at the standard rent-burdened threshold; future hikes will face affordability resistance.
Forward outlook
- Local home prices are declining (-3.0%/yr); year-one equity from $1k of loan paydown is wiped out by about $5k of value loss. Plan a longer hold.
- Montgomery County population projected at +65% by 2050 — long-run rental-demand tailwind backs the buy-and-hold thesis.
Negotiation context
- It's been on market 451 days — a 12% lower offer ($136k) is reasonable based on typical stale-listing flexibility.
Questions for the listing agent
- It's been on market 451 days. Have you received any prior offers? Is the seller open to a 12% concession, seller financing, or rate buy-down credit?
- Why hasn't it sold? Are there any deal-killer items the seller is aware of (foundation, flood, title, zoning, code violations)?
- Is there a deadline driving the sale (1031 exchange, divorce, estate, relocation)? That informs how much negotiation room exists.
- Schools are D-rated, which usually means shorter tenancies and higher turnover. Who's the typical renter profile here, and what's been the actual vacancy rate?
- What's the average days-on-market for RENTAL listings here right now (not sales)? A rising rental-DOM trend means longer vacancies and softer asking-rent achievability than the comps imply.
- What's the recent tenant-quality profile in this submarket — average credit score on applications, eviction rate, late-payment / NSF rate, and stable-employment percentage? A property-management company in the area should have these aggregated.
- How much new for-sale + rental construction is in the pipeline within 1–3 miles? Heavy new supply typically softens prices + rents 12–24 months out; constrained supply supports both.
Investment metrics
- 1% rule
- 1.34% ✓
- Cap rate
- 10.73%
- Cash-on-cash
- 15.83%
- DSCR
- 1.70
- GRM
- 6.2
CMA / ARV
- ARV (median comp)
- $223,098
- List price
- $154,995
- Delta
- -30.53%
- Verdict
- UNDERPRICED
- Comps
- 4 within 2.0 mi
Projected returns pro-forma
-3.0% appreciation · 0.0% rent growth · sell at horizon
- IRR
- 3.3%
- Equity multiple
- 1.12×
- Total profit
- $5,292
- Equity at exit
- $23,110
- IRR
- 9.7%
- Equity multiple
- 1.65×
- Total profit
- $28,136
- Equity at exit
- $13,401
Cash invested: $43,399 (down + closing). Projections, not guarantees.
Landlord ↔ Tenant lean methodology
- Overall (STATE)
- 87 Strongly Landlord-Friendly
- State Texas
- 87 Strongly Landlord-Friendly · R+5
- County
- — inherits STATE
- City
- — inherits STATE
ZIP-level market 77303
- Home prices YoY
- -22.4%
- Rents YoY
- -0.3%
- Active inventory
- 721
- Price-to-rent
- 6.2×
Monthly cashflow live
- Estimated rent
- $2,081 medium interval (Pro) →
- Mortgage (P&I)
- −$813
- Tax est. 1.5%
- −$194 /mo · $2,325/yr
- Insurance
- −$65
- HOA
- −$0
- Vacancy / Maint / Mgmt
- −$437
- Net cashflow
- $573
Break-even live
Sensitivity live
| Price | -10% $680 | -5% $626 | +0% $573 | +5% $519 | +10% $466 |
|---|---|---|---|---|---|
| Rent | -10% $408 | -5% $490 | +0% $573 | +5% $655 | +10% $737 |
| Rate | -1.0pp $651 | -0.5pp $612 | base $573 | +0.5pp $533 | +1.0pp $492 |
UW: 25.0% down · 7.5% · 30yr · 1.5% tax · 5.0% vac · 8.0% maint · 8.0% mgmt
Financing live
Cash to close
- Down payment
- $38,749
- Closing costs
- $4,650
- Reserves months
- —
- Total cash needed
- —
Loan-product check · same deal, 3 products live
Conventional
25% down · 7.5% · 30yr
- Down + closing
- —
- Monthly P&I
- —
- Monthly cashflow
- —
- DSCR
- —
- Eligible?
- —
Personal DTI + credit; lowest rate.
DSCR
20% down · 8.5% · 30yr
- Down + closing
- —
- Monthly P&I
- —
- Monthly cashflow
- —
- DSCR
- —
- Eligible?
- —
No personal income docs; deal must DSCR.
Hard money
10% down · 12.0% · 12mo
- Down + closing
- —
- Monthly P&I
- —
- Monthly cashflow
- —
- DSCR
- —
- Eligible?
- —
Short-term bridge; refi at stabilization.
Rent comps 4 comps
| Address | Beds | Baths | Sqft | Rent | $/sqft | DOM | Units | Dist |
|---|---|---|---|---|---|---|---|---|
| 11085 Pine Acre Trails Blvd Conroe, TX | 2.0–4.0 | 2.0 | 1458 | $1,799 | $1.23 | 5d | 1 | 0.03mi |
| 10594 Rustling Oaks Dr Conroe, TX | 4.0 | 3.0 | 2560 | $2,350 | $0.92 | 44d | 1 | 0.15mi |
| 10726 Sunlit St Conroe, TX | 3.0 | 2.0 | 1400 | $1,100 | $0.79 | 18d | 1 | 0.39mi |
| 10005 Sterling Place Dr Conroe, TX | 5.0 | 2.5 | 2305 | $2,250 | $0.98 | 3d | 1 | 1.06mi |
Listing history 15 events
-
2026-06-21days on market $154,995 Active 451 DOM
-
2026-06-18days on market $154,995 Active 448 DOM
-
2026-06-17days on market $154,995 Active 447 DOM
-
2026-06-16days on market $154,995 Active 446 DOM
-
2026-06-15days on market $154,995 Active 445 DOM
-
2026-06-13days on market $154,995 Active 443 DOM
-
2026-06-09days on market $154,995 Active 439 DOM
-
2026-06-08days on market $154,995 Active 438 DOM
-
2026-06-07days on market $154,995 Active 437 DOM
-
2026-06-04days on market $154,995 Active 434 DOM
-
2026-06-03days on market $154,995 Active 433 DOM
-
2026-06-02days on market $154,995 Active 432 DOM
-
2026-06-01days on market $154,995 Active 431 DOM
-
2026-05-31days on market $154,995 Active 430 DOM
-
2025-03-27$154,995 Active 491-char remark
Show marketing remark (491 chars)
Step into this beautifully designed 4-bedroom, 2-bath modern farmhouse, where warmth and natural light create an inviting atmosphere. The open-concept layout enhances the home s spacious feel, with large windows that fill each room with brightness. Thoughtfully selected warm finishes, including rich wood accents and soft neutral tones, add charm and character. The gourmet kitchen features premium appliances, a generous island, and stylish cabinetry, perfect for cooking and entertaining.
ⓘ Source: listings_history table (triggers on properties + properties_extension) + one-shot
backfill from property_details.listing_events for pre-trigger history.
Nearby sold comps map
Loading sold comps map…
Walkable amenities ~0.75 mi
Loading nearby amenities…
Taxation est. · year 1
- Rental income
- $24,969
- − Mortgage interest
- −$8,682
- − Property taxes
- −$2,325
- − Insurance
- −$775
- − Repairs & maintenance
- −$1,998
- − Management
- −$1,998
- − Depreciation
- −$4,509
- Taxable income
- $4,683
- Est. tax owed @ 24.0%
- −$1,124
- After-tax cash flow
- $5,748/yr
For passive investors: Depreciation is non-cash, so a rental often shows a tax loss while cash-flowing — sheltering income. Rental losses are passive: they offset passive income freely, and up to $25,000/yr can offset ordinary (W-2) income if you actively participate and your MAGI is under $100k (phasing out to $0 by $150k); unused losses carry forward. On sale, claimed depreciation is recaptured at up to 25%, and gains may owe capital-gains tax (a 1031 exchange can defer both). Figures are a year-1 estimate at your 24.0% rate — not tax advice; consult a CPA.
Condition & rehab AI · 11 photos
This modern manufactured home is in excellent condition with a well-designed interior and exterior. It is move-in ready and has the potential for further value increases through minor landscaping and smart home upgrades.
Value-add opportunities
- Both Landscaping and curb appeal improvements — Enhances the home's curb appeal and can attract more buyers.
- Both Add a small front porch or patio — Can increase the home's appeal and functionality for both buyers and renters.
- Both Install smart home features — Can increase the home's value by making it more energy-efficient and convenient for potential buyers and renters.
Renovation cost estimate screening
Value-add ROI direction
- Both Landscaping and curb appeal improvements — Enhances the home's curb appeal and can attract more buyers. ↑
- Both Add a small front porch or patio — Can increase the home's appeal and functionality for both buyers and renters. ↑
- Both Install smart home features — Can increase the home's value by making it more energy-efficient and convenient for potential buyers and renters. ↑
ⓘ Cost ranges are severity-bucket heuristics (US national rule-of-thumb). Get contractor quotes + a written scope before underwriting a rehab budget.
Schools (NCES district)
- District
- Conroe ISD
- NCES district ID
- 4815000
- Math proficiency
- 57% ▼ -6.00%
- Reading proficiency
- 57% ▼ -1.00%
- Median HH income
- $71,541
- Composite
- 50.65/100
- National rank
- #1833
- State rank
- #69 of 826 in TX
Livability — Conroe
- Score
- 74/100
- State rank
- #169
- US rank
- #4447
Category grades
Schools grade is shown separately in the Schools card above.
Census & demographics
- County
- Montgomery County · 663,713 people
- City population
- 205,417
- Metro
- Houston-The Woodlands-Sugar Land, TX
- Population (ZIP)
- 28,854
- Household income
- $75,348
- Rent vs Own
- Severe rent burden
- 464.0
Population outlook (Montgomery County) Hauer SSP2
- Today (2025)
- 713,896 people
- By 2030
- 805,263 · +12.8%
- By 2040
- 992,708 · +39.1%
- By 2050
- 1,179,590 · +65.2%
- By 2075
- 1,628,084 · +128.1%
- By 2100
- 1,937,880 · +171.5%
Race, ethnicity, and origin ACS 2023
- Neighborhood character
- Diverse neighborhood (Simpson 0.56)
- Race & ethnicity
- White 54% Hispanic / Latino 38% Two or more races 17% Black 4%
- Hispanic origin (detail)
- Mexican 25%
- Common ancestry
- Lithuanian 1% Romanian 1% Slovak 1%
- Foreign-born
- 13% · Canada, Jamaica
- Languages at home
- 69% English-only · Spanish 31%
Political lean MEDSL · Montgomery
- 2024 margin
- Solid R (+45.5) · D 26.8% · R 72.3%
- 2008→2024 swing
- +7.2pp toward D · 2008: -52.7pp · 2024: -45.5pp
- All cycles
- 2024: R+45.5 2020: R+43.8 2016: R+51.4 2012: R+60.7 2008: R+52.7
Not yet ingested
- Civics
- —
Market trends
- HPI YoY
- ▼ -77.71%
- Current HPI
- 269.5367
- Rent YoY
- ▼ -0.31%
- Metro
- Houston-The Woodlands-Sugar Land, TX
- State GDP YoY
- ▲ 3.95%
- F500 in state
- 110
Industry mix (Fortune 500 HQ in TX)
| Industry | F500 HQs | Revenue |
|---|---|---|
| Energy | 16 | $1,198B |
|
||
| Technology | 5 | $198B |
|
||
| Engineering / Construction | 4 | $72B |
|
||
| Energy Services | 3 | $60B |
|
||
| Utilities | 3 | $41B |
|
||
| Healthcare | 2 | $330B |
|
||
Price history
1 event — show timeline
- 2025-03-27 Listed $154,995 Zillow
Cash-flow waterfall
monthlySold comps — $/sqft
last 12 mo · ≤1 miLoading sold comps…