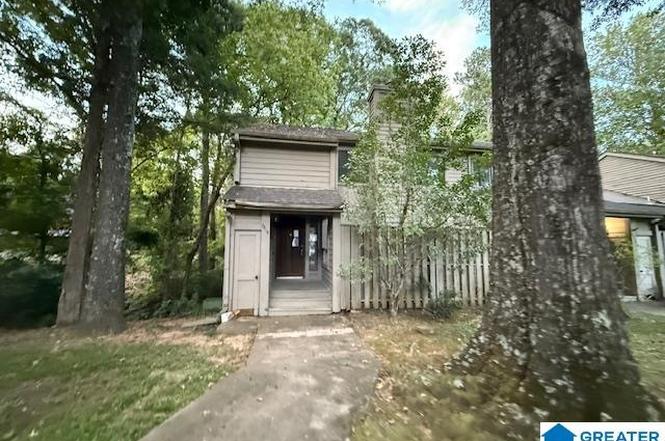
3810 Windhover Cir #1 · Hoover, AL
Flood risk 1/10 · Minimal
- FEMA flood zone
- X (unshaded)
- Chance of flooding over 30 yrs
- 0.0%
- Est. flood insurance / yr
- $507 – $1,088
Fire risk 1/10 · Minimal
- Est. fire insurance / yr
- $916 – $1,700
Heat risk 7/10 · Major
- Hot days now (above 107°F)
- 7 days/yr
- Hot days in 30 yrs
- 19 days/yr
Wind risk 6/10 · Moderate
- Chance of severe wind over 30 yrs
- 27.0%
Air-quality risk 4/10 · Minor
- Unhealthy air days now
- 6 days/yr
- Unhealthy air days in 30 yrs
- 6 days/yr
Risk factors via First Street. Map © Google.
Why this score? — see what drove the B- grade
The composite is a weighted blend of 9 inputs, each scored 0–100. Each bar is that input's sub-score; the figure is the points it added to the 100-point composite (weight × sub-score).
- Cash flow +30.0/30.0
- 1% rule +10.0/10.0
- DSCR +10.0/10.0
- ARV discount +7.5/15.0
- Livability +4.2/5.0
- Rent growth +3.1/5.0
- Condition / age +2.5/5.0
- Schools +1.8/10.0
- Appreciation +0.0/10.0
$57,500
🖨 Deal sheet 📄 Offer letter ✓ Due diligence
Listing remarks
Welcome to Windhover Condominium! This 3-bedroom, 2.5-bath condo is full of potential and ready for your personal touch. The spacious living room features high ceilings, a cozy fireplace, and access to a private patio. The galley kitchen offers plenty of cabinet space and natural light. Enjoy the convenience of assigned parking, plus community perks like an in-ground pool. Whether you're looking to invest or settle into your own space, this condo is a great opportunity in a convenient location close to shopping, dining, and major roads.
Key facts
- In-ground pool
- Community perks
- Private patio
Tags
Neighborhood map
What this means for you Summary
Snapshot
- This is a 3-bed/2.5-bath condo listed at $58k.
Deal economics
- At list price, monthly cash flow is $1k ($16k/yr) — positive.
- The deal already cash-flows at list — no discount required.
- Meets the 1% rule at list price ($2k rent vs $58k).
- Recommended offer: $51k (12.0% below list) — sets the bar for market timing.
- Cap rate 33.6% vs local median 2.4% in Hoover — top-decile yield for the area; either an underpriced asset or a hidden risk that comps aren't pricing in. Stress-test before assuming the spread holds.
Location & tenants
- Location reads 84/100 on livability (#1 in AL, #630 nationally) — a professional / high-income tenant draw. Strengths: crime A+, employment A+, housing A+.
- Jefferson County (suburban): math 9% / reading 32% proficiency, ranked #104 of 129 in AL (top 81%) — low school quality limits family demand, transient renter base, plan for 1-2y turnover.
- Zoned schools: Shades Valley High School (math 29% / reading 39%, grade F, #53 of 305 statewide, top 18%, 1,200 students, 68% FRL) — zoned schools average 68% FRL vs 49% district-wide (19 pts higher); higher-poverty schools than district average — tighter screening recommended.
- Zoned-school proficiency averages 34% at this address vs 20% district-wide (+14 pts) — the actual schools serving this property are materially stronger than the Jefferson County average implies; a family-tenant draw the district grade alone would hide.
- Market conditions: Rents rising (+2.6%/yr); 135 active listings in the ZIP; 25 comparable units currently listed for rent nearby; rentals leasing fast (median 3d on market — plan ~1-2 weeks tenant-placement turnaround); 2,114 units permitted in Jefferson County in 2024 (556 in 5+ unit buildings).
Forward outlook
- Local home prices are declining (-3.0%/yr); year-one equity from $398 of loan paydown is wiped out by about $2k of value loss. Plan a longer hold.
- Jefferson County population projected to shrink 4% by 2050 — rents likely to lag national; underwrite the cash flow, not the appreciation.
- At projected returns (-3.0% appreciation + 2.6% rent growth), your $16k cash investment doubles in ~2 years — after that, you're playing with house money.
Negotiation context
- It's been on market 163 days — a 12% lower offer ($51k) is reasonable based on typical stale-listing flexibility.
- 5 sale attempts; this cycle's ask has dropped $30k (34%) from the opening price — seller is motivated, your offer sets the floor, not the list.
Risks & watch-outs
- Watch-outs: property tax is 2.5% of price.
- Climate carrying-cost: major wind risk, 27% chance of damaging wind over 30y; extreme-heat days projected 7→19/yr by 2055 (HVAC capex compounding) — expect insurance premiums to compound above CPI over the hold.
Questions for the listing agent
- It's been on market 163 days. Have you received any prior offers? Is the seller open to a 12% concession, seller financing, or rate buy-down credit?
- Built in 1975 — when were the roof, HVAC, electrical panel, plumbing, and water heater last replaced?
- Property tax is high relative to price — has the assessment been appealed recently, and will the sale trigger a re-assessment?
- Any open or pending special assessments — roof, HVAC, plumbing, elevator, façade? What's the per-unit balance and payoff schedule, and is the seller paying it off at close or rolling it to the buyer?
- Why hasn't it sold? Are there any deal-killer items the seller is aware of (foundation, flood, title, zoning, code violations)?
- Is there a deadline driving the sale (1031 exchange, divorce, estate, relocation)? That informs how much negotiation room exists.
- Schools are A-rated — typically a magnet for longer-tenancy family renters. What's the average tenant stay here, and is there a school-zone premium baked into asking?
- What's the average days-on-market for RENTAL listings here right now (not sales)? A rising rental-DOM trend means longer vacancies and softer asking-rent achievability than the comps imply.
- What's the recent tenant-quality profile in this submarket — average credit score on applications, eviction rate, late-payment / NSF rate, and stable-employment percentage? A property-management company in the area should have these aggregated.
- How much new apartment / multifamily construction is in the pipeline within 1–3 miles? Heavy new supply (>2% of stock underway) typically softens rents 12–24 months out; light construction supports rent growth.
Investment metrics
- 1% rule
- 3.87% ✓
- Cap rate
- 33.61%
- Cash-on-cash
- 97.58%
- DSCR
- 5.34
- GRM
- 2.2
CMA / ARV
No comps found within radius.
Projected returns pro-forma
-3.0% appreciation · 2.59% rent growth · sell at horizon
- IRR
- 98.1%
- Equity multiple
- 5.55×
- Total profit
- $73,215
- Equity at exit
- $8,573
- IRR
- —
- Equity multiple
- 11.41×
- Total profit
- $167,666
- Equity at exit
- $4,972
Cash invested: $16,100 (down + closing). Projections, not guarantees.
Landlord ↔ Tenant lean methodology
- Overall (STATE)
- 90 Strongly Landlord-Friendly
- State Alabama
- 90 Strongly Landlord-Friendly · R+15
- County
- — inherits STATE
- City
- — inherits STATE
ZIP-level market 35216
- Rents YoY
- 2.6%
- Active inventory
- 135
- Price-to-rent
- 2.2×
Monthly cashflow live
- Estimated rent
- $2,223 high interval (Pro) →
- Mortgage (P&I)
- −$302
- Tax from tax record
- −$122 /mo · $1,461/yr
- Insurance
- −$24
- HOA
- −$0
- Vacancy / Maint / Mgmt
- −$467
- Net cashflow
- $1,309
Break-even live
UW: 25.0% down · 7.5% · 30yr · 1.5% tax · 5.0% vac · 8.0% maint · 8.0% mgmt
Financing live
Cash to close
- Down payment
- $14,375
- Closing costs
- $1,725
- Reserves months
- —
- Total cash needed
- —
Loan-product check · same deal, 3 products live
Conventional
25% down · 7.5% · 30yr
- Down + closing
- —
- Monthly P&I
- —
- Monthly cashflow
- —
- DSCR
- —
- Eligible?
- —
Personal DTI + credit; lowest rate.
DSCR
20% down · 8.5% · 30yr
- Down + closing
- —
- Monthly P&I
- —
- Monthly cashflow
- —
- DSCR
- —
- Eligible?
- —
No personal income docs; deal must DSCR.
Hard money
10% down · 12.0% · 12mo
- Down + closing
- —
- Monthly P&I
- —
- Monthly cashflow
- —
- DSCR
- —
- Eligible?
- —
Short-term bridge; refi at stabilization.
Rent comps 25 comps
| Address | Beds | Baths | Sqft | Rent | $/sqft | DOM | Units | Dist |
|---|---|---|---|---|---|---|---|---|
| 4012 Lennox Rd Vestavia Hills, AL | 3.0 | 2.5 | 1674 | $2,765 | $1.65 | 44d | 1 | 0.08mi |
| 4020 Lennox Rd Vestavia Hills, AL | 3.0 | 2.5 | 1674 | $2,665 | $1.59 | 44d | 1 | 0.09mi |
| 2512 Christie Cir Vestavia Hills, AL | 3.0 | 2.0 | 1951 | $2,800 | $1.44 | 44d | 1 | 0.10mi |
| 4429 Lennox Pl Unit 4415 Birmingham, AL | 3.0 | 3.0 | 1645 | $2,450 | $1.49 | 19d | 1 | 0.18mi |
| 4429 Lennox Pl Unit 12 65 Birmingham, AL | 3.0 | 3.0 | 1645 | $2,450 | $1.49 | 10d | 1 | 0.18mi |
| 4429 Lennox Pl Unit 4429 Birmingham, AL | 3.0 | 3.0 | 1645 | $2,450 | $1.49 | 2d | 1 | 0.18mi |
| 3744 Spearman Dr Hoover, AL | 3.0 | 2.0 | 1668 | $1,850 | $1.11 | 44d | 1 | 0.21mi |
| 3709 Stone Ridge Ter Hoover, AL | 2.0 | 2.0 | 1535 | $1,750 | $1.14 | 2d | 1 | 0.54mi |
| 3741 Chestnut Ridge Ln Vestavia Hills, AL | 1.0–3.0 | 1.0–2.0 | 1450 | $1,450 | $1.00 | 2d | 61 | 0.58mi |
| 3400 Chestnut Ridge Ln Birmingham, AL | 2.0–3.0 | 2.0 | 1263 | $1,675 | $1.33 | 2d | 8 | 0.62mi |
| 3411 Cedar Crest Cir Hoover, AL | 3.0 | 2.5 | 1336 | $2,150 | $1.61 | 2d | 1 | 0.64mi |
| 2149 Emerald Pointe Dr Birmingham, AL | 1.0–3.0 | 1.0–1.5 | 885 | $1,249 | $1.41 | 24d | 1 | 0.64mi |
| 4248 Ashwood Cv Vestavia Hills, AL | 3.0 | 2.5 | 1428 | $1,850 | $1.30 | 3d | 1 | 0.72mi |
| 601 Wildbrook Ln Hoover, AL | 1.0–3.0 | 1.0–2.0 | 1340 | $1,400 | $1.04 | 2d | 4 | 0.77mi |
| 3454 Heather Ln Hoover, AL | 4.0 | 3.0 | 2176 | $2,600 | $1.19 | 21d | 1 | 0.79mi |
| 1443 River Walk Cir Vestavia Hills, AL | 3.0 | 2.5 | 1654 | $1,895 | $1.15 | 3d | 1 | 0.84mi |
| 6100 Rime Village Dr E Vestavia Hills, AL | 1.0–2.0 | 1.5–2.0 | 1307 | $1,446 | $1.11 | 2d | 10 | 0.88mi |
| 2139 Rocky Ridge Ranch Rd Hoover, AL | 1.0–3.0 | 1.0–2.0 | 1044 | $1,489 | $1.43 | 2d | 4 | 0.94mi |
| 3627 Cedarbrook Dr Hoover, AL | 1.0–2.0 | 1.0–2.0 | 894 | $1,070 | $1.20 | 19d | 1 | 1.06mi |
| 990 Wisteria Pl Birmingham, AL | 3.0 | 2.0 | 1450 | $1,620 | $1.12 | 2d | 3 | 1.08mi |
| 3565 Lorna Rd Hoover, AL | 1.0–3.0 | 1.0–1.5 | 975 | $1,100 | $1.13 | 44d | 1 | 1.10mi |
| 2135 Centennial Dr Birmingham, AL | 3.0 | 1.0–2.0 | 955 | $1,250 | $1.31 | 2d | 21 | 1.17mi |
| 2071 Alpine Vlg Birmingham, AL | 1.0–3.0 | 1.0–2.0 | 1000 | $1,195 | $1.20 | 3d | 9 | 1.25mi |
| 3400 Treeline Ct Hoover, AL | 1.0–3.0 | 1.0–2.0 | 950 | $1,320 | $1.39 | 21d | 13 | 1.30mi |
| 200 River Haven Ln Hoover, AL | 1.0–3.0 | 1.5–2.5 | 1485 | $1,802 | $1.21 | 2d | 32 | 1.37mi |
HOA detail condo
- Monthly dues
- $0 · $0/yr
- Likely covers
- poolparking
- Assessments
- None detected in remarks — confirm with the listing agent.
Listing history 22 events
-
2026-04-17status Pending
-
2026-04-08price $57,500
-
2026-04-07historical Contingent
-
2026-04-07status Active
-
2026-03-19status Pending
-
2026-02-24historical Contingent
-
2026-02-14price $62,500
-
2026-02-13status Active
-
2026-01-27price $67,500
-
2026-01-27historical Contingent
-
2026-01-16price $75,500
-
2025-12-20price $82,500
-
2025-12-19status Active
-
2025-12-02status Pending
-
2025-10-21historical Contingent
-
2025-10-01status Active
-
2025-09-12historical
-
2025-09-09$87,450 Active
-
2022-03-15soldstatus $144,001
-
2003-05-21soldstatus $95,000
-
1996-05-29soldstatus $79,500
-
1983-09-19soldstatus $70,541
ⓘ Source: listings_history table (triggers on properties + properties_extension) + one-shot
backfill from property_details.listing_events for pre-trigger history.
Tax reassessment forecast AL · Resets to sale price
- Current annual tax
- $1,461 · $122/mo
- Projected year-2 tax
- $1,461 · $122/mo
- Expected delta
- $0/yr ($0/mo · 0.0%)
ⓘ Screening estimate from a state-policy table — verify with the county assessor before closing.
Climate risk First Street
- Flood 1/10 Low FEMA zone X (unshaded) · 0% chance over 30 yrs
- Wildfire 1/10 Low
- Heat 7/10 Severe 7 d/yr ≥107°F today · 19 d/yr by 30 yrs out
- Wind 6/10 Major 27% chance of damaging wind over 30 yrs
- Air quality 4/10 Moderate 6 unhealthy d/yr today · 6 by 30 yrs out
Nearby sold comps map
Loading sold comps map…
Walkable amenities ~0.75 mi
Loading nearby amenities…
Taxation est. · year 1
- Rental income
- $26,680
- − Mortgage interest
- −$3,221
- − Property taxes
- −$1,461
- − Insurance
- −$288
- − Repairs & maintenance
- −$2,134
- − Management
- −$2,134
- − Depreciation
- −$1,673
- Taxable income
- $15,769
- Est. tax owed @ 24.0%
- −$3,785
- After-tax cash flow
- $11,926/yr
For passive investors: Depreciation is non-cash, so a rental often shows a tax loss while cash-flowing — sheltering income. Rental losses are passive: they offset passive income freely, and up to $25,000/yr can offset ordinary (W-2) income if you actively participate and your MAGI is under $100k (phasing out to $0 by $150k); unused losses carry forward. On sale, claimed depreciation is recaptured at up to 25%, and gains may owe capital-gains tax (a 1031 exchange can defer both). Figures are a year-1 estimate at your 24.0% rate — not tax advice; consult a CPA.
Schools (NCES district)
- District
- Jefferson County
- NCES district ID
- 0101920
- Math proficiency
- 9% ▼ -24.00%
- Reading proficiency
- 32% ▼ -5.00%
- Median HH income
- $51,712
- Composite
- 18.4/100
- National rank
- #8937
- State rank
- #104 of 129 in AL
Livability — Hoover
- Score
- 84/100
- State rank
- #1
- US rank
- #630
Category grades
Schools grade is shown separately in the Schools card above.
Census & demographics
- County
- Jefferson County · 527,445 people
- City population
- 76,805
- Metro
- Birmingham-Hoover, AL
- Population (ZIP)
- 34,327
- Household income
- $74,525
- Rent vs Own
- Severe rent burden
- 1747.0
Population outlook (Jefferson County) Hauer SSP2
- Today (2025)
- 669,185 people
- By 2030
- 669,694 · +0.1%
- By 2040
- 661,388 · -1.2%
- By 2050
- 643,086 · -3.9%
- By 2075
- 577,267 · -13.7%
- By 2100
- 474,758 · -29.1%
Race, ethnicity, and origin ACS 2023
- Neighborhood character
- Diverse neighborhood (Simpson 0.56)
- Race & ethnicity
- White 61% Black 24% Hispanic / Latino 8% Asian 5% Two or more races 4% Native American 1%
- Hispanic origin (detail)
- Mexican 4%
- Common ancestry
- Slovak 3% Serbian 2% Italian 2%
- Foreign-born
- 8% · Canada, China, South Korea
- Languages at home
- 88% English-only · Spanish 6% Other Indo-European 2% Arabic 1%
Political lean MEDSL · Jefferson
- 2024 margin
- D (+10.4) · D 54.6% · R 44.2% · Other 1.2%
- 2008→2024 swing
- +5.4pp toward D · 2008: 5.1pp · 2024: 10.4pp
- All cycles
- 2024: D+10.4 2020: D+13.2 2016: D+7.2 2012: D+6.0 2008: D+5.1
Not yet ingested
- Civics
- —
Market trends
- HPI YoY
- ▼ -259.83%
- Current HPI
- 239.8705
- Rent YoY
- ▲ 2.59%
- Metro
- Birmingham-Hoover, AL
- State GDP YoY
- ▲ 2.94%
- F500 in state
- 4
Industry mix (Fortune 500 HQ in AL)
| Industry | F500 HQs | Revenue |
|---|---|---|
| Financial Services | 1 | $8B |
|
||
| Healthcare | 1 | $5B |
|
||
Price history
-18.5% since first listed22 events — show timeline
- 2026-04-17 Pending — Greater Alabama MLS
- 2026-04-08 Price Changed $57,500 Greater Alabama MLS
- 2026-04-07 Contingent — Greater Alabama MLS
- 2026-04-07 Relisted — Greater Alabama MLS
- 2026-03-19 Pending — Greater Alabama MLS
- 2026-02-24 Contingent — Greater Alabama MLS
- 2026-02-14 Price Changed $62,500 Greater Alabama MLS
- 2026-02-13 Relisted — Greater Alabama MLS
- 2026-01-27 Price Changed $67,500 Greater Alabama MLS
- 2026-01-27 Contingent — Greater Alabama MLS
- 2026-01-16 Price Changed $75,500 Greater Alabama MLS
- 2025-12-20 Price Changed $82,500 Greater Alabama MLS
- 2025-12-19 Relisted — Greater Alabama MLS
- 2025-12-02 Pending — Greater Alabama MLS
- 2025-10-21 Contingent — Greater Alabama MLS
- 2025-10-01 Relisted — Greater Alabama MLS
- 2025-09-12 Delisted — Greater Alabama MLS
- 2025-09-09 Listed $87,450 Greater Alabama MLS
- 2022-03-15 Sold (Public Records) $144,001 Public Records
- 2003-05-21 Sold (Public Records) $95,000 Public Records
- 1996-05-29 Sold (Public Records) $79,500 Public Records
- 1983-09-19 Sold (Public Records) $70,541 Public Records
Property tax history
+3.5%/yrLatest (2025): $1,461 · +0.0% YoY. Source: county tax records.
Cash-flow waterfall
monthlySold comps — $/sqft
last 12 mo · ≤1 miLoading sold comps…