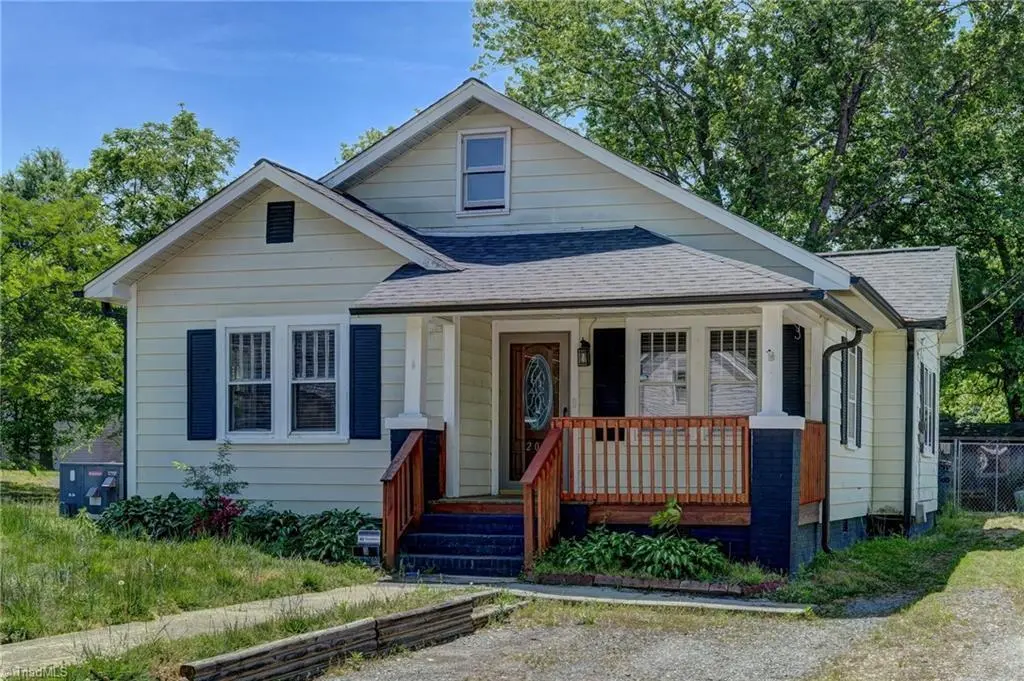
209 Burton St · Reidsville, NC
Flood risk 1/10 · Minimal
- FEMA flood zone
- X (unshaded)
- Chance of flooding over 30 yrs
- 0.0%
- Est. flood insurance / yr
- $507 – $1,088
Fire risk 1/10 · Minimal
- Est. fire insurance / yr
- $906 – $1,684
Heat risk 6/10 · Moderate
- Hot days now (above 103°F)
- 7 days/yr
- Hot days in 30 yrs
- 18 days/yr
Wind risk 4/10 · Minor
- Chance of severe wind over 30 yrs
- 10.0%
Air-quality risk 3/10 · Minor
- Unhealthy air days now
- 2 days/yr
- Unhealthy air days in 30 yrs
- 3 days/yr
Risk factors via First Street. Map © Google.
Why this score? — see what drove the D+ grade
The composite is a weighted blend of 9 inputs, each scored 0–100. Each bar is that input's sub-score; the figure is the points it added to the 100-point composite (weight × sub-score).
- Cash flow +15.0/30.0
- ARV discount +15.0/15.0
- DSCR +4.6/10.0
- 1% rule +3.7/10.0
- Schools +3.3/10.0
- Livability +3.0/5.0
- Rent growth +2.5/5.0
- Condition / age +2.5/5.0
- Appreciation +0.0/10.0
$100,000
🖨 Deal sheet 📄 Offer letter ✓ Due diligence
Listing remarks
Ready for you to make it your own! This 3-bedroom, 1-bath home in Reidsville is full of potential and a great investment opportunity. Featuring an eat-in kitchen with plenty of cabinet space, this home offers solid bones and endless possibilities for updates and personal touches. Enjoy relaxing on the classic rocking chair front porch, while the fenced backyard provides space for pets, play, or gardening. A storage building adds extra convenience and functionality. Whether you’re looking for your next investment property or a place to create your dream home, this one is worth a look!
Key facts
- Storage building
- Eat-in kitchen
- Fenced backyard
Tags
Property features AI
Finance
- HOA & community: No homeowners association
Exterior
- Parking: Driveway (gravel)
- Security: Deadbolt locks
- Utilities: Public water; Public sewer; Gas water heater; Natural gas available
- Home design: Residential stick/site-built house; One story; Built in 1932; Existing structure
- Construction: Vinyl siding; Crawl space foundation
- Exterior features: Fenced yard; City lot; Storage structure on property; Publicly maintained road access
Interior
- Kitchen: Dishwasher; Gas water heater
- Bedrooms: Bedrooms on main level (rooms listed on main level)
- Flooring: Carpet; Laminate; Wood
- Bathrooms: 1 full bathroom
- Heating & cooling: Central air conditioning; Forced air heating; Natural gas heating
- Interior features: Ceiling fans; Deadbolt locks; Primary bedroom on main level
- Laundry & utility: Washer hookup; Dryer connection on main level
Neighborhood map
What this means for you Summary
Snapshot
- This is a 3-bed/1.0-bath single-family listed at $100k.
Deal economics
- At list price, monthly cash flow is $32 ($384/yr) — positive.
- The deal already cash-flows at list — no discount required.
- To meet the 1% rule (rent ≥ 1% of price), the offer needs to be $87k (13.0% below list).
- Recommended offer: $87k (13.0% below list) — sets the bar for 1% rule.
- Cap rate 6.7% vs local median 3.8% in Reidsville — top-decile yield for the area; either an underpriced asset or a hidden risk that comps aren't pricing in. Stress-test before assuming the spread holds.
Location & tenants
- Location reads 59/100 on livability (#553 in NC) — a working-class tenant base; expect higher turnover. Strengths: cost of living A+, housing A; Watch: schools D-, crime F, amenities F.
- Rockingham County Schools (rural): math 38% / reading 40% proficiency, ranked #120 of 178 in NC (top 67%) — families likely to look elsewhere, expect single-tenant / working-renter base with shorter leases.
- Market conditions: 251 active listings in the ZIP; 7 comparable units currently listed for rent nearby; rentals at typical pace (median 23d on market — plan ~3-4 weeks tenant-placement turnaround); 344 units permitted in Rockingham County in 2024 (0 in 5+ unit buildings).
Forward outlook
- Local home prices are declining (-3.0%/yr); year-one equity from $691 of loan paydown is wiped out by about $3k of value loss. Plan a longer hold.
- Rockingham County population projected at -22% by 2050 — secular population decline; favor cash flow + early exit over multi-decade hold.
Negotiation context
- Only 10 days on market — expect competitive offers; lowballing is unlikely to land.
Risks & watch-outs
- Watch-outs: built in 1932 — expect roof / HVAC / electrical / plumbing capex.
- Climate carrying-cost: extreme-heat days projected 7→18/yr by 2055 (HVAC capex compounding) — expect insurance premiums to compound above CPI over the hold.
Questions for the listing agent
- Built in 1932 — when were the roof, HVAC, electrical panel, plumbing, and water heater last replaced?
- Is there a deadline driving the sale (1031 exchange, divorce, estate, relocation)? That informs how much negotiation room exists.
- Schools are D-rated, which usually means shorter tenancies and higher turnover. Who's the typical renter profile here, and what's been the actual vacancy rate?
- Crime grade is F in this area — have there been break-ins, vandalism, or insurance claims at this property in the last 3 years? What carrier currently insures it and at what premium?
- The area grade is low — what's the realistic commute time and amenity access for the typical tenant pool here? Any planned neighborhood developments (good or bad) we should know about?
- What's the average days-on-market for RENTAL listings here right now (not sales)? A rising rental-DOM trend means longer vacancies and softer asking-rent achievability than the comps imply.
- What's the recent tenant-quality profile in this submarket — average credit score on applications, eviction rate, late-payment / NSF rate, and stable-employment percentage? A property-management company in the area should have these aggregated.
- How much new for-sale + rental construction is in the pipeline within 1–3 miles? Heavy new supply typically softens prices + rents 12–24 months out; constrained supply supports both.
Investment metrics
- 1% rule
- 0.87% ✗
- Cap rate
- 6.68%
- Cash-on-cash
- 1.37%
- DSCR
- 1.06
- GRM
- 9.6
CMA / ARV
- ARV (on-the-fly)
- $165,984
- Comps found
- 12
Show comp detail 12 sales within ~0.75 mi
| Address | Dist | Beds/Ba | Sqft | Sold | Price | $/sf | Match |
|---|---|---|---|---|---|---|---|
| 515 Barnes St | 0.21mi | 3/1.0 | 1,056 (-3%) | 6mo | $135,000 | $128 | 80 |
| 910 Montgomery St | 0.19mi | 2/1.0 (-1) | 1,036 (-5%) | 9mo | $65,000 | $63 | 70 |
| 312 Church St | 0.50mi | 2/1.0 (-1) | 1,094 (+0%) | 3mo | $220,000 | $201 | 69 |
| 510 Sands Cir | 0.30mi | 2/1.0 (-1) | 1,072 (-2%) | 11mo | $175,000 | $163 | 69 |
| 1014 Walnut St | 0.38mi | 2/1.0 (-1) | 1,064 (-3%) | 10mo | $164,900 | $155 | 64 |
| 844 Robinson Cir | 0.56mi | 3/2.0 | 1,100 (+1%) | 8mo | $84,900 | $77 | 62 |
| 1213 Barnes St | 0.49mi | 2/1.0 (-1) | 1,155 (+6%) | 6mo | $127,500 | $110 | 58 |
| 613 Thomas St | 0.34mi | 2/1.0 (-1) | 978 (-10%) | 8mo | $162,000 | $166 | 55 |
| 624 W Harrison St | 0.72mi | 3/1.0 | 1,062 (-3%) | 10mo | $57,000 | $54 | 54 |
| 916 Forest St | 0.48mi | 2/1.0 (-1) | 989 (-9%) | 4mo | $149,900 | $152 | 54 |
| 615 East St | 0.30mi | 3/2.5 | 1,234 (+13%) | 6mo | $199,500 | $162 | 53 |
| 335 S Branch St | 0.36mi | 4/2.0 (+1) | 1,236 (+13%) | 5mo | $141,888 | $115 | 48 |
Match score weights: distance 35% · size 25% · config 20% · recency 20%. Top-matched comps best support the ARV.
Projected returns pro-forma
-3.0% appreciation · 3.0% rent growth · sell at horizon
- IRR
- -14.1%
- Equity multiple
- 0.49×
- Total profit
- $-14,177
- Equity at exit
- $14,910
- IRR
- -5.4%
- Equity multiple
- 0.65×
- Total profit
- $-9,760
- Equity at exit
- $8,646
Cash invested: $28,000 (down + closing). Projections, not guarantees.
Landlord ↔ Tenant lean methodology
- Overall (STATE)
- 85 Strongly Landlord-Friendly
- State North Carolina
- 85 Strongly Landlord-Friendly · R+3
- County
- — inherits STATE
- City
- — inherits STATE
ZIP-level market 27320
- Home prices YoY
- -30.8%
- Active inventory
- 251
- Price-to-rent
- 9.6×
Monthly cashflow live
- Estimated rent
- $870 high interval (Pro) →
- Mortgage (P&I)
- −$524
- Tax from tax record
- −$89 /mo · $1,069/yr
- Insurance
- −$42
- HOA
- −$0
- Vacancy / Maint / Mgmt
- −$183
- Net cashflow
- $32
Break-even live
UW: 25.0% down · 7.5% · 30yr · 1.5% tax · 5.0% vac · 8.0% maint · 8.0% mgmt
Financing live
Cash to close
- Down payment
- $25,000
- Closing costs
- $3,000
- Reserves months
- —
- Total cash needed
- —
Loan-product check · same deal, 3 products live
Conventional
25% down · 7.5% · 30yr
- Down + closing
- —
- Monthly P&I
- —
- Monthly cashflow
- —
- DSCR
- —
- Eligible?
- —
Personal DTI + credit; lowest rate.
DSCR
20% down · 8.5% · 30yr
- Down + closing
- —
- Monthly P&I
- —
- Monthly cashflow
- —
- DSCR
- —
- Eligible?
- —
No personal income docs; deal must DSCR.
Hard money
10% down · 12.0% · 12mo
- Down + closing
- —
- Monthly P&I
- —
- Monthly cashflow
- —
- DSCR
- —
- Eligible?
- —
Short-term bridge; refi at stabilization.
Rent comps 7 comps
| Address | Beds | Baths | Sqft | Rent | $/sqft | DOM | Units | Dist |
|---|---|---|---|---|---|---|---|---|
| 411 W Ransom St Reidsville, NC | 2.0 | 1.0 | 900 | $825 | $0.92 | 18d | 1 | 0.42mi |
| 411 W Ransom St Apt 1 Reidsville, NC | 2.0 | 1.0 | 900 | $825 | $0.92 | 23d | 1 | 0.42mi |
| 1114 Maiden Ln #4 Reidsville, NC | 2.0 | 1.5 | 900 | $925 | $1.03 | 23d | 1 | 0.71mi |
| 110 Arlington St Reidsville, NC | 2.0 | 1.0 | 1000 | $850 | $0.85 | 23d | 1 | 0.74mi |
| 528 N Scales St Unit C Reidsville, NC | 2.0 | 1.0 | 1080 | $825 | $0.76 | 23d | 1 | 1.08mi |
| 1710 Amos St Reidsville, NC | 2.0 | 1.0 | 916 | $950 | $1.04 | 23d | 1 | 1.10mi |
| 202 Mulberry St Reidsville, NC | 2.0 | 1.0 | 899 | $1,025 | $1.14 | 23d | 1 | 1.10mi |
Listing history 3 events
-
2026-05-19status Pending
-
2026-05-12historical Due Diligence Period
-
2026-05-08$100,000 Active
ⓘ Source: listings_history table (triggers on properties + properties_extension) + one-shot
backfill from property_details.listing_events for pre-trigger history.
Tax reassessment forecast NC · Resets to sale price
- Current annual tax
- $1,069 · $89/mo
- Projected year-2 tax
- $1,069 · $89/mo
- Expected delta
- $0/yr ($0/mo · 0.0%)
ⓘ Screening estimate from a state-policy table — verify with the county assessor before closing.
Climate risk First Street
- Flood 1/10 Low FEMA zone X (unshaded) · 0% chance over 30 yrs
- Wildfire 1/10 Low
- Heat 6/10 Major 7 d/yr ≥103°F today · 18 d/yr by 30 yrs out
- Wind 4/10 Moderate 10% chance of damaging wind over 30 yrs
- Air quality 3/10 Moderate 2 unhealthy d/yr today · 3 by 30 yrs out
Nearby sold comps map
Loading sold comps map…
Walkable amenities ~0.75 mi
Loading nearby amenities…
Taxation est. · year 1
- Rental income
- $10,437
- − Mortgage interest
- −$5,602
- − Property taxes
- −$1,069
- − Insurance
- −$500
- − Repairs & maintenance
- −$835
- − Management
- −$835
- − Depreciation
- −$2,909
- Taxable loss
- −$1,312
- Est. tax savings @ 24.0%
- +$315
- After-tax cash flow
- $699/yr
For passive investors: Depreciation is non-cash, so a rental often shows a tax loss while cash-flowing — sheltering income. Rental losses are passive: they offset passive income freely, and up to $25,000/yr can offset ordinary (W-2) income if you actively participate and your MAGI is under $100k (phasing out to $0 by $150k); unused losses carry forward. On sale, claimed depreciation is recaptured at up to 25%, and gains may owe capital-gains tax (a 1031 exchange can defer both). Figures are a year-1 estimate at your 24.0% rate — not tax advice; consult a CPA.
Schools (NCES district)
- District
- Rockingham County Schools
- NCES district ID
- 3703990
- Math proficiency
- 38% ▼ -2.00%
- Reading proficiency
- 40% ▲ 1.00%
- Median HH income
- $38,914
- Composite
- 32.6/100
- National rank
- #5673
- State rank
- #120 of 178 in NC
Livability — Reidsville
- Score
- 59/100
- State rank
- #553
- US rank
- #20359
Category grades
Schools grade is shown separately in the Schools card above.
Census & demographics
- Census place
- Reidsville, NC
- City population
- 38,610
- Population (ZIP)
- 38,610
Population outlook (Rockingham County) Hauer SSP2
- Today (2025)
- 87,103 people
- By 2030
- 83,763 · -3.8%
- By 2040
- 76,082 · -12.7%
- By 2050
- 68,106 · -21.8%
- By 2075
- 52,531 · -39.7%
- By 2100
- 39,871 · -54.2%
Race, ethnicity, and origin ACS 2023
- Neighborhood character
- Majority White (64%)
- Race & ethnicity
- White 64% Black 23% Two or more races 8% Hispanic / Latino 7%
- Hispanic origin (detail)
- Mexican 4%
- Common ancestry
- Slovak 2% Serbian 2% Italian 2%
- Foreign-born
- 3% · Canada
- Languages at home
- 94% English-only · Spanish 5%
Political lean MEDSL · Rockingham
- 2024 margin
- Solid R (+35.9) · D 31.7% · R 67.6%
- 2008→2024 swing
- -19.9pp toward R · 2008: -16.0pp · 2024: -35.9pp
- All cycles
- 2024: R+35.9 2020: R+32.0 2016: R+30.0 2012: R+21.3 2008: R+16.0
Not yet ingested
- Civics
- —
Market trends
- HPI YoY
- ▼ -91.42%
- Current HPI
- 205.028
- Rent YoY
- —
- Metro
- —
- State GDP YoY
- ▲ 3.28%
- F500 in state
- 26
Industry mix (Fortune 500 HQ in NC)
| Industry | F500 HQs | Revenue |
|---|---|---|
| Financial Services | 2 | $213B |
|
||
| Retail | 2 | $95B |
|
||
| Industrial Conglomerate | 1 | $38B |
|
||
| Metals / Steel | 1 | $35B |
|
||
| Utilities | 1 | $30B |
|
||
| Industrial Machinery | 1 | $19B |
|
||
Price history
3 events — show timeline
- 2026-05-19 Pending — Triad MLS
- 2026-05-12 Contingent — Triad MLS
- 2026-05-08 Listed $100,000 Triad MLS
Property tax history
+4.7%/yrLatest (2025): $1,069 · +0.0% YoY. Source: county tax records.
Cash-flow waterfall
monthlySold comps — $/sqft
last 12 mo · ≤1 miLoading sold comps…