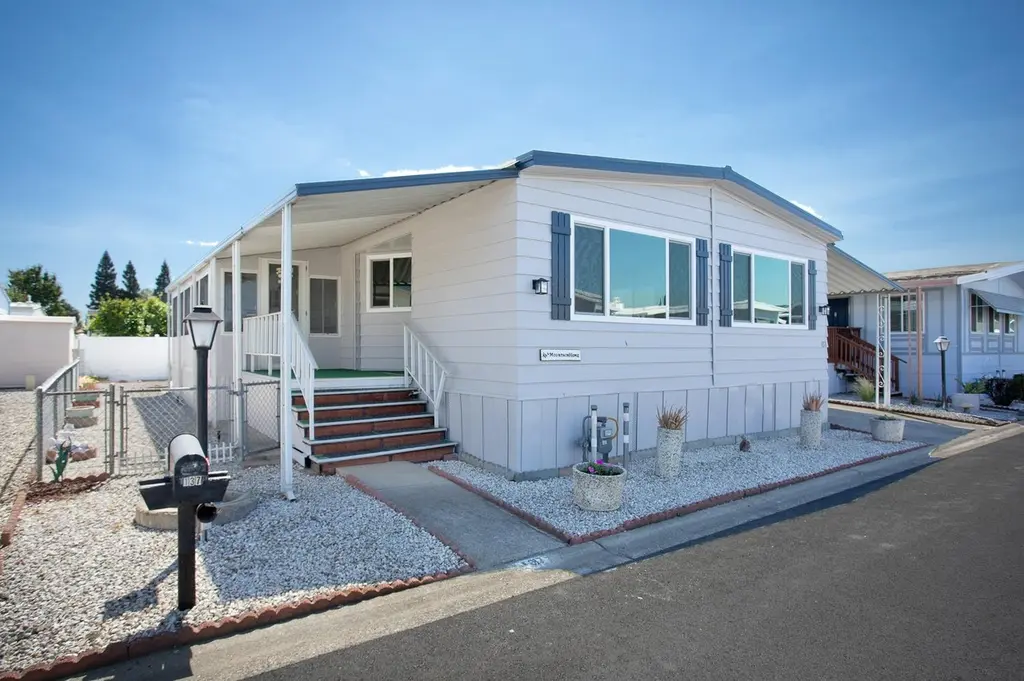
137 La Brea Way · Yuba City, CA
Flood risk 1/10 · Minimal
- FEMA flood zone
- X
- Chance of flooding over 30 yrs
- 0.0%
- Est. flood insurance / yr
- $507 – $1,088
Fire risk 4/10 · Minor
- Est. fire insurance / yr
- $659 – $1,223
Heat risk 7/10 · Major
- Hot days now (above 105°F)
- 7 days/yr
- Hot days in 30 yrs
- 16 days/yr
Wind risk 1/10 · Minimal
- Chance of severe wind over 30 yrs
- —
Air-quality risk 10/10 · Severe
- Unhealthy air days now
- 28 days/yr
- Unhealthy air days in 30 yrs
- 32 days/yr
Risk factors via First Street. Map © Google.
Why this score? — see what drove the B- grade
The composite is a weighted blend of 9 inputs, each scored 0–100. Each bar is that input's sub-score; the figure is the points it added to the 100-point composite (weight × sub-score).
- Cash flow +30.0/30.0
- 1% rule +10.0/10.0
- DSCR +10.0/10.0
- ARV discount +6.7/15.0
- Livability +3.8/5.0
- Schools +3.2/10.0
- Rent growth +2.5/5.0
- Condition / age +2.5/5.0
- Appreciation +0.0/10.0
$134,500
🖨 Deal sheet (PDF) 📄 Offer letter ✓ Due diligence
Listing remarks
This home has a fully updated kitchen with all new appliances, new granite countertops, and new cabinets, along with new LVP flooring and fresh paint inside and out. Located in the desirable Del Prado 55+ mobile home park in central Yuba City, this 2‑bed, 2‑bath double‑wide offers 1,420 sq ft of comfortable living. The home also has new dual‑pane windows and a newer Trane central HVAC system for year‑round comfort. Outside, there's a useful tool/storage shed and a partially fenced area that works well for keeping pets contained. Del Prado is a well‑kept senior community close to shopping, medical offices, and restaurants, making everyday errands simple and convenient. This is a clean, nicel
Key facts
- Fresh paint
- New cabinets
- New appliances
Tags
Property features AI
Finance
- Financial info: Land lease amount listed as $750
- HOA & community: No homeowners association; Located in a senior community; Land lease not required (park land lease listed separately)
Exterior
- Parking: 2 parking spaces; Attached and covered parking; Guest parking available
- Utilities: Individual electric meter; Individual gas meter; Natural gas connected; 220 volts in laundry; Public water; Public sewer
- Home design: Manufactured home (double wide) in a park; Mountain Valley Home manufacturer; Updated/remodeled; Built in 1978
- Construction: Aluminum skirting; Other type roof
- Exterior features: Fence; Landscaped front and back yards; Carport awning; Porch awning; Storage and workshop structures; Covered patio; Screened-in patio
Interior
- Kitchen: Pantry closet; Stone countertops; Free-standing gas range; Dishwasher; Disposal; Microwave
- Bedrooms: 3 bedrooms (including master bedroom)
- Bathrooms: 2 full bathrooms; Double sinks; Low-flow showers and toilets; Tub with shower over
- Heating & cooling: Central heating; Central cooling
- Interior features: Updated/remodeled interior; Dual-pane full windows; Covered and screened-in patio; Porch with steps; Deck attached to living room; Storage area
- Laundry & utility: Laundry inside the home; Washer/dryer hookups only; Gas water heater
Neighborhood map
What this means for you Summary
Snapshot
- This is a 3-bed/2.0-bath manufactured listed at $134k.
Deal economics
- At list price, monthly cash flow is $882 ($11k/yr) — positive.
- The deal already cash-flows at list — no discount required.
- Meets the 1% rule at list price ($2k rent vs $134k).
- Recommended offer: $132k (1.5% below list) — sets the bar for market timing.
- Cap rate 14.2% vs local median 3.6% in Yuba City — top-decile yield for the area; either an underpriced asset or a hidden risk that comps aren't pricing in. Stress-test before assuming the spread holds.
Location & tenants
- Location reads 75/100 on livability (#111 in CA, #3,863 nationally) — a middle-class / working-renter tenant base. Strengths: commute A+, housing A+, health & safety A+; Watch: crime D+, schools D, cost of living F.
- Yuba City Unified (urban): math 20% / reading 53% proficiency, ranked #263 of 517 in CA (top 51%) — families likely to look elsewhere, expect single-tenant / working-renter base with shorter leases.
- Market conditions: 176 active listings in the ZIP; 18 comparable units currently listed for rent nearby; rentals at typical pace (median 22d on market — plan ~3-4 weeks tenant-placement turnaround); solid renter incomes; 73 units permitted in Sutter County in 2024 (0 in 5+ unit buildings).
Forward outlook
- Local home prices are declining (-3.0%/yr); year-one equity from $930 of loan paydown is wiped out by about $4k of value loss. Plan a longer hold.
- Sutter County population projected to shrink 4% by 2050 — rents likely to lag national; underwrite the cash flow, not the appreciation.
- At projected returns (-3.0% appreciation + 3.0% rent growth), your $38k cash investment doubles in ~5 years — after that, you're playing with house money.
Negotiation context
- It's been on market 23 days — a 2% lower offer ($132k) is reasonable based on typical stale-listing flexibility.
Risks & watch-outs
- Climate carrying-cost: extreme-heat days projected 7→16/yr by 2055 (HVAC capex compounding) — expect insurance premiums to compound above CPI over the hold.
Questions for the listing agent
- Built in 1978 — when were the roof, HVAC, electrical panel, plumbing, and water heater last replaced?
- Is there a deadline driving the sale (1031 exchange, divorce, estate, relocation)? That informs how much negotiation room exists.
- Schools are D-rated, which usually means shorter tenancies and higher turnover. Who's the typical renter profile here, and what's been the actual vacancy rate?
- Crime grade is D in this area — have there been break-ins, vandalism, or insurance claims at this property in the last 3 years? What carrier currently insures it and at what premium?
- What's the average days-on-market for RENTAL listings here right now (not sales)? A rising rental-DOM trend means longer vacancies and softer asking-rent achievability than the comps imply.
- What's the recent tenant-quality profile in this submarket — average credit score on applications, eviction rate, late-payment / NSF rate, and stable-employment percentage? A property-management company in the area should have these aggregated.
- How much new for-sale + rental construction is in the pipeline within 1–3 miles? Heavy new supply typically softens prices + rents 12–24 months out; constrained supply supports both.
Investment metrics
- 1% rule
- 1.70% ✓
- Cap rate
- 14.16%
- Cash-on-cash
- 28.10%
- DSCR
- 2.25
- GRM
- 4.9
CMA / ARV
- ARV (on-the-fly)
- $132,060
- Comps found
- 12
Show comp detail 12 sales within ~0.75 mi
| Address | Dist | Beds/Ba | Sqft | Sold | Price | $/sf | Match |
|---|---|---|---|---|---|---|---|
| 151 la Brea | 0.02mi | 2/2.0 (-1) | 1,440 (+1%) | 4mo | $119,900 | $83 | 89 |
| 41 La Cienega | 0.08mi | 3/2.0 | 1,440 (+1%) | 11mo | $153,500 | $107 | 85 |
| 156 El Granero Way | 0.03mi | 2/2.0 (-1) | 1,440 (+1%) | 13mo | $140,000 | $97 | 80 |
| 123 El Verano Way | 0.08mi | 2/2.0 (-1) | 1,488 (+5%) | 5mo | $138,800 | $93 | 79 |
| 56 La Mesa | 0.10mi | 2/1.5 (-1) | 1,440 (+1%) | 14mo | $118,500 | $82 | 74 |
| 134 El Verano Way | 0.05mi | 2/2.0 (-1) | 1,528 (+8%) | 8mo | $131,000 | $86 | 73 |
| 175 El Verano | 0.07mi | 2/2.0 (-1) | 1,560 (+10%) | 3mo | $85,000 | $54 | 73 |
| 99 La Entrada Way | 0.09mi | 2/2.0 (-1) | 1,440 (+1%) | 19mo | $105,000 | $73 | 73 |
| 15 La Cienega | 0.13mi | 2/2.0 (-1) | 1,294 (-9%) | 3mo | $135,800 | $105 | 72 |
| 55 La Mesa Way | 0.11mi | 3/2.0 | 1,518 (+7%) | 16mo | $218,000 | $144 | 70 |
| 64 La Mesa | 0.07mi | 2/2.0 (-1) | 1,536 (+8%) | 14mo | $65,000 | $42 | 66 |
| 22 La Cienega Way | 0.11mi | 3/2.0 | 1,232 (-13%) | 8mo | $140,000 | $114 | 66 |
Match score weights: distance 35% · size 25% · config 20% · recency 20%. Top-matched comps best support the ARV.
Projected returns pro-forma
-3.0% appreciation · 3.0% rent growth · sell at horizon
- IRR
- 22.3%
- Equity multiple
- 1.91×
- Total profit
- $34,417
- Equity at exit
- $20,054
- IRR
- 30.3%
- Equity multiple
- 3.72×
- Total profit
- $102,446
- Equity at exit
- $11,629
Cash invested: $37,660 (down + closing). Projections, not guarantees.
Landlord ↔ Tenant lean methodology
- Overall (STATE)
- 18 Strongly Tenant-Friendly
- State California
- 18 Strongly Tenant-Friendly · D+13
- County
- — inherits STATE
- City
- — inherits STATE
ZIP-level market 95993
- Active inventory
- 176
- Price-to-rent
- 4.9×
Monthly cashflow live
- Estimated rent
- $2,293 high interval (Pro) →
- Mortgage (P&I)
- −$705
- Tax est. 1.5%
- −$168 /mo · $2,018/yr
- Insurance
- −$56
- HOA
- −$0
- Vacancy / Maint / Mgmt
- −$482
- Net cashflow
- $882
Break-even live
Sensitivity live
| Price | -10% $975 | -5% $929 | +0% $882 | +5% $836 | +10% $789 |
|---|---|---|---|---|---|
| Rent | -10% $701 | -5% $791 | +0% $882 | +5% $973 | +10% $1,063 |
| Rate | -1.0pp $950 | -0.5pp $916 | base $882 | +0.5pp $847 | +1.0pp $812 |
UW: 25.0% down · 7.5% · 30yr · 1.5% tax · 5.0% vac · 8.0% maint · 8.0% mgmt
Financing live
Cash to close
- Down payment
- $33,625
- Closing costs
- $4,035
- Reserves months
- —
- Total cash needed
- —
Loan-product check · same deal, 3 products live
Conventional
25% down · 7.5% · 30yr
- Down + closing
- —
- Monthly P&I
- —
- Monthly cashflow
- —
- DSCR
- —
- Eligible?
- —
Personal DTI + credit; lowest rate.
DSCR
20% down · 8.5% · 30yr
- Down + closing
- —
- Monthly P&I
- —
- Monthly cashflow
- —
- DSCR
- —
- Eligible?
- —
No personal income docs; deal must DSCR.
Hard money
10% down · 12.0% · 12mo
- Down + closing
- —
- Monthly P&I
- —
- Monthly cashflow
- —
- DSCR
- —
- Eligible?
- —
Short-term bridge; refi at stabilization.
Rent comps 18 comps
| Address | Beds | Baths | Sqft | Rent | $/sqft | DOM | Units | Dist |
|---|---|---|---|---|---|---|---|---|
| 1694 Shay Way Yuba City, CA | 4.0 | 2.5 | 1744 | $2,400 | $1.38 | 14d | 1 | 0.19mi |
| 1574 Heather Dr Unit 206 Yuba City, CA | 2.0 | 1.0 | 1005 | $1,650 | $1.64 | 21d | 1 | 0.27mi |
| 1431 Mirada Cir Yuba City, CA | 3.0 | 2.0 | 1370 | $2,400 | $1.75 | 21d | 1 | 0.33mi |
| 1450 Peach Tree Ln Yuba City, CA | 3.0 | 2.0 | 1850 | $2,350 | $1.27 | 44d | 1 | 0.41mi |
| 1171 Kenny Dr Unit 10 Yuba City, CA | 2.0 | 1.0 | 900 | $1,375 | $1.53 | 44d | 1 | 0.83mi |
| 1171 Kenny Dr Yuba City, CA | 2.0 | 1.0 | 900 | $1,500 | $1.67 | 44d | 1 | 0.83mi |
| 1199 Casita Dr #1 Yuba City, CA | 2.0 | 1.0 | 896 | $1,500 | $1.67 | 21d | 1 | 0.84mi |
| 1290 Northgate Dr Unit 81 Yuba City, CA | 2.0 | 2.0 | 941 | $1,500 | $1.59 | 44d | 1 | 0.85mi |
| 1335 Meadowlark Way Yuba City, CA | 3.0 | 2.0 | 1710 | $2,500 | $1.46 | 44d | 1 | 0.87mi |
| 1138 Forestwood Dr Yuba City, CA | 2.0 | 2.0 | 964 | $2,025 | $2.10 | 21d | 1 | 0.92mi |
| 1101 Northgate Dr Yuba City, CA | 3.0 | 2.0 | 1817 | $2,300 | $1.27 | 44d | 1 | 1.08mi |
| 1518 Upland Dr Unit 1518 Yuba City, CA | 2.0 | 1.0 | 1084 | $1,900 | $1.75 | 44d | 1 | 1.17mi |
| 1722 Clark Ave Yuba City, CA | 3.0 | 2.0 | 1479 | $2,500 | $1.69 | 21d | 1 | 1.19mi |
| 1475 Knights Row Yuba City, CA | 4.0 | 2.0 | 1171 | $2,279 | $1.95 | 21d | 1 | 1.33mi |
| 1590 Alfred Way Unit 2 Yuba City, CA | 2.0 | 1.0 | 906 | $1,400 | $1.55 | 14d | 1 | 1.38mi |
| 1456 Live Oak Blvd Yuba City, CA | 3.0 | 2.0 | 1522 | $2,495 | $1.64 | 21d | 1 | 1.40mi |
| 515 Ohlson St Yuba City, CA | 3.0 | 2.0 | 1337 | $2,300 | $1.72 | 14d | 1 | 1.41mi |
| 1602 Wildflower Cir Unit 1602 Yuba City, CA | 3.0 | 2.0 | 1451 | $2,200 | $1.52 | 14d | 1 | 1.43mi |
Listing history 15 events
-
2026-06-19days on market $134,500 Active 23 DOM
-
2026-06-18days on market $134,500 Active 22 DOM
-
2026-06-17days on market $134,500 Active 21 DOM
-
2026-06-16status $134,500 Active 20 DOM
-
2026-06-13statusdays on market $134,500 Pending 20 DOM
-
2026-06-10days on market $134,500 Active 19 DOM
-
2026-06-09days on market $134,500 Active 18 DOM
-
2026-06-08days on market $134,500 Active 17 DOM
-
2026-06-07days on market $134,500 Active 16 DOM
-
2026-06-05days on market $134,500 Active 13 DOM
-
2026-06-03days on market $134,500 Active 12 DOM
-
2026-06-02days on market $134,500 Active 11 DOM
-
2026-06-01days on market $134,500 Active 10 DOM
-
2026-05-31days on market $134,500 Active 9 DOM
-
2026-05-30days on market $134,500 Active 8 DOM
ⓘ Source: listings_history table (triggers on properties + properties_extension) + one-shot
backfill from property_details.listing_events for pre-trigger history.
Climate risk First Street
- Flood 1/10 Low FEMA zone X · 0% chance over 30 yrs
- Wildfire 4/10 Moderate
- Heat 7/10 Severe 7 d/yr ≥105°F today · 16 d/yr by 30 yrs out
- Wind 1/10 Low
- Air quality 10/10 Extreme 28 unhealthy d/yr today · 32 by 30 yrs out
Nearby sold comps map
Loading sold comps map…
Walkable amenities ~0.75 mi
Loading nearby amenities…
Taxation est. · year 1
- Rental income
- $27,517
- − Mortgage interest
- −$7,534
- − Property taxes
- −$2,018
- − Insurance
- −$672
- − Repairs & maintenance
- −$2,201
- − Management
- −$2,201
- − Depreciation
- −$3,913
- Taxable income
- $8,977
- Est. tax owed @ 24.0%
- −$2,155
- After-tax cash flow
- $8,430/yr
For passive investors: Depreciation is non-cash, so a rental often shows a tax loss while cash-flowing — sheltering income. Rental losses are passive: they offset passive income freely, and up to $25,000/yr can offset ordinary (W-2) income if you actively participate and your MAGI is under $100k (phasing out to $0 by $150k); unused losses carry forward. On sale, claimed depreciation is recaptured at up to 25%, and gains may owe capital-gains tax (a 1031 exchange can defer both). Figures are a year-1 estimate at your 24.0% rate — not tax advice; consult a CPA.
Schools (NCES district)
- District
- Yuba City Unified
- NCES district ID
- 0643470
- Math proficiency
- 20% ▼ -10.00%
- Reading proficiency
- 53% ▲ 5.00%
- Median HH income
- $50,923
- Composite
- 31.55/100
- National rank
- #5956
- State rank
- #263 of 517 in CA
Livability — Yuba City
- Score
- 75/100
- State rank
- #111
- US rank
- #3863
Category grades
Schools grade is shown separately in the Schools card above.
Census & demographics
- Census place
- Yuba City, CA
- County
- Sutter County · 81,625 people
- City population
- 81,625
- Metro
- Yuba City, CA
- Population (ZIP)
- 39,046
- Household income
- $93,763
- Rent vs Own
- Severe rent burden
- 738.0
Population outlook (Sutter County) Hauer SSP2
- Today (2025)
- 97,244 people
- By 2030
- 97,170 · -0.1%
- By 2040
- 96,137 · -1.1%
- By 2050
- 93,604 · -3.7%
- By 2075
- 85,008 · -12.6%
- By 2100
- 71,584 · -26.4%
Race, ethnicity, and origin ACS 2023
- Neighborhood character
- Diverse neighborhood (Simpson 0.68)
- Race & ethnicity
- White 45% Asian 25% Hispanic / Latino 23% Two or more races 12% Black 1%
- Hispanic origin (detail)
- Mexican 21%
- Common ancestry
- Slovak 2% Italian 1% Russian 1%
- Foreign-born
- 23% · Canada, Vietnam
- Languages at home
- 65% English-only · Other Indo-European 20% Spanish 12% Other Asian/Pacific 1%
Political lean MEDSL · Sutter
- 2024 margin
- Solid R (+31.4) · D 33.1% · R 64.5% · Other 2.4%
- 2008→2024 swing
- -14.7pp toward R · 2008: -16.7pp · 2024: -31.4pp
- All cycles
- 2024: R+31.4 2020: R+16.4 2016: R+16.3 2012: R+21.8 2008: R+16.7
Not yet ingested
- Civics
- —
Market trends
- HPI YoY
- ▼ -280.05%
- Current HPI
- 210.9131
- Rent YoY
- —
- Metro
- Yuba City, CA
- State GDP YoY
- ▲ 3.21%
- F500 in state
- 116
Industry mix (Fortune 500 HQ in CA)
| Industry | F500 HQs | Revenue |
|---|---|---|
| Technology | 27 | $1,492B |
|
||
| Financial Services | 3 | $174B |
|
||
| Retail | 3 | $44B |
|
||
| Insurance | 3 | $26B |
|
||
| Media / Entertainment | 2 | $115B |
|
||
| Pharmaceuticals / Biotech | 2 | $62B |
|
||
Property tax history
-1.6%/yrLatest (2025): $253 · +8.4% YoY. Source: county tax records.
Cash-flow waterfall
monthlySold comps — $/sqft
last 12 mo · ≤1 miLoading sold comps…