 Duplex
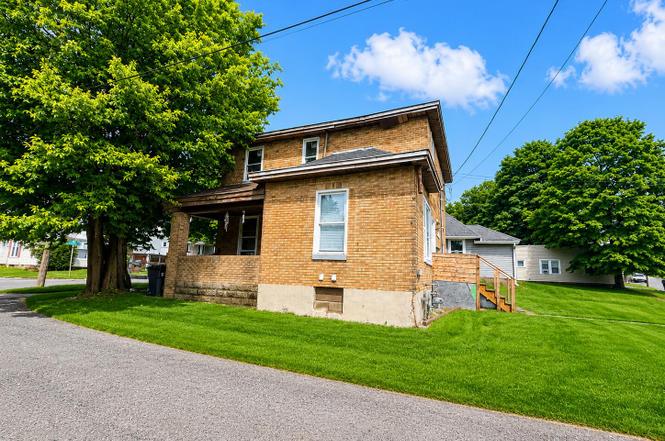
500 E Chillicothe Ave · Bellefontaine, OH
Flood risk No data
- FEMA flood zone
- —
- Chance of flooding over 30 yrs
- —
- Est. flood insurance / yr
- —
Fire risk No data
- Est. fire insurance / yr
- —
Heat risk No data
- Hot days now (above threshold)
- —
- Hot days in 30 yrs
- —
Wind risk No data
- Chance of severe wind over 30 yrs
- —
Air-quality risk No data
- Unhealthy air days now
- —
- Unhealthy air days in 30 yrs
- —
Risk factors via First Street. Map © Google.
Why this score? — see what drove the B+ grade
The composite is a weighted blend of 9 inputs, each scored 0–100. Each bar is that input's sub-score; the figure is the points it added to the 100-point composite (weight × sub-score).
- Cash flow +30.0/30.0
- ARV discount +13.9/15.0
- 1% rule +10.0/10.0
- DSCR +10.0/10.0
- Schools +4.8/10.0
- Livability +3.8/5.0
- Rent growth +2.5/5.0
- Condition / age +2.5/5.0
- Appreciation +0.0/10.0
$154,900
🖨 Deal sheet 📄 Offer letter ✓ Due diligence
Multi-family units
County records classify this as Multi-Family (2-4 Unit). Listing-text estimate: 2 units. confirmed
Listing remarks
Attention investors! Now's your chance to own an up/down duplex located close to downtown Bellefontaine. Lower unit features 2 bedrooms and 1 bath and is currently rented for $750/month. The upper unit features 1 bedroom and 1 bath. Currently, the upper is vacant but was last rented for $375. Considering a journey into investment properties, look at this one before it's gone. Property has updated electricity and gas meters.
Key facts
- Up down duplex
- Updated electricity
- Close to downtown
Tags
Property features AI
Exterior
- Utilities: Public sewer; Supplied water
- Home design: Multi-family property; 2-unit building; Built in 1920
- Construction: Brick construction
- Exterior features: Residential lot; 50 x 71 lot dimensions
Interior
- Bathrooms: 2 full bathrooms
- Heating & cooling: Forced air heating (natural gas); Window unit cooling
- Interior features: Block basement
Neighborhood map
What this means for you Summary
Snapshot
- This is a 2 × 3-bed/2.0-bath units multifamily listed at $155k.
Deal economics
- At list price, monthly cash flow is $922 ($11k/yr) — positive. Per door: $461/mo.
- The deal already cash-flows at list — no discount required.
- Meets the 1% rule at list price ($2k rent vs $155k).
- Cap rate 13.4% vs local median 3.6% in Bellefontaine — top-decile yield for the area; either an underpriced asset or a hidden risk that comps aren't pricing in. Stress-test before assuming the spread holds.
Location & tenants
- Location reads 76/100 on livability (#213 in OH, #3,316 nationally) — a middle-class / working-renter tenant base. Strengths: crime A+, cost of living A+, housing A+; Watch: employment D+, amenities F, commute F.
- Bellefontaine City (town): math 55% / reading 59% proficiency, ranked #348 of 656 in OH (top 53%) — acceptable for families but not a draw, mixed tenant base, ~2y average lease.
- Market conditions: 152 active listings in the ZIP; 1 comparable units currently listed for rent nearby; 121 units permitted in Logan County in 2024 (0 in 5+ unit buildings).
- At $2,429/mo this rent would consume 45% of the median local household income ($64k/yr) — very limited rent-growth headroom before tenants either downsize or default.
Forward outlook
- Local home prices are declining (-3.0%/yr); year-one equity from $1k of loan paydown is wiped out by about $5k of value loss. Plan a longer hold.
- Logan County population projected at -15% by 2050 — secular population decline; favor cash flow + early exit over multi-decade hold.
- At projected returns (-3.0% appreciation + 3.0% rent growth), your $43k cash investment doubles in ~5 years — after that, you're playing with house money.
Negotiation context
- Only 3 days on market — expect competitive offers; lowballing is unlikely to land.
- 3 sale attempts since 2y ago with the ask held roughly flat each time — persistent listings suggest the price (not the market) is what's stuck; bring a comps-based counter.
- Current owner paid $59k; list at $155k implies a 163% gain — meaningful room to come down on a strong offer.
Risks & watch-outs
- Watch-outs: built in 1920 — expect roof / HVAC / electrical / plumbing capex.
Questions for the listing agent
- Can we see the unit-by-unit rent roll, current vacancy, and any below-market leases? What's the average tenancy length?
- What capital expenditures (roof, boiler, parking lot, exteriors) have been made in the last 5 years, and what's planned in the next 2?
- Built in 1920 — when were the roof, HVAC, electrical panel, plumbing, and water heater last replaced?
- Is there a deadline driving the sale (1031 exchange, divorce, estate, relocation)? That informs how much negotiation room exists.
- What's the average days-on-market for RENTAL listings here right now (not sales)? A rising rental-DOM trend means longer vacancies and softer asking-rent achievability than the comps imply.
- What's the recent tenant-quality profile in this submarket — average credit score on applications, eviction rate, late-payment / NSF rate, and stable-employment percentage? A property-management company in the area should have these aggregated.
- How much new apartment / multifamily construction is in the pipeline within 1–3 miles? Heavy new supply (>2% of stock underway) typically softens rents 12–24 months out; light construction supports rent growth.
Investment metrics
- 1% rule
- 1.57% ✓
- Cap rate
- 13.44%
- Cash-on-cash
- 25.52%
- DSCR
- 2.14
- GRM
- 5.3
CMA / ARV
- ARV (on-the-fly)
- $180,544
- Comps found
- 1
Show comp detail 1 sale within ~0.75 mi
| Address | Dist | Beds/Ba | Sqft | Sold | Price | $/sf | Match |
|---|---|---|---|---|---|---|---|
| 576 Eastern | 0.15mi | 4/2.0 (+1) | 1,568 (+8%) | 11mo | $195,000 | $124 | 66 |
Match score weights: distance 35% · size 25% · config 20% · recency 20%. Top-matched comps best support the ARV.
Projected returns pro-forma
-3.0% appreciation · 3.0% rent growth · sell at horizon
- IRR
- 19.1%
- Equity multiple
- 1.78×
- Total profit
- $33,627
- Equity at exit
- $23,096
- IRR
- 27.4%
- Equity multiple
- 3.42×
- Total profit
- $104,879
- Equity at exit
- $13,393
Cash invested: $43,372 (down + closing). Projections, not guarantees.
Landlord ↔ Tenant lean methodology
- Overall (STATE)
- 73 Landlord-Friendly
- State Ohio
- 73 Landlord-Friendly · R+6
- County
- — inherits STATE
- City
- — inherits STATE
ZIP-level market 43311
- Active inventory
- 152
- Price-to-rent
- 10.6×
Monthly cashflow live
- Estimated rent
- $2,429 medium interval (Pro) →
- Mortgage (P&I)
- −$812
- Tax from tax record
- −$120 /mo · $1,438/yr
- Insurance
- −$65
- HOA
- −$0
- Vacancy / Maint / Mgmt
- −$510
- Net cashflow
- $922
Break-even live
2-unit breakdown (identical units grouped — click to expand)
| Units | Beds | Baths | Est. rent |
|---|---|---|---|
| 2× units | 3 | 2 | $2,428 |
| #1 | 3 | 2 | $1,214 |
| #2 | 3 | 2 | $1,214 |
| Total (2 units) | $2,429 | ||
UW: 25.0% down · 7.5% · 30yr · 1.5% tax · 5.0% vac · 8.0% maint · 8.0% mgmt
Financing live
Cash to close
- Down payment
- $38,725
- Closing costs
- $4,647
- Reserves months
- —
- Total cash needed
- —
Loan-product check · same deal, 3 products live
Conventional
25% down · 7.5% · 30yr
- Down + closing
- —
- Monthly P&I
- —
- Monthly cashflow
- —
- DSCR
- —
- Eligible?
- —
Personal DTI + credit; lowest rate.
DSCR
20% down · 8.5% · 30yr
- Down + closing
- —
- Monthly P&I
- —
- Monthly cashflow
- —
- DSCR
- —
- Eligible?
- —
No personal income docs; deal must DSCR.
Hard money
10% down · 12.0% · 12mo
- Down + closing
- —
- Monthly P&I
- —
- Monthly cashflow
- —
- DSCR
- —
- Eligible?
- —
Short-term bridge; refi at stabilization.
Rent comps 1 comps
| Address | Beds | Baths | Sqft | Rent | $/sqft | DOM | Units | Dist |
|---|---|---|---|---|---|---|---|---|
| 520 N Madriver St Bellefontaine, OH | 4.0 | 1.5 | 1600 | $1,700 | $1.06 | 43d | 1 | 0.63mi |
Listing history 4 events
-
2026-06-18days on market $154,900 Active 3 DOM
-
2026-06-17days on market $154,900 Active 2 DOM
-
2026-06-15remarks 427-char remark
-
2026-06-15$154,900 Active 1 DOM
ⓘ Source: listings_history table (triggers on properties + properties_extension) + one-shot
backfill from property_details.listing_events for pre-trigger history.
Tax reassessment forecast OH · Partial reset (capped growth)
- Current annual tax
- $1,438 · $120/mo
- Projected year-2 tax
- $1,927 · $161/mo
- Expected delta
- +$489/yr (+$41/mo · 34.0%)
ⓘ Screening estimate from a state-policy table — verify with the county assessor before closing.
Nearby sold comps map
Loading sold comps map…
Walkable amenities ~0.75 mi
Loading nearby amenities…
Taxation est. · year 1
- Rental income
- $29,148
- − Mortgage interest
- −$8,677
- − Property taxes
- −$1,438
- − Insurance
- −$774
- − Repairs & maintenance
- −$2,332
- − Management
- −$2,332
- − Depreciation
- −$4,506
- Taxable income
- $9,089
- Est. tax owed @ 24.0%
- −$2,181
- After-tax cash flow
- $8,885/yr
For passive investors: Depreciation is non-cash, so a rental often shows a tax loss while cash-flowing — sheltering income. Rental losses are passive: they offset passive income freely, and up to $25,000/yr can offset ordinary (W-2) income if you actively participate and your MAGI is under $100k (phasing out to $0 by $150k); unused losses carry forward. On sale, claimed depreciation is recaptured at up to 25%, and gains may owe capital-gains tax (a 1031 exchange can defer both). Figures are a year-1 estimate at your 24.0% rate — not tax advice; consult a CPA.
Schools (NCES district)
- District
- Bellefontaine City
- NCES district ID
- 3904358
- Math proficiency
- 55% ▼ -10.00%
- Reading proficiency
- 59% ▼ -6.00%
- Median HH income
- $43,270
- Composite
- 47.94/100
- National rank
- #2207
- State rank
- #348 of 656 in OH
Livability — Bellefontaine
- Score
- 76/100
- State rank
- #213
- US rank
- #3316
Category grades
Schools grade is shown separately in the Schools card above.
Census & demographics
- Census place
- Bellefontaine, OH
- County
- Logan · 47,256 people
- City population
- 20,074
- Population (ZIP)
- 20,074
- Household income
- $64,217
- Rent vs Own
- Severe rent burden
- 10.1
Population outlook (Logan County) Hauer SSP2
- Today (2025)
- 44,240 people
- By 2030
- 43,166 · -2.4%
- By 2040
- 40,495 · -8.5%
- By 2050
- 37,511 · -15.2%
- By 2075
- 30,453 · -31.2%
- By 2100
- 23,081 · -47.8%
Race, ethnicity, and origin ACS 2023
- Neighborhood character
- Predominantly White (90%)
- Race & ethnicity
- White 90% Two or more races 5% Black 3% Hispanic / Latino 2%
- Common ancestry
- Italian 4% Slovak 4% Lithuanian 2%
- Foreign-born
- 2% · Canada
- Languages at home
- 98% English-only · Spanish 1%
Political lean MEDSL · Logan
- 2024 margin
- Solid R (+56.2) · D 21.5% · R 77.7%
- 2008→2024 swing
- -29.6pp toward R · 2008: -26.6pp · 2024: -56.2pp
- All cycles
- 2024: R+56.2 2020: R+55.2 2016: R+52.6 2012: R+31.8 2008: R+26.6
Not yet ingested
- Civics
- —
Market trends
- HPI YoY
- ▼ -182.18%
- Current HPI
- 243.9954
- Rent YoY
- —
- Metro
- —
- State GDP YoY
- ▲ 1.98%
- F500 in state
- 48
Industry mix (Fortune 500 HQ in OH)
| Industry | F500 HQs | Revenue |
|---|---|---|
| Insurance | 3 | $145B |
|
||
| Industrial Machinery | 3 | $49B |
|
||
| Financial Services | 3 | $24B |
|
||
| Consumer Goods | 2 | $93B |
|
||
| Aerospace / Defense | 2 | $47B |
|
||
| Utilities | 2 | $33B |
|
||
Price history
+162.5% since first listed8 events — show timeline
- 2026-06-13 Listed $154,900 WRIST
- 2026-01-16 Pending — WRIST
- 2026-01-16 Listing Removed — WRIST
- 2025-03-04 Listing Removed — WRIST
- 2025-02-28 Listed $159,999 WRIST
- 2024-12-09 Price Changed $159,999 WRIST
- 2024-10-01 Listed $169,999 WRIST
- 2000-04-19 Sold (Public Records) $59,000 Public Records
Property tax history
+6.0%/yrLatest (2025): $1,438 · +34.3% YoY. Source: county tax records.
Cash-flow waterfall
monthlySold comps — $/sqft
last 12 mo · ≤1 miLoading sold comps…