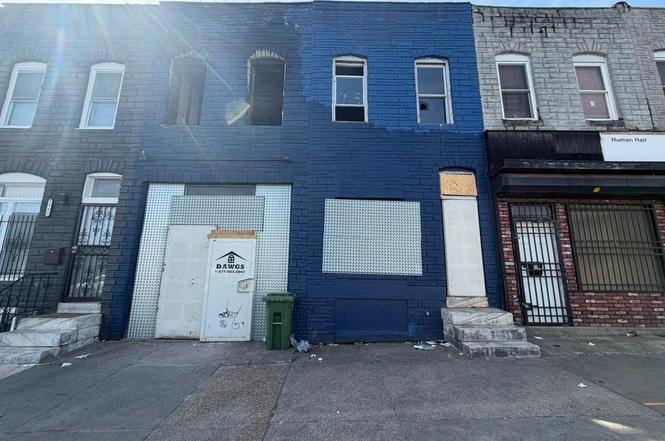
2529-2531 E Monument St · Baltimore, MD
Flood risk No data
- FEMA flood zone
- —
- Chance of flooding over 30 yrs
- —
- Est. flood insurance / yr
- —
Fire risk No data
- Est. fire insurance / yr
- —
Heat risk No data
- Hot days now (above threshold)
- —
- Hot days in 30 yrs
- —
Wind risk No data
- Chance of severe wind over 30 yrs
- —
Air-quality risk No data
- Unhealthy air days now
- —
- Unhealthy air days in 30 yrs
- —
Risk factors via First Street. Map © Google.
Why this score? — see what drove the B- grade
The composite is a weighted blend of 9 inputs, each scored 0–100. Each bar is that input's sub-score; the figure is the points it added to the 100-point composite (weight × sub-score).
- Cash flow +30.0/30.0
- 1% rule +10.0/10.0
- DSCR +10.0/10.0
- ARV discount +7.5/15.0
- Rent growth +5.0/5.0
- Livability +3.8/5.0
- Condition / age +2.5/5.0
- Schools +1.0/10.0
- Appreciation +0.0/10.0
$80,900
🖨 Deal sheet 📄 Offer letter ✓ Due diligence
Listing remarks
Affordable building offering a versatile mixed-use opportunity in a high-demand corridor near Johns Hopkins Hospital. This is a unique opportunity for business or live and work space. The first floor features the potential of a retail space suitable for a wide range of business uses. The second floor offers the potential of a spacious living area that can be used as an owner-occupied residence or as an income-producing unit to help offset the mortgage. Ideally located near established retailers, Northeast Market, and Johns Hopkins Hospital, this property benefits from strong foot traffic and convenient access to public transportation, with a bus line directly nearby. An excellent opportunit
Key facts
- Strong foot traffic
- Spacious living area
- Convenient access
Tags
Property features AI
Finance
- Other: Fee simple ownership
Exterior
- Parking: On-street parking
- Utilities: Public water; Public septic
- Home design: Interior townhouse/rowhouse; Located within city limits (Baltimore City)
- Construction: Brick exterior; Permanent foundation; Year built per assessor
- Exterior features: Brick construction; Above-grade and below-grade structures noted
Interior
- Bedrooms: Three bedrooms on the main level
- Bathrooms: One full bathroom on the main level
- Interior features: Full unfinished basement
Neighborhood map
What this means for you Summary
Snapshot
- This is a 3-bed/1.0-bath townhouse listed at $81k.
Deal economics
- At list price, monthly cash flow is $1k ($16k/yr) — positive.
- The deal already cash-flows at list — no discount required.
- Meets the 1% rule at list price ($2k rent vs $81k).
- Cap rate 26.0% vs local median 6.0% in Baltimore — top-decile yield for the area; either an underpriced asset or a hidden risk that comps aren't pricing in. Stress-test before assuming the spread holds.
Location & tenants
- Location reads 76/100 on livability (#90 in MD, #3,396 nationally) — a middle-class / working-renter tenant base. Strengths: amenities A+, commute A+, housing A+; Watch: schools D, crime F.
- Baltimore City Public Schools (urban): math 7% / reading 16% proficiency, ranked #24 of 24 in MD (top 100%) — low school quality limits family demand, transient renter base, plan for 1-2y turnover; 79% free/reduced lunch — lower-income household profile, screen leases tightly.
- Market conditions: Rents rising fast (+9.9%/yr); 143 active listings in the ZIP; 40 comparable units currently listed for rent nearby; rentals lingering (median 44d on market — plan ~5-8 weeks vacancy on turnover, expect pricing pressure); 50% of comp listings sitting > 30 days — soft ceiling on asking rent; lower-income renter base — watch delinquency; 1,273 units permitted in Baltimore city in 2024 (1,104 in 5+ unit buildings).
- At $2,386/mo this rent would consume 66% of the median local household income ($43k/yr) (locally 966% of renters already pay >50% of income on rent) — very limited rent-growth headroom before tenants either downsize or default.
Forward outlook
- Local home prices are declining (-3.0%/yr); year-one equity from $559 of loan paydown is wiped out by about $2k of value loss. Plan a longer hold.
- Baltimore County population projected to shrink 4% by 2050 — rents likely to lag national; underwrite the cash flow, not the appreciation.
- At projected returns (-3.0% appreciation + 8.0% rent growth), your $23k cash investment doubles in ~2 years — after that, you're playing with house money.
Negotiation context
- Only 1 days on market — expect competitive offers; lowballing is unlikely to land.
- 3 sale attempts since 4y ago with the ask held roughly flat each time — persistent listings suggest the price (not the market) is what's stuck; bring a comps-based counter.
Risks & watch-outs
- Watch-outs: built in 1890 — expect roof / HVAC / electrical / plumbing capex.
Questions for the listing agent
- Built in 1890 — when were the roof, HVAC, electrical panel, plumbing, and water heater last replaced?
- Is there a deadline driving the sale (1031 exchange, divorce, estate, relocation)? That informs how much negotiation room exists.
- Schools are D-rated, which usually means shorter tenancies and higher turnover. Who's the typical renter profile here, and what's been the actual vacancy rate?
- Crime grade is F in this area — have there been break-ins, vandalism, or insurance claims at this property in the last 3 years? What carrier currently insures it and at what premium?
- What's the average days-on-market for RENTAL listings here right now (not sales)? A rising rental-DOM trend means longer vacancies and softer asking-rent achievability than the comps imply.
- What's the recent tenant-quality profile in this submarket — average credit score on applications, eviction rate, late-payment / NSF rate, and stable-employment percentage? A property-management company in the area should have these aggregated.
- How much new for-sale + rental construction is in the pipeline within 1–3 miles? Heavy new supply typically softens prices + rents 12–24 months out; constrained supply supports both.
Investment metrics
- 1% rule
- 2.95% ✓
- Cap rate
- 25.96%
- Cash-on-cash
- 70.24%
- DSCR
- 4.13
- GRM
- 2.8
CMA / ARV
- ARV (on-the-fly)
- $437,155
- Comps found
- 12
Show comp detail 12 sales within ~0.75 mi
| Address | Dist | Beds/Ba | Sqft | Sold | Price | $/sf | Match |
|---|---|---|---|---|---|---|---|
| 3121 Mcelderry St | 0.45mi | 3/3.0 | 2,316 (-2%) | 0mo | $269,900 | $117 | 67 |
| 532 N Luzerne Ave | 0.09mi | 4/3.5 (+1) | 2,172 (-8%) | 0mo | $255,000 | $117 | 67 |
| 805 N Patterson Park Ave | 0.22mi | 4/4.5 (+1) | 2,552 (+8%) | 1mo | $280,000 | $110 | 57 |
| 2010 E Lombard St | 0.68mi | 3/3.5 | 2,383 (+1%) | 1mo | $500,000 | $210 | 56 |
| 219 N Belnord Ave | 0.27mi | 4/3.5 (+1) | 2,082 (-12%) | 3mo | $300,000 | $144 | 50 |
| 2038 E Pratt St | 0.71mi | 3/3.0 | 2,227 (-6%) | 0mo | $570,000 | $256 | 49 |
| 2119 E Lombard St E | 0.64mi | 4/2.5 (+1) | 2,564 (+8%) | 0mo | $760,000 | $296 | 45 |
| 37 S Washington St | 0.67mi | 2/2.5 (-1) | 2,180 (-8%) | 1mo | $360,000 | $165 | 44 |
| 3105 E Baltimore St | 0.63mi | 3/3.0 | 2,102 (-11%) | 2mo | $430,588 | $205 | 43 |
| 2820 E Baltimore St | 0.50mi | 4/2.5 (+1) | 2,044 (-14%) | 2mo | $525,000 | $257 | 42 |
| 21 N Decker Ave | 0.56mi | 2/2.5 (-1) | 2,040 (-14%) | 4mo | $320,000 | $157 | 37 |
| 108 S Washington St | 0.72mi | 4/4.0 (+1) | 2,692 (+14%) | 0mo | $499,000 | $185 | 26 |
Match score weights: distance 35% · size 25% · config 20% · recency 20%. Top-matched comps best support the ARV.
Projected returns pro-forma
-3.0% appreciation · 8.0% rent growth · sell at horizon
- IRR
- 75.4%
- Equity multiple
- 4.71×
- Total profit
- $83,981
- Equity at exit
- $12,062
- IRR
- 80.5%
- Equity multiple
- 11.57×
- Total profit
- $239,402
- Equity at exit
- $6,995
Cash invested: $22,652 (down + closing). Projections, not guarantees.
Landlord ↔ Tenant lean methodology
- Overall (CITY)
- 12 Strongly Tenant-Friendly
- State Maryland
- 27 Tenant-Leaning · D+14
- County
- — inherits STATE
- City Baltimore
- 12 Strongly Tenant-Friendly · D+58
ZIP-level market 21205
- Home prices YoY
- -5.8%
- Rents YoY
- 9.9%
- Active inventory
- 143
- Price-to-rent
- 2.8×
Monthly cashflow live
- Estimated rent
- $2,386 high interval (Pro) →
- Mortgage (P&I)
- −$424
- Tax est. 1.5%
- −$101 /mo · $1,214/yr
- Insurance
- −$34
- HOA
- −$0
- Vacancy / Maint / Mgmt
- −$501
- Net cashflow
- $1,326
Break-even live
UW: 25.0% down · 7.5% · 30yr · 1.5% tax · 5.0% vac · 8.0% maint · 8.0% mgmt
Financing live
Cash to close
- Down payment
- $20,225
- Closing costs
- $2,427
- Reserves months
- —
- Total cash needed
- —
Loan-product check · same deal, 3 products live
Conventional
25% down · 7.5% · 30yr
- Down + closing
- —
- Monthly P&I
- —
- Monthly cashflow
- —
- DSCR
- —
- Eligible?
- —
Personal DTI + credit; lowest rate.
DSCR
20% down · 8.5% · 30yr
- Down + closing
- —
- Monthly P&I
- —
- Monthly cashflow
- —
- DSCR
- —
- Eligible?
- —
No personal income docs; deal must DSCR.
Hard money
10% down · 12.0% · 12mo
- Down + closing
- —
- Monthly P&I
- —
- Monthly cashflow
- —
- DSCR
- —
- Eligible?
- —
Short-term bridge; refi at stabilization.
Rent comps 40 comps
| Address | Beds | Baths | Sqft | Rent | $/sqft | DOM | Units | Dist |
|---|---|---|---|---|---|---|---|---|
| 539 N Luzerne Ave Baltimore, MD | 3.0 | 2.5 | 1702 | $2,300 | $1.35 | 43d | 1 | 0.10mi |
| 537 N Lakewood Ave Baltimore, MD | 3.0 | 3.5 | 1755 | $2,050 | $1.17 | 43d | 1 | 0.14mi |
| 2431 McElderry St Baltimore, MD | 4.0 | 2.5 | 1600 | $2,100 | $1.31 | 43d | 1 | 0.14mi |
| 533 N Lakewood Ave Baltimore, MD | 4.0 | 3.5 | 1758 | $4,500 | $2.56 | 43d | 1 | 0.14mi |
| 733 N Linwood Ave Baltimore, MD | 4.0 | 3.0 | 2410 | $2,150 | $0.89 | 43d | 1 | 0.25mi |
| 233 N Luzerne Ave Baltimore, MD | 3.0 | 2.5 | 1700 | $2,250 | $1.32 | 22d | 1 | 0.26mi |
| 809 N Curley St Baltimore, MD | 3.0 | 1.0 | 1746 | $1,400 | $0.80 | 22d | 1 | 0.30mi |
| 2903 Jefferson St Baltimore, MD | 3.0 | 3.0 | 1609 | $1,850 | $1.15 | 43d | 1 | 0.31mi |
| 2619 E Fayette St Baltimore, MD | 3.0 | 2.0 | 1600 | $1,900 | $1.19 | 43d | 1 | 0.32mi |
| 143 N Patterson Park Ave Baltimore, MD | 4.0 | 3.5 | 1650 | $3,700 | $2.24 | 24d | 1 | 0.40mi |
| 141 N Patterson Park Ave Baltimore, MD | 3.0 | 3.5 | 2264 | $2,300 | $1.02 | 43d | 1 | 0.40mi |
| 2200 E Fayette St Unit 2 2ND FLOOR Baltimore, MD | 2.0 | 1.0 | 2205 | $1,500 | $0.68 | 43d | 1 | 0.42mi |
| 2706 E Biddle St Baltimore, MD | 3.0 | 2.0 | 1577 | $1,395 | $0.88 | 43d | 1 | 0.42mi |
| 2040 Orleans St Baltimore, MD | 4.0 | 1.5 | 1974 | $2,100 | $1.06 | 15d | 1 | 0.45mi |
| 11 N Streeper St Baltimore, MD | 3.0 | 3.5 | 1800 | $2,600 | $1.44 | 43d | 1 | 0.49mi |
| 107 N Chester St Unit 2 Baltimore, MD | 3.0 | 1.0 | 1750 | $2,750 | $1.57 | 43d | 1 | 0.51mi |
| 113 N Decker Ave Baltimore, MD | 3.0 | 3.5 | 1800 | $2,850 | $1.58 | 24d | 1 | 0.52mi |
| 2115 E Fairmount Ave Baltimore, MD | 3.0 | 2.5 | 1736 | $2,795 | $1.61 | 24d | 1 | 0.53mi |
| 2206 E Baltimore St Baltimore, MD | 3.0 | 2.5 | 2612 | $2,900 | $1.11 | 22d | 1 | 0.54mi |
| 10 N Ellwood Ave Baltimore, MD | 4.0 | 2.5 | 1768 | $2,500 | $1.41 | 43d | 1 | 0.58mi |
| 2621 E Oliver St Baltimore, MD | 3.0 | 2.0 | 1600 | $1,700 | $1.06 | 24d | 1 | 0.61mi |
| 1403 N Linwood Ave Baltimore, MD | 3.0 | 2.0 | 1660 | $1,995 | $1.20 | 43d | 1 | 0.62mi |
| 3212 E Baltimore St Baltimore, MD | 2.0 | 3.0 | 1931 | $2,350 | $1.22 | 24d | 1 | 0.66mi |
| 1728 Lantern Mews Baltimore, MD | 3.0 | 3.0 | 1600 | $2,700 | $1.69 | 18d | 1 | 0.69mi |
| 1724 Lantern Mews Baltimore, MD | 2.0 | 4.0 | 1610 | $2,600 | $1.61 | 24d | 1 | 0.69mi |
| 1716 Lantern Mews Baltimore, MD | 4.0 | 5.0 | 2016 | $2,700 | $1.34 | 43d | 1 | 0.71mi |
| 2522 E Federal St Baltimore, MD | 2.0 | 2.0 | 1760 | $1,400 | $0.80 | 43d | 1 | 0.71mi |
| 1901 E Lombard St Baltimore, MD | 2.0 | 1.0 | 2054 | $2,200 | $1.07 | 44d | 1 | 0.77mi |
| 14 S Ann St Baltimore, MD | 3.0 | 2.5 | 2850 | $2,550 | $0.89 | 11d | 1 | 0.81mi |
| 1818 E Pratt St Apt A Baltimore, MD | 3.0 | 2.5 | 1736 | $2,500 | $1.44 | 18d | 1 | 0.85mi |
| 249 S East Ave Baltimore, MD | 2.0 | 2.0 | 1680 | $2,250 | $1.34 | 24d | 1 | 0.85mi |
| 300 S Robinson St Baltimore, MD | 4.0 | 3.5 | 2604 | $3,500 | $1.34 | 43d | 1 | 0.86mi |
| 1607 E Biddle St Baltimore, MD | 4.0 | 3.5 | 2160 | $2,400 | $1.11 | 24d | 1 | 0.87mi |
| 250 S Washington St Baltimore, MD | 4.0 | 3.5 | 2261 | $2,595 | $1.15 | 24d | 1 | 0.88mi |
| 1829 N Port St Baltimore, MD | 3.0 | 1.5 | 2000 | $1,625 | $0.81 | 43d | 1 | 0.90mi |
| 104 N Dallas St Baltimore, MD | 3.0 | 2.5 | 1584 | $2,500 | $1.58 | 22d | 1 | 0.95mi |
| 1904 Bank St Baltimore, MD | 3.0 | 3.5 | 1792 | $3,250 | $1.81 | 43d | 1 | 0.96mi |
| 602 S Streeper St Baltimore, MD | 4.0 | 3.0 | 1980 | $3,200 | $1.62 | 24d | 1 | 0.99mi |
| 1532 N Broadway Baltimore, MD | 3.0 | 4.0 | 2696 | $2,700 | $1.00 | 3d | 1 | 0.99mi |
| 2217 Fleet St Baltimore, MD | 3.0 | 2.0 | 1598 | $2,700 | $1.69 | 11d | 1 | 1.00mi |
Listing history 2 events
-
2026-06-19remarks 699-char remark
-
2026-06-19$80,900 Active 1 DOM
ⓘ Source: listings_history table (triggers on properties + properties_extension) + one-shot
backfill from property_details.listing_events for pre-trigger history.
Nearby sold comps map
Loading sold comps map…
Walkable amenities ~0.75 mi
Loading nearby amenities…
Taxation est. · year 1
- Rental income
- $28,632
- − Mortgage interest
- −$4,532
- − Property taxes
- −$1,214
- − Insurance
- −$404
- − Repairs & maintenance
- −$2,291
- − Management
- −$2,291
- − Depreciation
- −$2,353
- Taxable income
- $15,548
- Est. tax owed @ 24.0%
- −$3,731
- After-tax cash flow
- $12,179/yr
For passive investors: Depreciation is non-cash, so a rental often shows a tax loss while cash-flowing — sheltering income. Rental losses are passive: they offset passive income freely, and up to $25,000/yr can offset ordinary (W-2) income if you actively participate and your MAGI is under $100k (phasing out to $0 by $150k); unused losses carry forward. On sale, claimed depreciation is recaptured at up to 25%, and gains may owe capital-gains tax (a 1031 exchange can defer both). Figures are a year-1 estimate at your 24.0% rate — not tax advice; consult a CPA.
Schools (NCES district)
- District
- Baltimore City Public Schools
- NCES district ID
- 2400090
- Math proficiency
- 7% ▼ -9.00%
- Reading proficiency
- 16% ▼ -5.00%
- Median HH income
- $42,108
- Composite
- 10.08/100
- National rank
- #9805
- State rank
- #24 of 24 in MD
Livability — Baltimore
- Score
- 76/100
- State rank
- #90
- US rank
- #3396
Category grades
Schools grade is shown separately in the Schools card above.
Census & demographics
- Census place
- Baltimore, MD
- County
- Baltimore City · 558,601 people
- City population
- 588,727
- Metro
- Baltimore-Columbia-Towson, MD
- Population (ZIP)
- 13,013
- Household income
- $43,176
- Rent vs Own
- Severe rent burden
- 966.0
Population outlook (Baltimore County) Hauer SSP2
- Today (2025)
- 624,249 people
- By 2030
- 621,541 · -0.4%
- By 2040
- 609,756 · -2.3%
- By 2050
- 597,249 · -4.3%
- By 2075
- 552,236 · -11.5%
- By 2100
- 513,934 · -17.7%
Race, ethnicity, and origin ACS 2023
- Neighborhood character
- Diverse neighborhood (Simpson 0.60)
- Race & ethnicity
- Black 60% Hispanic / Latino 16% White 14% Two or more races 11% Asian 3%
- Hispanic origin (detail)
- Mexican 1% Cuban 1% Dominican 4%
- Common ancestry
- Slovak 3% Romanian 1%
- Foreign-born
- 16% · Canada, China
- Languages at home
- 79% English-only · Spanish 11% Arabic 4% Chinese 1%
Political lean MEDSL · Baltimore
- 2024 margin
- Solid D (+73.0) · D 85.2% · R 12.2% · Other 2.6%
- 2008→2024 swing
- -2.5pp toward R · 2008: 75.5pp · 2024: 73.0pp
- All cycles
- 2024: D+73.0 2020: D+76.6 2016: D+74.6 2012: D+76.4 2008: D+75.5
Not yet ingested
- Civics
- —
Market trends
- HPI YoY
- ▼ -15.03%
- Current HPI
- 244.1345
- Rent YoY
- ▲ 9.88%
- Metro
- Baltimore-Columbia-Towson, MD
- State GDP YoY
- ▲ 2.97%
- F500 in state
- 12
Industry mix (Fortune 500 HQ in MD)
| Industry | F500 HQs | Revenue |
|---|---|---|
| Aerospace / Defense | 1 | $71B |
|
||
| Utilities | 1 | $25B |
|
||
| Hotels | 1 | $24B |
|
||
| Consumer Goods | 1 | $7B |
|
||
| Real Estate | 1 | $6B |
|
||
| Chemicals | 1 | $2B |
|
||
Price history
+1.3% since first listed5 events — show timeline
- 2026-06-18 Listed $80,900 BRIGHT MLS
- 2022-07-12 Listing Removed — BRIGHT MLS
- 2022-06-13 Relisted — BRIGHT MLS
- 2022-06-12 Listing Removed — BRIGHT MLS
- 2022-05-19 Listed $79,900 BRIGHT MLS
Cash-flow waterfall
monthlySold comps — $/sqft
last 12 mo · ≤1 miLoading sold comps…