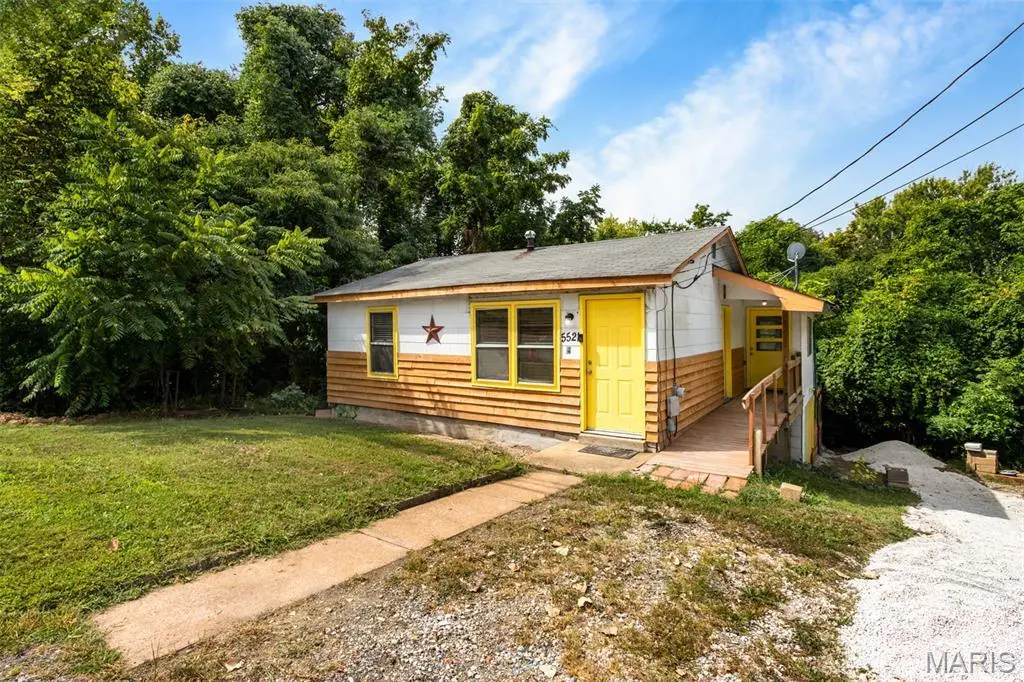
5521 US Highway 61 67 · Imperial, MO
Flood risk 1/10 · Minimal
- FEMA flood zone
- X (unshaded)
- Chance of flooding over 30 yrs
- 0.0%
- Est. flood insurance / yr
- $507 – $1,088
Fire risk 3/10 · Minor
- Est. fire insurance / yr
- $1,054 – $1,958
Heat risk 5/10 · Moderate
- Hot days now (above 107°F)
- 7 days/yr
- Hot days in 30 yrs
- 20 days/yr
Wind risk 2/10 · Minimal
- Chance of severe wind over 30 yrs
- 1.0%
Air-quality risk 2/10 · Minimal
- Unhealthy air days now
- 0 days/yr
- Unhealthy air days in 30 yrs
- 3 days/yr
Risk factors via First Street. Map © Google.
Why this score? — see what drove the C grade
The composite is a weighted blend of 9 inputs, each scored 0–100. Each bar is that input's sub-score; the figure is the points it added to the 100-point composite (weight × sub-score).
- Cash flow +20.6/30.0
- ARV discount +15.0/15.0
- DSCR +6.6/10.0
- 1% rule +4.3/10.0
- Schools +3.4/10.0
- Livability +3.1/5.0
- Rent growth +2.5/5.0
- Condition / age +2.5/5.0
- Appreciation +0.0/10.0
$175,000
🖨 Deal sheet 📄 Offer letter ✓ Due diligence
Listing remarks MLS
Darling little Bungalow/Cottage minutes from everything. Many updates since last sold. New paint, hardwood floors restored, overgrown plants removed, drainage system installed, new gravel driveway, newer HVAC (2025) new square D electric panel and wiring. new ceiling fixtures throughout. New smoke and CO2 detectors. Great first home or investment property.
Key facts
- New gravel driveway
- New paint
- Newer hvac
Tags
Neighborhood map
What this means for you Summary
Snapshot
- This is a 2-bed/1.0-bath other listed at $175k.
Deal economics
- At list price, monthly cash flow is $235 ($3k/yr) — positive.
- The deal already cash-flows at list — no discount required.
- To meet the 1% rule (rent ≥ 1% of price), the offer needs to be $163k (6.7% below list).
- Recommended offer: $163k (6.7% below list) — sets the bar for 1% rule.
- Cap rate 7.9% vs local median 3.3% in Imperial — top-decile yield for the area; either an underpriced asset or a hidden risk that comps aren't pricing in. Stress-test before assuming the spread holds.
Location & tenants
- Location reads 62/100 on livability (#389 in MO) — a middle-class / working-renter tenant base. Strengths: cost of living A+, housing A+, crime B; Watch: schools D+, amenities F, commute F.
- Windsor C-1 (suburban): math 30% / reading 44% proficiency, ranked #154 of 324 in MO (top 48%) — families likely to look elsewhere, expect single-tenant / working-renter base with shorter leases.
- Market conditions: 123 active listings in the ZIP; 3 comparable units currently listed for rent nearby; rentals leasing fast (median 2d on market — plan ~1-2 weeks tenant-placement turnaround); solid renter incomes; 807 units permitted in Jefferson County in 2024 (104 in 5+ unit buildings).
Forward outlook
- Local home prices are declining (-3.0%/yr); year-one equity from $1k of loan paydown is wiped out by about $5k of value loss. Plan a longer hold.
Negotiation context
- It's been on market 71 days — a 6% lower offer ($164k) is reasonable based on typical stale-listing flexibility.
- 4 sale attempts since 4y ago with the ask held roughly flat each time — persistent listings suggest the price (not the market) is what's stuck; bring a comps-based counter.
Risks & watch-outs
- Watch-outs: built in 1948 — expect roof / HVAC / electrical / plumbing capex.
- Climate carrying-cost: extreme-heat days projected 7→20/yr by 2055 (HVAC capex compounding) — expect insurance premiums to compound above CPI over the hold.
Questions for the listing agent
- It's been on market 71 days. Have you received any prior offers? Is the seller open to a 7% concession, seller financing, or rate buy-down credit?
- Built in 1948 — when were the roof, HVAC, electrical panel, plumbing, and water heater last replaced?
- Why hasn't it sold? Are there any deal-killer items the seller is aware of (foundation, flood, title, zoning, code violations)?
- Is there a deadline driving the sale (1031 exchange, divorce, estate, relocation)? That informs how much negotiation room exists.
- Schools are D-rated, which usually means shorter tenancies and higher turnover. Who's the typical renter profile here, and what's been the actual vacancy rate?
- What's the average days-on-market for RENTAL listings here right now (not sales)? A rising rental-DOM trend means longer vacancies and softer asking-rent achievability than the comps imply.
- What's the recent tenant-quality profile in this submarket — average credit score on applications, eviction rate, late-payment / NSF rate, and stable-employment percentage? A property-management company in the area should have these aggregated.
- How much new for-sale + rental construction is in the pipeline within 1–3 miles? Heavy new supply typically softens prices + rents 12–24 months out; constrained supply supports both.
Investment metrics
- 1% rule
- 0.93% ✗
- Cap rate
- 7.90%
- Cash-on-cash
- 5.74%
- DSCR
- 1.26
- GRM
- 8.9
CMA / ARV
- ARV (median comp)
- $226,883
- List price
- $175,000
- Delta
- -22.87%
- Verdict
- UNDERPRICED
- Comps
- 20 within 1.0 mi
Projected returns pro-forma
-3.0% appreciation · 3.0% rent growth · sell at horizon
- IRR
- -7.5%
- Equity multiple
- 0.72×
- Total profit
- $-13,490
- Equity at exit
- $26,093
- IRR
- 2.1%
- Equity multiple
- 1.15×
- Total profit
- $7,203
- Equity at exit
- $15,131
Cash invested: $49,000 (down + closing). Projections, not guarantees.
Landlord ↔ Tenant lean methodology
- Overall (STATE)
- 81 Strongly Landlord-Friendly
- State Missouri
- 81 Strongly Landlord-Friendly · R+10
- County
- — inherits STATE
- City
- — inherits STATE
ZIP-level market 63052
- Active inventory
- 123
- Price-to-rent
- 8.9×
Monthly cashflow live
- Estimated rent
- $1,633 medium interval (Pro) →
- Mortgage (P&I)
- −$918
- Tax from tax record
- −$65 /mo · $777/yr
- Insurance
- −$73
- HOA
- −$0
- Vacancy / Maint / Mgmt
- −$343
- Net cashflow
- $235
Break-even live
UW: 25.0% down · 7.5% · 30yr · 1.5% tax · 5.0% vac · 8.0% maint · 8.0% mgmt
Financing live
Cash to close
- Down payment
- $43,750
- Closing costs
- $5,250
- Reserves months
- —
- Total cash needed
- —
Loan-product check · same deal, 3 products live
Conventional
25% down · 7.5% · 30yr
- Down + closing
- —
- Monthly P&I
- —
- Monthly cashflow
- —
- DSCR
- —
- Eligible?
- —
Personal DTI + credit; lowest rate.
DSCR
20% down · 8.5% · 30yr
- Down + closing
- —
- Monthly P&I
- —
- Monthly cashflow
- —
- DSCR
- —
- Eligible?
- —
No personal income docs; deal must DSCR.
Hard money
10% down · 12.0% · 12mo
- Down + closing
- —
- Monthly P&I
- —
- Monthly cashflow
- —
- DSCR
- —
- Eligible?
- —
Short-term bridge; refi at stabilization.
Rent comps 3 comps
| Address | Beds | Baths | Sqft | Rent | $/sqft | DOM | Units | Dist |
|---|---|---|---|---|---|---|---|---|
| 936 Guenzler Dr Imperial, MO | 3.0 | 2.0 | 768 | $1,950 | $2.54 | 1d | 1 | 0.03mi |
| 1000 Willow Bend Rd Imperial, MO | 2.0–3.0 | 1.0–2.0 | 1098 | $911 | $0.83 | 1d | 1 | 0.39mi |
| 5256 Skyline Ct Imperial, MO | 3.0 | 1.0 | 912 | $1,655 | $1.81 | 1d | 1 | 0.44mi |
Listing history 26 events
-
2026-06-18days on market $175,000 Active 71 DOM
-
2026-06-17days on market $175,000 Active 70 DOM
-
2026-06-16days on market $175,000 Active 69 DOM
-
2026-06-15days on market $175,000 Active 68 DOM
-
2026-06-13days on market $175,000 Active 66 DOM
-
2026-06-13days on market $175,000 Active 65 DOM
-
2026-06-09days on market $175,000 Active 62 DOM
-
2026-06-08days on market $175,000 Active 61 DOM
-
2026-06-07days on market $175,000 Active 60 DOM
-
2026-06-03days on market $175,000 Active 56 DOM
-
2026-06-02days on market $175,000 Active 55 DOM
-
2026-06-01days on market $175,000 Active 54 DOM
-
2026-05-31days on market $175,000 Active 53 DOM
-
2026-04-08$175,000 Active 358-char remark
Show marketing remark (358 chars)
Darling little Bungalow/Cottage minutes from everything. Many updates since last sold. New paint, hardwood floors restored, overgrown plants removed, drainage system installed, new gravel driveway, newer HVAC (2025) new square D electric panel and wiring. new ceiling fixtures throughout. New smoke and CO2 detectors. Great first home or investment property.
-
2025-10-12price $195,000
-
2025-09-29price $205,000
-
2025-09-24status Active
-
2025-09-24price $225,000
-
2025-09-23status Pending
-
2025-09-06$250,000 Active
-
2022-05-26soldstatus
-
2022-05-20soldstatus Closed
-
2022-04-18status Pending
-
2022-04-12price $70,000
-
2022-04-02$80,000 Active
-
2022-04-01historical $80,000
ⓘ Source: listings_history table (triggers on properties + properties_extension) + one-shot
backfill from property_details.listing_events for pre-trigger history.
Tax reassessment forecast MO · Resets to sale price
- Current annual tax
- $777 · $65/mo
- Projected year-2 tax
- $1,698 · $141/mo
- Expected delta
- +$921/yr (+$77/mo · 118.5%)
ⓘ Screening estimate from a state-policy table — verify with the county assessor before closing.
Climate risk First Street
- Flood 1/10 Low FEMA zone X (unshaded) · 0% chance over 30 yrs
- Wildfire 3/10 Moderate
- Heat 5/10 Major 7 d/yr ≥107°F today · 20 d/yr by 30 yrs out
- Wind 2/10 Low 100% chance of damaging wind over 30 yrs
- Air quality 2/10 Low 0 unhealthy d/yr today · 3 by 30 yrs out
Nearby sold comps map
Loading sold comps map…
Walkable amenities ~0.75 mi
Loading nearby amenities…
Taxation est. · year 1
- Rental income
- $19,594
- − Mortgage interest
- −$9,803
- − Property taxes
- −$777
- − Insurance
- −$875
- − Repairs & maintenance
- −$1,567
- − Management
- −$1,567
- − Depreciation
- −$5,091
- Taxable loss
- −$87
- Est. tax savings @ 24.0%
- +$21
- After-tax cash flow
- $2,835/yr
For passive investors: Depreciation is non-cash, so a rental often shows a tax loss while cash-flowing — sheltering income. Rental losses are passive: they offset passive income freely, and up to $25,000/yr can offset ordinary (W-2) income if you actively participate and your MAGI is under $100k (phasing out to $0 by $150k); unused losses carry forward. On sale, claimed depreciation is recaptured at up to 25%, and gains may owe capital-gains tax (a 1031 exchange can defer both). Figures are a year-1 estimate at your 24.0% rate — not tax advice; consult a CPA.
Schools (NCES district)
- District
- Windsor C-1
- NCES district ID
- 2932100
- Math proficiency
- 30% ▼ -15.00%
- Reading proficiency
- 44% ▼ -11.00%
- Median HH income
- $66,123
- Composite
- 33.5/100
- National rank
- #5442
- State rank
- #154 of 324 in MO
Livability — Imperial
- Score
- 62/100
- State rank
- #389
- US rank
- #16900
Category grades
Schools grade is shown separately in the Schools card above.
Census & demographics
- Census place
- Imperial, MO
- County
- Jefferson County · 108,544 people
- City population
- 28,712
- Metro
- St. Louis, MO-IL
- Population (ZIP)
- 28,712
- Household income
- $92,922
- Rent vs Own
- Severe rent burden
- 333.0
Population outlook (Jefferson County) Hauer SSP2
- Today (2025)
- 235,088 people
- By 2030
- 238,365 · +1.4%
- By 2040
- 240,156 · +2.2%
- By 2050
- 234,651 · -0.2%
- By 2075
- 214,569 · -8.7%
- By 2100
- 179,697 · -23.6%
Race, ethnicity, and origin ACS 2023
- Neighborhood character
- Predominantly White (91%)
- Race & ethnicity
- White 91% Two or more races 4% Hispanic / Latino 3% Black 1%
- Common ancestry
- Lithuanian 5% Romanian 2% Italian 2%
- Foreign-born
- 2% · Canada
- Languages at home
- 97% English-only · Spanish 2%
Political lean MEDSL · Jefferson
- 2024 margin
- Solid R (+36.7) · D 31.0% · R 67.7% · Other 1.3%
- 2008→2024 swing
- -39.3pp toward R · 2008: 2.5pp · 2024: -36.7pp
- All cycles
- 2024: R+36.7 2020: R+33.9 2016: R+35.3 2012: R+12.7 2008: D+2.5
Not yet ingested
- Civics
- —
Market trends
- HPI YoY
- ▼ -210.31%
- Current HPI
- 196.6159
- Rent YoY
- —
- Metro
- St. Louis, MO-IL
- State GDP YoY
- ▲ 1.84%
- F500 in state
- 20
Industry mix (Fortune 500 HQ in MO)
| Industry | F500 HQs | Revenue |
|---|---|---|
| Healthcare | 1 | $163B |
|
||
| Insurance | 1 | $21B |
|
||
| Industrial Technology | 1 | $17B |
|
||
| Retail | 1 | $16B |
|
||
| Industrial Distribution | 1 | $10B |
|
||
| Utilities | 1 | $9B |
|
||
Price history
+118.8% since first listed13 events — show timeline
- 2026-04-08 Listed $175,000 MARIS as Distributed by MLS Grid
- 2025-10-12 Price Changed $195,000 MARIS as Distributed by MLS Grid
- 2025-09-29 Price Changed $205,000 MARIS as Distributed by MLS Grid
- 2025-09-24 Relisted — MARIS as Distributed by MLS Grid
- 2025-09-24 Price Changed $225,000 MARIS as Distributed by MLS Grid
- 2025-09-23 Pending — MARIS as Distributed by MLS Grid
- 2025-09-06 Listed $250,000 MARIS as Distributed by MLS Grid
- 2022-05-26 Sold (Public Records) — Public Records
- 2022-05-20 Sold (MLS) — MARIS as Distributed by MLS Grid
- 2022-04-18 Pending — MARIS as Distributed by MLS Grid
- 2022-04-12 Price Changed $70,000 MARIS as Distributed by MLS Grid
- 2022-04-02 Listed $80,000 MARIS as Distributed by MLS Grid
- 2022-04-01 Coming Soon $80,000 MARIS as Distributed by MLS Grid
Property tax history
+4.4%/yrLatest (2025): $777 · +2.6% YoY. Source: county tax records.
Cash-flow waterfall
monthlySold comps — $/sqft
last 12 mo · ≤1 miLoading sold comps…