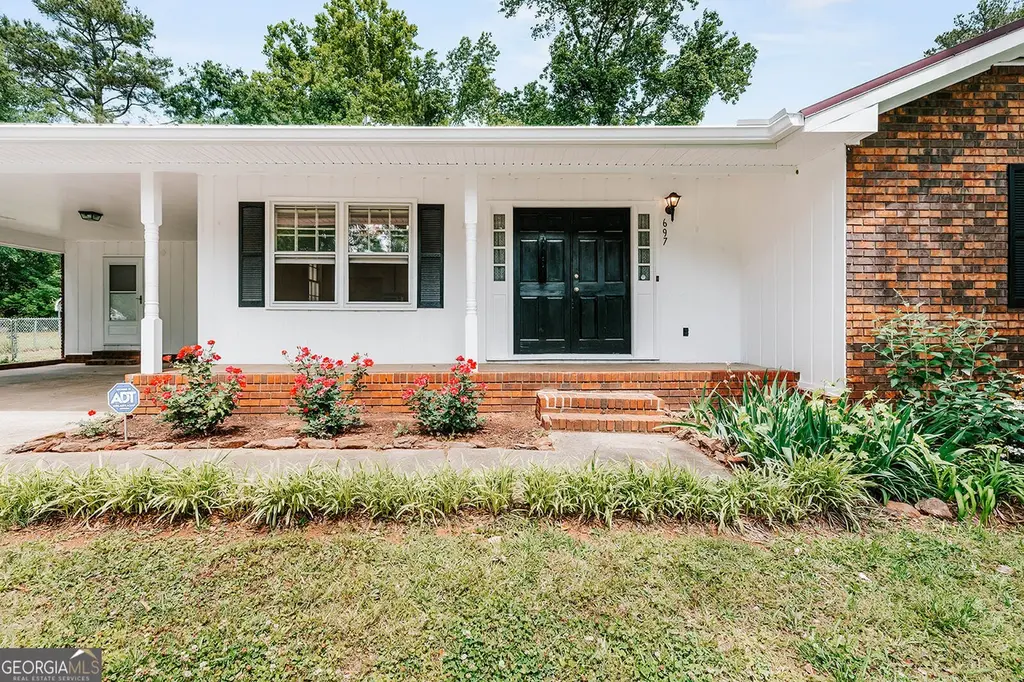
697 Bedford Dr · Athens-Clarke County unified government (balance), GA
Flood risk 1/10 · Minimal
- FEMA flood zone
- X (unshaded)
- Chance of flooding over 30 yrs
- 0.0%
- Est. flood insurance / yr
- $507 – $1,088
Fire risk 3/10 · Minor
- Est. fire insurance / yr
- $963 – $1,789
Heat risk 6/10 · Moderate
- Hot days now (above 105°F)
- 7 days/yr
- Hot days in 30 yrs
- 17 days/yr
Wind risk 6/10 · Moderate
- Chance of severe wind over 30 yrs
- 27.0%
Air-quality risk 4/10 · Minor
- Unhealthy air days now
- 4 days/yr
- Unhealthy air days in 30 yrs
- 5 days/yr
Risk factors via First Street. Map © Google.
Why this score? — see what drove the D grade
The composite is a weighted blend of 9 inputs, each scored 0–100. Each bar is that input's sub-score; the figure is the points it added to the 100-point composite (weight × sub-score).
- ARV discount +10.6/15.0
- Appreciation +9.9/10.0
- Cash flow +7.7/30.0
- Schools +3.7/10.0
- Rent growth +2.5/5.0
- Livability +2.5/5.0
- Condition / age +2.5/5.0
- DSCR +1.8/10.0
- 1% rule +1.7/10.0
$240,000
🖨 Deal sheet 📄 Offer letter ✓ Due diligence
Listing remarks
Welcome to this 3 bedroom, 2 bathroom home nestled in an established neighborhood in Hull. Situated on 0.34 acres, this 1,336 square foot home offers a spacious fenced-in backyard with plenty of room to relax, entertain, garden, or let pets play. Built in 1977, the home has been well-loved over the years and offers a great opportunity for buyers looking to make it their own. While the property does need some updates and repairs, it is priced accordingly and has great potential for a first-time homebuyer, an investor looking for a rental property, or someone searching for their next flip project. With solid bones, a desirable lot, and a convenient location, this home is full of possibilities
Key facts
- New hvac
- New water heater
- Convenient location
Tags
Property features AI
Finance
- Other: Property listed as fixer condition; Lot is approximately 0.34 acres (private)
- HOA & community: No HOA
Exterior
- Parking: Attached carport; Off-street parking
- Utilities: Public water available; Septic tank; Electricity available
- Home design: Single-family residential house; Built in 1977; One story
- Construction: Brick construction; Metal roof; Built in 1977
- Exterior features: Metal roof; Brick construction; Back yard with fencing (private, fenced); Level lot
Interior
- Kitchen: Dishwasher
- Bedrooms: 3 bedrooms on the main level
- Flooring: Hardwood; Laminate; Tile
- Bathrooms: 2 full bathrooms (main level)
- Heating & cooling: Central heating; Central air
- Interior features: Tile bathrooms; Den; Mud room laundry area; One-level layout; One fireplace
- Laundry & utility: Washer; Dryer; Mud room
Neighborhood map
What this means for you Summary
Snapshot
- This is a 3-bed/2.0-bath single-family listed at $240k.
Deal economics
- At list price, monthly cash flow is $-281 ($-3k/yr) — negative.
- To cash-flow at today's rent, offer at most $190k (20.7% below list).
- To meet the 1% rule (rent ≥ 1% of price), the offer needs to be $160k (33.1% below list).
- Recommended offer: $160k (33.1% below list) — sets the bar for 1% rule.
- Cap rate 4.9% vs local median 3.3% in Athens-Clarke County unified government (balance) — top-decile yield for the area; either an underpriced asset or a hidden risk that comps aren't pricing in. Stress-test before assuming the spread holds.
Location & tenants
- Location reads: area grade D — affects rentability + tenant quality, not the cash-flow math above.
- Madison County (rural): math 46% / reading 42% proficiency, ranked #29 of 174 in GA (top 17%) — families likely to look elsewhere, expect single-tenant / working-renter base with shorter leases.
- Zoned schools: Hull-Sanford Elementary School (math 51% / reading 32%, grade F, #402 of 1,228 statewide, top 33%, 518 students, 58% FRL).
- Market conditions: 58 active listings in the ZIP; 5 comparable units currently listed for rent nearby; rentals lingering (median 44d on market — plan ~5-8 weeks vacancy on turnover, expect pricing pressure); 80% of comp listings sitting > 30 days — soft ceiling on asking rent; 189 units permitted in Madison County in 2024 (0 in 5+ unit buildings).
Forward outlook
- In year one you build about $25k of equity ($2k loan paydown + $24k appreciation (9.9% local appreciation)).
- By year 2, paydown + projected appreciation supports a ~$41k cash-out refi (75% LTV) — recoverable capital for the next deal without selling this one.
Negotiation context
- Only 3 days on market — expect competitive offers; lowballing is unlikely to land.
- 5 sale attempts since 26y ago with the ask held roughly flat each time — persistent listings suggest the price (not the market) is what's stuck; bring a comps-based counter.
- Current owner paid $80k; list at $240k implies a 200% gain — meaningful room to come down on a strong offer.
Risks & watch-outs
- Climate carrying-cost: major wind risk, 27% chance of damaging wind over 30y; extreme-heat days projected 7→17/yr by 2055 (HVAC capex compounding) — expect insurance premiums to compound above CPI over the hold.
Questions for the listing agent
- What do current leases actually rent for vs. the listed asking? Can we see a recent rent roll and the last 12 months of T-12 income?
- Built in 1977 — when were the roof, HVAC, electrical panel, plumbing, and water heater last replaced?
- Is there a deadline driving the sale (1031 exchange, divorce, estate, relocation)? That informs how much negotiation room exists.
- The area grade is low — what's the realistic commute time and amenity access for the typical tenant pool here? Any planned neighborhood developments (good or bad) we should know about?
- What's the average days-on-market for RENTAL listings here right now (not sales)? A rising rental-DOM trend means longer vacancies and softer asking-rent achievability than the comps imply.
- What's the recent tenant-quality profile in this submarket — average credit score on applications, eviction rate, late-payment / NSF rate, and stable-employment percentage? A property-management company in the area should have these aggregated.
- How much new for-sale + rental construction is in the pipeline within 1–3 miles? Heavy new supply typically softens prices + rents 12–24 months out; constrained supply supports both.
Investment metrics
- 1% rule
- 0.67% ✗
- Cap rate
- 4.89%
- Cash-on-cash
- -5.01%
- DSCR
- 0.78
- GRM
- 12.5
CMA / ARV
- ARV (on-the-fly)
- $257,848
- Comps found
- 9
Show comp detail 9 sales within ~0.75 mi
| Address | Dist | Beds/Ba | Sqft | Sold | Price | $/sf | Match |
|---|---|---|---|---|---|---|---|
| 838 Virginia Ln | 0.26mi | 3/1.5 | 1,320 (-1%) | 4mo | $255,000 | $193 | 81 |
| 198 Bedford Dr | 0.13mi | 3/2.0 | 1,440 (+8%) | 8mo | $280,000 | $194 | 74 |
| 481 Bedford Dr | 0.19mi | 3/2.0 | 1,440 (+8%) | 6mo | $280,000 | $194 | 74 |
| 525 Virginia Ln | 0.24mi | 3/1.0 | 1,292 (-3%) | 7mo | $241,100 | $187 | 74 |
| 1261 Glenn Carrie Rd | 0.09mi | 3/2.0 | 1,456 (+9%) | 9mo | $289,000 | $198 | 73 |
| 1335 Glenn Carrie Rd | 0.05mi | 3/1.0 | 1,181 (-12%) | 10mo | $120,000 | $102 | 66 |
| 136 Wellington Dr | 0.16mi | 3/2.0 | 1,536 (+15%) | 6mo | $255,000 | $166 | 63 |
| 481 Bedford Dr | 0.20mi | 3/2.0 | 1,475 (+10%) | 20mo | $285,000 | $193 | 57 |
| 550 Bedford Dr | 0.12mi | 3/2.0 | 1,503 (+12%) | 22mo | $285,000 | $190 | 55 |
Match score weights: distance 35% · size 25% · config 20% · recency 20%. Top-matched comps best support the ARV.
Projected returns pro-forma
9.89% appreciation · 3.0% rent growth · sell at horizon
- IRR
- 20.5%
- Equity multiple
- 2.65×
- Total profit
- $111,031
- Equity at exit
- $214,342
- IRR
- 18.7%
- Equity multiple
- 6.07×
- Total profit
- $340,470
- Equity at exit
- $460,261
Cash invested: $67,200 (down + closing). Projections, not guarantees.
Landlord ↔ Tenant lean methodology
- Overall (STATE)
- 90 Strongly Landlord-Friendly
- State Georgia
- 90 Strongly Landlord-Friendly · R+3
- County
- — inherits STATE
- City
- — inherits STATE
ZIP-level market 30646
- Home prices YoY
- 3.2%
- Active inventory
- 58
- Price-to-rent
- 12.5×
Monthly cashflow live
- Estimated rent
- $1,605 high interval (Pro) →
- Mortgage (P&I)
- −$1,259
- Tax from tax record
- −$190 /mo · $2,277/yr
- Insurance
- −$100
- HOA
- −$0
- Vacancy / Maint / Mgmt
- −$337
- Net cashflow
- $-281
Break-even live
UW: 25.0% down · 7.5% · 30yr · 1.5% tax · 5.0% vac · 8.0% maint · 8.0% mgmt
Financing live
Cash to close
- Down payment
- $60,000
- Closing costs
- $7,200
- Reserves months
- —
- Total cash needed
- —
Loan-product check · same deal, 3 products live
Conventional
25% down · 7.5% · 30yr
- Down + closing
- —
- Monthly P&I
- —
- Monthly cashflow
- —
- DSCR
- —
- Eligible?
- —
Personal DTI + credit; lowest rate.
DSCR
20% down · 8.5% · 30yr
- Down + closing
- —
- Monthly P&I
- —
- Monthly cashflow
- —
- DSCR
- —
- Eligible?
- —
No personal income docs; deal must DSCR.
Hard money
10% down · 12.0% · 12mo
- Down + closing
- —
- Monthly P&I
- —
- Monthly cashflow
- —
- DSCR
- —
- Eligible?
- —
Short-term bridge; refi at stabilization.
Rent comps 5 comps
| Address | Beds | Baths | Sqft | Rent | $/sqft | DOM | Units | Dist |
|---|---|---|---|---|---|---|---|---|
| 8805 Highway 29 S Hull, GA | 3.0 | 2.0 | 1440 | $1,700 | $1.18 | 43d | 1 | 0.48mi |
| 661 Maplewood Ln Hull, GA | 2.0 | 1.0 | 924 | $1,450 | $1.57 | 43d | 1 | 0.85mi |
| 492 Briarwood Ln Hull, GA | 4.0 | 2.0 | 1346 | $1,600 | $1.19 | 43d | 1 | 1.07mi |
| 1495 U.S. 29 Unit L-7 Athens, GA | 3.0 | 2.0 | 1056 | $1,470 | $1.39 | 13d | 1 | 1.10mi |
| 164 Glenn Carrie Rd Hull, GA | 2.0 | 1.0 | 928 | $1,675 | $1.80 | 43d | 1 | 1.14mi |
Listing history 17 events
-
2026-05-19status Under Contract
-
2026-05-15$240,000 New
-
2010-09-24soldstatus $80,000
-
2010-09-23soldstatus $80,000
-
2010-07-24price $89,900 Extended
-
2010-07-23historical
-
2010-07-16$89,900
-
2010-01-09price $99,900 Reduced
-
2009-06-17$99,900
-
2008-07-24soldstatus $129,900
-
2007-12-31historical
-
2007-12-19soldstatus $129,900
-
2007-04-19$129,900
-
2000-09-01soldstatus $93,900
-
2000-09-01soldstatus $93,900
-
2000-04-18$96,500
-
1996-05-30soldstatus $74,500
ⓘ Source: listings_history table (triggers on properties + properties_extension) + one-shot
backfill from property_details.listing_events for pre-trigger history.
Tax reassessment forecast GA · Resets to sale price
- Current annual tax
- $2,277 · $190/mo
- Projected year-2 tax
- $2,277 · $190/mo
- Expected delta
- $0/yr ($0/mo · 0.0%)
ⓘ Screening estimate from a state-policy table — verify with the county assessor before closing.
Climate risk First Street
- Flood 1/10 Low FEMA zone X (unshaded) · 0% chance over 30 yrs
- Wildfire 3/10 Moderate
- Heat 6/10 Major 7 d/yr ≥105°F today · 17 d/yr by 30 yrs out
- Wind 6/10 Major 27% chance of damaging wind over 30 yrs
- Air quality 4/10 Moderate 4 unhealthy d/yr today · 5 by 30 yrs out
Nearby sold comps map
Loading sold comps map…
Walkable amenities ~0.75 mi
Loading nearby amenities…
Taxation est. · year 1
- Rental income
- $19,256
- − Mortgage interest
- −$13,444
- − Property taxes
- −$2,277
- − Insurance
- −$1,200
- − Repairs & maintenance
- −$1,540
- − Management
- −$1,540
- − Depreciation
- −$6,982
- Taxable loss
- −$7,728
- Est. tax savings @ 24.0%
- +$1,855
- After-tax cash flow
- $-1,514/yr
For passive investors: Depreciation is non-cash, so a rental often shows a tax loss while cash-flowing — sheltering income. Rental losses are passive: they offset passive income freely, and up to $25,000/yr can offset ordinary (W-2) income if you actively participate and your MAGI is under $100k (phasing out to $0 by $150k); unused losses carry forward. On sale, claimed depreciation is recaptured at up to 25%, and gains may owe capital-gains tax (a 1031 exchange can defer both). Figures are a year-1 estimate at your 24.0% rate — not tax advice; consult a CPA.
Schools (NCES district)
- District
- Madison County
- NCES district ID
- 1303480
- Math proficiency
- 46% ▼ -10.00%
- Reading proficiency
- 42% ▼ -9.00%
- Median HH income
- $43,465
- Composite
- 37.21/100
- National rank
- #4469
- State rank
- #29 of 174 in GA
Livability — Athens-Clarke County unified government (balance)
No livability data for this city. (Only ~50 U.S. cities are tracked.)
Census & demographics
- City population
- 119,110
- Population (ZIP)
- 8,161
Population outlook (Madison County) Hauer SSP2
- Today (2025)
- 28,986 people
- By 2030
- 28,972 · +-0.0%
- By 2040
- 28,711 · -0.9%
- By 2050
- 28,282 · -2.4%
- By 2075
- 28,346 · -2.2%
- By 2100
- 28,189 · -2.7%
Race, ethnicity, and origin ACS 2023
- Neighborhood character
- Predominantly White (70%)
- Race & ethnicity
- White 70% Black 20% Hispanic / Latino 9% Two or more races 3%
- Hispanic origin (detail)
- Mexican 6%
- Common ancestry
- Iranian 6% Slovak 2% Scotch-Irish 1%
- Foreign-born
- 4% · Canada
- Languages at home
- 93% English-only · Spanish 6% German/W. Germanic 1%
Political lean MEDSL · Madison
- 2024 margin
- Solid R (+54.8) · D 22.4% · R 77.2%
- 2008→2024 swing
- -8.4pp toward R · 2008: -46.4pp · 2024: -54.8pp
- All cycles
- 2024: R+54.8 2020: R+53.0 2016: R+56.7 2012: R+53.8 2008: R+46.4
Not yet ingested
- Civics
- —
Market trends
- HPI YoY
- ▲ 9.89%
- Current HPI
- 316.3625
- Rent YoY
- —
- Metro
- —
- State GDP YoY
- ▲ 2.66%
- F500 in state
- 28
Industry mix (Fortune 500 HQ in GA)
| Industry | F500 HQs | Revenue |
|---|---|---|
| Paper / Packaging | 2 | $29B |
|
||
| Retail | 1 | $160B |
|
||
| Transportation / Logistics | 1 | $91B |
|
||
| Airlines | 1 | $62B |
|
||
| Consumer Goods | 1 | $47B |
|
||
| Utilities | 1 | $25B |
|
||
Price history
+222.1% since first listed17 events — show timeline
- 2026-05-19 Pending — GAMLS
- 2026-05-15 Listed $240,000 GAMLS
- 2010-09-24 Sold (Public Records) $80,000 Public Records
- 2010-09-23 Sold (MLS) $80,000 Hive MLS
- 2010-07-24 Price Changed $89,900 GAMLS
- 2010-07-23 Listing Removed — Hive MLS
- 2010-07-16 Listed $89,900 Hive MLS
- 2010-01-09 Price Changed $99,900 GAMLS
- 2009-06-17 Listed $99,900 Hive MLS
- 2008-07-24 Sold (Public Records) $129,900 Public Records
- 2007-12-31 Listing Removed — Hive MLS
- 2007-12-19 Sold (Public Records) $129,900 Public Records
- 2007-04-19 Listed $129,900 Hive MLS
- 2000-09-01 Sold (Public Records) $93,900 Public Records
- 2000-09-01 Sold (MLS) $93,900 Hive MLS
- 2000-04-18 Listed $96,500 Hive MLS
- 1996-05-30 Sold (Public Records) $74,500 Public Records
Property tax history
+11.8%/yrLatest (2025): $2,277 · +12.2% YoY. Source: county tax records.
Cash-flow waterfall
monthlySold comps — $/sqft
last 12 mo · ≤1 miLoading sold comps…