1108 Rosewood Dr · Columbus, GA
Flood risk 3/10 · Minor
- FEMA flood zone
- X (unshaded)
- Chance of flooding over 30 yrs
- 0.09%
- Est. flood insurance / yr
- $507 – $1,088
Fire risk 1/10 · Minimal
- Est. fire insurance / yr
- $963 – $1,789
Heat risk 7/10 · Major
- Hot days now (above 107°F)
- 7 days/yr
- Hot days in 30 yrs
- 19 days/yr
Wind risk 6/10 · Moderate
- Chance of severe wind over 30 yrs
- 76.0%
Air-quality risk 4/10 · Minor
- Unhealthy air days now
- 5 days/yr
- Unhealthy air days in 30 yrs
- 6 days/yr
Risk factors via First Street. Map © Google.
Why this score? — see what drove the D- grade
The composite is a weighted blend of 9 inputs, each scored 0–100. Each bar is that input's sub-score; the figure is the points it added to the 100-point composite (weight × sub-score).
- Cash flow +12.1/30.0
- ARV discount +9.1/15.0
- Rent growth +3.7/5.0
- DSCR +3.6/10.0
- Livability +3.2/5.0
- 1% rule +2.8/10.0
- Condition / age +2.5/5.0
- Schools +2.2/10.0
- Appreciation +0.0/10.0
$170,000
🖨 Deal sheet 📄 Offer letter ✓ Due diligence
Listing remarks MLS
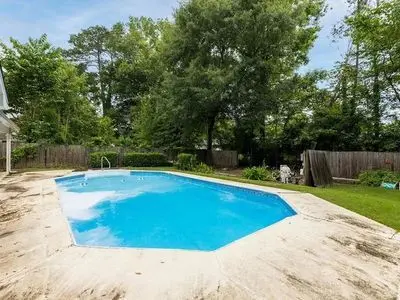
Come in and take a look at this charming home! This home features an open living room, kitchen and eat-in area, separate dining room or additional room that leads to the back yard, 3 bedrooms are down the main hallway with a full bathroom, on the other side of the home you will find an additional bonus room with another full bathroom. This home has plenty of space and offers tons of possibilities. The back yard is the perfect place to enjoy family gatherings or quiet evenings at home, sit under the covered porch or take a splash in the inground pool. Don't miss out on this opportunity, schedule a showing today!!!
Key facts
- In-ground pool
- Covered patio
- Quiet neighborhood
Tags
Property features AI
Exterior
- Home design: Built in 1965
- Construction: Living area approximately 1,588
- Exterior features: Located in the East Columbus subdivision
Neighborhood map
What this means for you Summary
Snapshot
- This is a 3-bed/2.0-bath single-family listed at $170k.
Deal economics
- At list price, monthly cash flow is $-38 ($-452/yr) — negative.
- To cash-flow at today's rent, offer at most $163k (3.9% below list).
- To meet the 1% rule (rent ≥ 1% of price), the offer needs to be $133k (21.9% below list).
- Recommended offer: $133k (21.9% below list) — sets the bar for 1% rule.
- Cap rate 6.0% vs local median 4.7% in Columbus — meaningfully above typical; check what's discounted (condition, days-on-market, listing class) to confirm the premium yield is real.
Location & tenants
- Location reads 64/100 on livability (#254 in GA) — a middle-class / working-renter tenant base. Strengths: cost of living A+, housing A+, health & safety B; Watch: amenities D+, schools F, crime F.
- Muscogee County (urban): math 21% / reading 30% proficiency, ranked #120 of 174 in GA (top 69%) — low school quality limits family demand, transient renter base, plan for 1-2y turnover; 61% free/reduced lunch — lower-income household profile, screen leases tightly.
- Market conditions: Rents rising fast (+4.8%/yr); 256 active listings in the ZIP; 30 comparable units currently listed for rent nearby; rentals at typical pace (median 21d on market — plan ~3-4 weeks tenant-placement turnaround); 291 units permitted in Muscogee County in 2024 (30 in 5+ unit buildings).
Forward outlook
- Local home prices are declining (-3.0%/yr); year-one equity from $1k of loan paydown is wiped out by about $5k of value loss. Plan a longer hold.
- Muscogee County population projected at +15% by 2050 — modest demand growth; plan on rents tracking national, not racing it.
Negotiation context
- Only 1 days on market — expect competitive offers; lowballing is unlikely to land.
- 2 sale attempts since 5y ago with the ask held roughly flat each time — persistent listings suggest the price (not the market) is what's stuck; bring a comps-based counter.
- Current owner paid $115k; 48% above their basis — modest negotiation headroom, anchor on the comps not their cost.
Risks & watch-outs
- Climate carrying-cost: major wind risk, 76% chance of damaging wind over 30y; extreme-heat days projected 7→19/yr by 2055 (HVAC capex compounding) — expect insurance premiums to compound above CPI over the hold.
Questions for the listing agent
- What do current leases actually rent for vs. the listed asking? Can we see a recent rent roll and the last 12 months of T-12 income?
- Built in 1965 — when were the roof, HVAC, electrical panel, plumbing, and water heater last replaced?
- Is there a deadline driving the sale (1031 exchange, divorce, estate, relocation)? That informs how much negotiation room exists.
- Schools are F-rated, which usually means shorter tenancies and higher turnover. Who's the typical renter profile here, and what's been the actual vacancy rate?
- Crime grade is F in this area — have there been break-ins, vandalism, or insurance claims at this property in the last 3 years? What carrier currently insures it and at what premium?
- The area grade is low — what's the realistic commute time and amenity access for the typical tenant pool here? Any planned neighborhood developments (good or bad) we should know about?
- What's the average days-on-market for RENTAL listings here right now (not sales)? A rising rental-DOM trend means longer vacancies and softer asking-rent achievability than the comps imply.
- What's the recent tenant-quality profile in this submarket — average credit score on applications, eviction rate, late-payment / NSF rate, and stable-employment percentage? A property-management company in the area should have these aggregated.
- How much new for-sale + rental construction is in the pipeline within 1–3 miles? Heavy new supply typically softens prices + rents 12–24 months out; constrained supply supports both.
Investment metrics
- 1% rule
- 0.78% ✗
- Cap rate
- 6.03%
- Cash-on-cash
- -0.95%
- DSCR
- 0.96
- GRM
- 10.7
CMA / ARV
- ARV (on-the-fly)
- $176,268
- Comps found
- 12
Show comp detail 12 sales within ~0.75 mi
| Address | Dist | Beds/Ba | Sqft | Sold | Price | $/sf | Match |
|---|---|---|---|---|---|---|---|
| 1110 Woodburn | 0.06mi | 3/2.0 | 1,500 (-6%) | 5mo | $199,000 | $133 | 84 |
| 920 Ashland Ave | 0.23mi | 3/2.0 | 1,731 (+9%) | 3mo | $190,000 | $110 | 72 |
| 4630 Acorn St | 0.47mi | 3/2.0 | 1,517 (-4%) | 3mo | $189,900 | $125 | 68 |
| 963 Celia Dr | 0.24mi | 3/2.0 | 1,677 (+6%) | 23mo | $200,000 | $119 | 61 |
| 4327 Kenesaw Dr | 0.34mi | 3/2.0 | 1,421 (-10%) | 8mo | $145,000 | $102 | 60 |
| 4706 Acorn St | 0.58mi | 3/2.0 | 1,532 (-4%) | 20mo | $175,000 | $114 | 50 |
| 865 Southern Pines Dr | 0.45mi | 3/1.0 | 1,653 (+4%) | 23mo | $65,000 | $39 | 50 |
| 11 Hitching Post Ct | 0.66mi | 4/2.0 (+1) | 1,578 (-1%) | 16mo | $189,900 | $120 | 50 |
| 1459 Alta Vis | 0.72mi | 3/2.0 | 1,707 (+8%) | 7mo | $189,900 | $111 | 48 |
| 940 Quincy Dr | 0.63mi | 3/2.0 | 1,467 (-8%) | 13mo | $129,500 | $88 | 47 |
| 4421 Lon Dr | 0.64mi | 3/2.5 | 1,472 (-7%) | 17mo | $127,500 | $87 | 41 |
| 3650 Stratford Dr | 0.67mi | 4/1.5 (+1) | 1,562 (-2%) | 22mo | $158,000 | $101 | 41 |
Match score weights: distance 35% · size 25% · config 20% · recency 20%. Top-matched comps best support the ARV.
Projected returns pro-forma
-3.0% appreciation · 4.82% rent growth · sell at horizon
- IRR
- -16.0%
- Equity multiple
- 0.42×
- Total profit
- $-27,506
- Equity at exit
- $25,348
- IRR
- -5.0%
- Equity multiple
- 0.65×
- Total profit
- $-16,637
- Equity at exit
- $14,698
Cash invested: $47,600 (down + closing). Projections, not guarantees.
Landlord ↔ Tenant lean methodology
- Overall (STATE)
- 90 Strongly Landlord-Friendly
- State Georgia
- 90 Strongly Landlord-Friendly · R+3
- County
- — inherits STATE
- City
- — inherits STATE
ZIP-level market 31907
- Rents YoY
- 4.8%
- Active inventory
- 256
- Price-to-rent
- 10.7×
Monthly cashflow live
- Estimated rent
- $1,328 high interval (Pro) →
- Mortgage (P&I)
- −$891
- Tax from tax record
- −$124 /mo · $1,493/yr
- Insurance
- −$71
- HOA
- −$0
- Vacancy / Maint / Mgmt
- −$279
- Net cashflow
- $-38
Break-even live
UW: 25.0% down · 7.5% · 30yr · 1.5% tax · 5.0% vac · 8.0% maint · 8.0% mgmt
Financing live
Cash to close
- Down payment
- $42,500
- Closing costs
- $5,100
- Reserves months
- —
- Total cash needed
- —
Loan-product check · same deal, 3 products live
Conventional
25% down · 7.5% · 30yr
- Down + closing
- —
- Monthly P&I
- —
- Monthly cashflow
- —
- DSCR
- —
- Eligible?
- —
Personal DTI + credit; lowest rate.
DSCR
20% down · 8.5% · 30yr
- Down + closing
- —
- Monthly P&I
- —
- Monthly cashflow
- —
- DSCR
- —
- Eligible?
- —
No personal income docs; deal must DSCR.
Hard money
10% down · 12.0% · 12mo
- Down + closing
- —
- Monthly P&I
- —
- Monthly cashflow
- —
- DSCR
- —
- Eligible?
- —
Short-term bridge; refi at stabilization.
Rent comps 30 comps
| Address | Beds | Baths | Sqft | Rent | $/sqft | DOM | Units | Dist |
|---|---|---|---|---|---|---|---|---|
| 920 Rosewood Dr Columbus, GA | 4.0 | 1.0 | 1325 | $1,350 | $1.02 | 21d | 1 | 0.26mi |
| 1537 Celia Dr Columbus, GA | 3.0 | 1.0 | 1139 | $975 | $0.86 | 21d | 1 | 0.56mi |
| 1719 Celia Dr Columbus, GA | 3.0 | 2.0 | 1249 | $1,100 | $0.88 | 44d | 1 | 0.69mi |
| 3911 Steam Mill Rd Columbus, GA | 1.0–3.0 | 1.0–2.0 | 959 | $1,200 | $1.25 | 14d | 12 | 0.73mi |
| 1917 Watkins Dr Columbus, GA | 3.0 | 1.0 | 1323 | $1,200 | $0.91 | 44d | 1 | 0.75mi |
| 1519 Baker St Columbus, GA | 3.0 | 1.0 | 1088 | $1,150 | $1.06 | 21d | 1 | 0.84mi |
| 1502 Baker St Columbus, GA | 4.0 | 2.5 | 1225 | $1,300 | $1.06 | 14d | 1 | 0.85mi |
| 3503 Ruben St Columbus, GA | 4.0 | 1.0 | 1054 | $1,100 | $1.04 | 14d | 1 | 0.91mi |
| 3500 Ruben St Columbus, GA | 4.0 | 3.0 | 2045 | $1,295 | $0.63 | 14d | 1 | 0.92mi |
| 3775 Steam Mill Rd Columbus, GA | 3.0 | 2.0 | 1613 | $2,100 | $1.30 | 44d | 1 | 0.94mi |
| 4970 Gardiner Dr Columbus, GA | 3.0 | 2.0 | 1412 | $1,400 | $0.99 | 44d | 1 | 0.95mi |
| 527 Englewood Dr Columbus, GA | 3.0 | 2.0 | 1469 | $1,450 | $0.99 | 14d | 1 | 0.99mi |
| 1400 Boxwood Blvd Columbus, GA | 2.0–3.0 | 2.0 | 1262 | $1,355 | $1.07 | 14d | 6 | 1.00mi |
| 441 Braselman Ave Columbus, GA | 3.0 | 1.5 | 1150 | $1,250 | $1.09 | 44d | 1 | 1.10mi |
| 3309 10th St Columbus, GA | 3.0 | 1.0 | 1080 | $950 | $0.88 | 44d | 1 | 1.16mi |
| 4265 Adams St Columbus, GA | 3.0 | 1.0 | 1054 | $995 | $0.94 | 44d | 1 | 1.17mi |
| 4707 Marino St Columbus, GA | 3.0 | 1.0 | 1054 | $995 | $0.94 | 44d | 1 | 1.19mi |
| 947 Belvedere Dr Columbus, GA | 3.0 | 2.0 | 1197 | $1,425 | $1.19 | 14d | 1 | 1.25mi |
| 5330 Buena Vista Rd Columbus, GA | 3.0 | 1.0 | 1100 | $995 | $0.90 | 44d | 1 | 1.26mi |
| 1722 Emerson Ave Columbus, GA | 3.0 | 1.0 | 1075 | $1,150 | $1.07 | 21d | 1 | 1.33mi |
| 1097 Bolton Ct Columbus, GA | 3.0 | 2.5 | 2127 | $1,350 | $0.63 | 21d | 1 | 1.34mi |
| 1423 Hagan Dr Columbus, GA | 3.0 | 1.0 | 1275 | $1,250 | $0.98 | 21d | 1 | 1.34mi |
| 2353 Agnes Dr Columbus, GA | 3.0 | 1.0 | 1290 | $1,400 | $1.09 | 21d | 1 | 1.35mi |
| 407 Ocean Ave Columbus, GA | 3.0 | 2.0 | 1319 | $1,595 | $1.21 | 44d | 1 | 1.37mi |
| 419 Mount Pleasant Dr Columbus, GA | 3.0 | 1.5 | 1225 | $950 | $0.78 | 14d | 1 | 1.41mi |
| 5038 Wellborn Dr Columbus, GA | 3.0 | 1.0 | 1056 | $1,175 | $1.11 | 14d | 1 | 1.41mi |
| 3552 Irwin Way Columbus, GA | 4.0 | 2.0 | 1536 | $1,725 | $1.12 | 14d | 1 | 1.45mi |
| 4312 Old Macon Rd #42 Columbus, GA | 2.0 | 1.5 | 1120 | $1,100 | $0.98 | 21d | 1 | 1.45mi |
| 2944 10th St Columbus, GA | 3.0 | 1.0 | 1550 | $925 | $0.60 | 14d | 1 | 1.46mi |
| 2525 Norris Rd #37 Columbus, GA | 3.0 | 2.5 | 2094 | $1,750 | $0.84 | 44d | 1 | 1.49mi |
Listing history 4 events
-
2026-05-26$170,000 Active
-
2021-09-21soldstatus $115,000
-
2021-09-14soldstatus $115,000 621-char remark
Show marketing remark (621 chars)
Come in and take a look at this charming home! This home features an open living room, kitchen and eat-in area, separate dining room or additional room that leads to the back yard, 3 bedrooms are down the main hallway with a full bathroom, on the other side of the home you will find an additional bonus room with another full bathroom. This home has plenty of space and offers tons of possibilities. The back yard is the perfect place to enjoy family gatherings or quiet evenings at home, sit under the covered porch or take a splash in the inground pool. Don't miss out on this opportunity, schedule a showing today!!!
-
2021-06-25$124,900 621-char remark
Show marketing remark (621 chars)
Come in and take a look at this charming home! This home features an open living room, kitchen and eat-in area, separate dining room or additional room that leads to the back yard, 3 bedrooms are down the main hallway with a full bathroom, on the other side of the home you will find an additional bonus room with another full bathroom. This home has plenty of space and offers tons of possibilities. The back yard is the perfect place to enjoy family gatherings or quiet evenings at home, sit under the covered porch or take a splash in the inground pool. Don't miss out on this opportunity, schedule a showing today!!!
ⓘ Source: listings_history table (triggers on properties + properties_extension) + one-shot
backfill from property_details.listing_events for pre-trigger history.
Tax reassessment forecast GA · Resets to sale price
- Current annual tax
- $1,493 · $124/mo
- Projected year-2 tax
- $1,564 · $130/mo
- Expected delta
- +$71/yr (+$6/mo · 4.8%)
ⓘ Screening estimate from a state-policy table — verify with the county assessor before closing.
Climate risk First Street
- Flood 3/10 Moderate FEMA zone X (unshaded) · 9% chance over 30 yrs
- Wildfire 1/10 Low
- Heat 7/10 Severe 7 d/yr ≥107°F today · 19 d/yr by 30 yrs out
- Wind 6/10 Major 76% chance of damaging wind over 30 yrs
- Air quality 4/10 Moderate 5 unhealthy d/yr today · 6 by 30 yrs out
Nearby sold comps map
Loading sold comps map…
Walkable amenities ~0.75 mi
Loading nearby amenities…
Taxation est. · year 1
- Rental income
- $15,935
- − Mortgage interest
- −$9,523
- − Property taxes
- −$1,493
- − Insurance
- −$850
- − Repairs & maintenance
- −$1,275
- − Management
- −$1,275
- − Depreciation
- −$4,945
- Taxable loss
- −$3,426
- Est. tax savings @ 24.0%
- +$822
- After-tax cash flow
- $370/yr
For passive investors: Depreciation is non-cash, so a rental often shows a tax loss while cash-flowing — sheltering income. Rental losses are passive: they offset passive income freely, and up to $25,000/yr can offset ordinary (W-2) income if you actively participate and your MAGI is under $100k (phasing out to $0 by $150k); unused losses carry forward. On sale, claimed depreciation is recaptured at up to 25%, and gains may owe capital-gains tax (a 1031 exchange can defer both). Figures are a year-1 estimate at your 24.0% rate — not tax advice; consult a CPA.
Schools (NCES district)
- District
- Muscogee County
- NCES district ID
- 1303870
- Math proficiency
- 21% ▼ -11.00%
- Reading proficiency
- 30% ▼ -7.00%
- Median HH income
- $41,176
- Composite
- 21.6/100
- National rank
- #8297
- State rank
- #120 of 174 in GA
Livability — Columbus
- Score
- 64/100
- State rank
- #254
- US rank
- #14102
Category grades
Schools grade is shown separately in the Schools card above.
Census & demographics
- Census place
- Columbus, GA
- County
- Muscogee County · 180,764 people
- City population
- 180,764
- Metro
- Columbus, GA-AL
- Population (ZIP)
- 59,110
- Household income
- $54,453
- Rent vs Own
- Severe rent burden
- 2138.0
Population outlook (Muscogee County) Hauer SSP2
- Today (2025)
- 216,729 people
- By 2030
- 224,504 · +3.6%
- By 2040
- 238,318 · +10.0%
- By 2050
- 249,027 · +14.9%
- By 2075
- 264,862 · +22.2%
- By 2100
- 254,786 · +17.6%
Race, ethnicity, and origin ACS 2023
- Neighborhood character
- Majority Black (64%)
- Race & ethnicity
- Black 64% White 22% Two or more races 8% Hispanic / Latino 6% Asian 1%
- Hispanic origin (detail)
- Mexican 2% Puerto Rican 2%
- Common ancestry
- Italian 1% Slovak 1%
- Foreign-born
- 4% · Canada, South Korea
- Languages at home
- 95% English-only · Spanish 3%
Political lean MEDSL · Muscogee
- 2024 margin
- Strong D (+23.4) · D 61.4% · R 38.0%
- 2008→2024 swing
- +3.7pp toward D · 2008: 19.7pp · 2024: 23.4pp
- All cycles
- 2024: D+23.4 2020: D+24.0 2016: D+18.6 2012: D+21.3 2008: D+19.7
Not yet ingested
- Civics
- —
Market trends
- HPI YoY
- ▼ -125.88%
- Current HPI
- 151.74
- Rent YoY
- ▲ 4.82%
- Metro
- Columbus, GA-AL
- State GDP YoY
- ▲ 2.66%
- F500 in state
- 28
Industry mix (Fortune 500 HQ in GA)
| Industry | F500 HQs | Revenue |
|---|---|---|
| Paper / Packaging | 2 | $29B |
|
||
| Retail | 1 | $160B |
|
||
| Transportation / Logistics | 1 | $91B |
|
||
| Airlines | 1 | $62B |
|
||
| Consumer Goods | 1 | $47B |
|
||
| Utilities | 1 | $25B |
|
||
Price history
+36.1% since first listed4 events — show timeline
- 2026-05-26 Listed $170,000 FSBO.com
- 2021-09-21 Sold (Public Records) $115,000 Public Records
- 2021-09-14 Sold (MLS) $115,000 CBOR
- 2021-06-25 Listed $124,900 CBOR
Property tax history
-3.6%/yrLatest (2025): $1,493 · +0.1% YoY. Source: county tax records.
Cash-flow waterfall
monthlySold comps — $/sqft
last 12 mo · ≤1 miLoading sold comps…