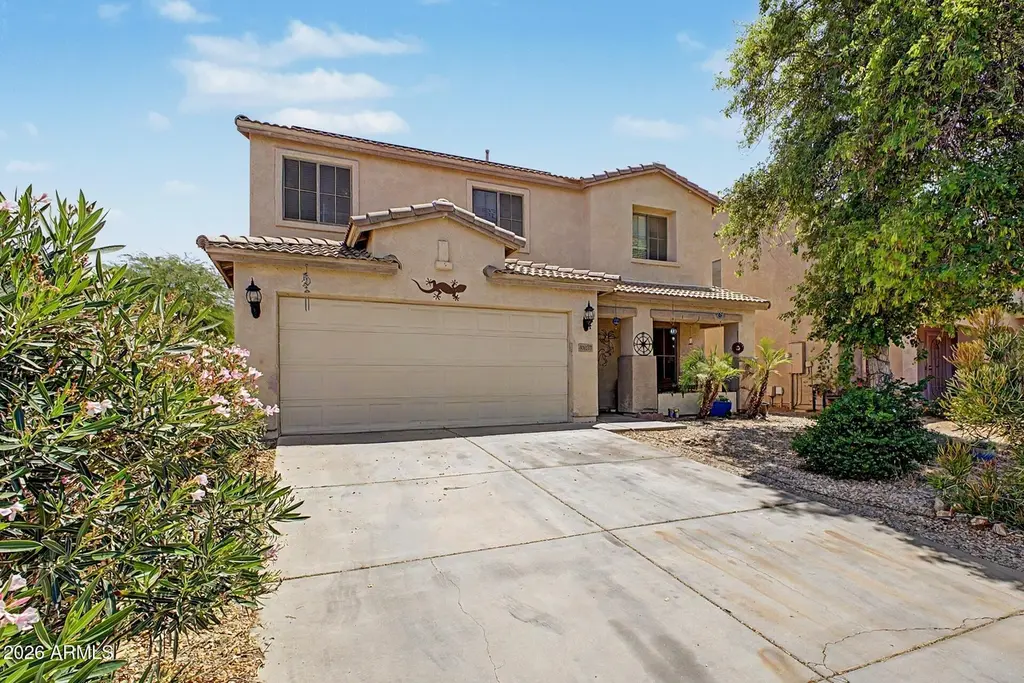
43557 W Sagebrush Trl · Maricopa, AZ
Flood risk 1/10 · Minimal
- FEMA flood zone
- X (shaded)
- Chance of flooding over 30 yrs
- 0.0%
- Est. flood insurance / yr
- $507 – $1,088
Fire risk 7/10 · Major
- Est. fire insurance / yr
- $610 – $1,132
Heat risk 9/10 · Severe
- Hot days now (above 114°F)
- 7 days/yr
- Hot days in 30 yrs
- 18 days/yr
Wind risk 1/10 · Minimal
- Chance of severe wind over 30 yrs
- —
Air-quality risk 1/10 · Minimal
- Unhealthy air days now
- 0 days/yr
- Unhealthy air days in 30 yrs
- 0 days/yr
Risk factors via First Street. Map © Google.
Why this score? — see what drove the C- grade
The composite is a weighted blend of 9 inputs, each scored 0–100. Each bar is that input's sub-score; the figure is the points it added to the 100-point composite (weight × sub-score).
- ARV discount +15.0/15.0
- Cash flow +12.7/30.0
- Appreciation +4.6/10.0
- 1% rule +3.8/10.0
- DSCR +3.8/10.0
- Livability +3.6/5.0
- Rent growth +2.9/5.0
- Condition / age +2.5/5.0
- Schools +2.3/10.0
$250,000
🖨 Deal sheet (PDF) 📄 Offer letter ✓ Due diligence
Listing remarks MLS
Nice home! Come take a look today - You can purchase this home for as little as 3% down with Home Path Financing. Offered strictly AS-IS - No SPDS or CLUE.
Key facts
- 8,026 sq ft lot
- 2 garage spots
- Built 2002
Property features AI
Finance
- HOA & community: Homeowners association with a monthly fee of $182.21; HOA fee includes cable TV
Exterior
- Parking: Covered parking for 2 vehicles; 2-car garage
- Utilities: Public sewer; Private water company
- Home design: Single-family residence; Fee simple ownership
- Construction: Stucco and painted wood-frame construction; Tile roof
- Exterior features: Rear and front sprinklers; Block fencing
Interior
- Kitchen: Pantry
- Bedrooms: Up to 5 possible bedrooms
- Bathrooms: 2 full bathrooms; 1 half bathroom
- Heating & cooling: Natural gas heating; Central air conditioning
- Interior features: Eat-in kitchen; Pantry; Full bathroom in primary bedroom
- Laundry & utility: Indoor laundry with washer/dryer hookup
Neighborhood map
What this means for you Summary
Snapshot
- This is a 4-bed/2.5-bath single-family listed at $250k.
Deal economics
- At list price, monthly cash flow is $-29 ($-351/yr) — negative.
- To cash-flow at today's rent, offer at most $245k (2.1% below list).
- To meet the 1% rule (rent ≥ 1% of price), the offer needs to be $220k (12.1% below list).
- Recommended offer: $220k (12.1% below list) — sets the bar for 1% rule.
- Cap rate 6.2% vs local median 3.7% in Maricopa — top-decile yield for the area; either an underpriced asset or a hidden risk that comps aren't pricing in. Stress-test before assuming the spread holds.
Location & tenants
- Location reads 72/100 on livability (#28 in AZ) — a middle-class / working-renter tenant base. Strengths: housing A+, employment A-, crime B+; Watch: amenities F, commute F, health & safety F.
- Maricopa Unified School District (4441) (town): math 20% / reading 29% proficiency, ranked #128 of 249 in AZ (top 51%) — low school quality limits family demand, transient renter base, plan for 1-2y turnover.
- Zoned schools: Maricopa Elementary School (math 23% / reading 28%, grade F, #631 of 1,109 statewide, top 57%, 733 students, 65% FRL); Maricopa Wells Middle School (math 13% / reading 23%, grade F, #143 of 218 statewide, top 66%, 934 students, 57% FRL); Maricopa High School (math 12% / reading 19%, grade F, #262 of 381 statewide, top 69%, 2,188 students, 46% FRL).
- Market conditions: Rents rising (+1.8%/yr); 858 active listings in the ZIP; 40 comparable units currently listed for rent nearby; rentals at typical pace (median 27d on market — plan ~3-4 weeks tenant-placement turnaround); 42% of comp listings sitting > 30 days — soft ceiling on asking rent; solid renter incomes; 9,504 units permitted in Pinal County in 2024 (776 in 5+ unit buildings).
Forward outlook
- Local home prices are declining (-0.9%/yr); year-one equity from $2k of loan paydown is wiped out by about $2k of value loss. Plan a longer hold.
Negotiation context
- It's been on market 39 days — a 3% lower offer ($242k) is reasonable based on typical stale-listing flexibility.
- 2 sale attempts since 17y ago; this cycle's ask has dropped $40k (14%) from the opening price — seller is motivated, your offer sets the floor, not the list.
- Current owner paid $77k; list at $250k implies a 225% gain — meaningful room to come down on a strong offer.
Risks & watch-outs
- Climate carrying-cost: major wildfire risk; extreme-heat days projected 7→18/yr by 2055 (HVAC capex compounding) — expect insurance premiums to compound above CPI over the hold.
Questions for the listing agent
- What do current leases actually rent for vs. the listed asking? Can we see a recent rent roll and the last 12 months of T-12 income?
- It's been on market 39 days. Have you received any prior offers? Is the seller open to a 12% concession, seller financing, or rate buy-down credit?
- What does the HOA fee cover, when was the last increase, and are there any pending special assessments or reserve-fund shortfalls?
- Is there a deadline driving the sale (1031 exchange, divorce, estate, relocation)? That informs how much negotiation room exists.
- Schools are B-rated — typically a magnet for longer-tenancy family renters. What's the average tenant stay here, and is there a school-zone premium baked into asking?
- What's the average days-on-market for RENTAL listings here right now (not sales)? A rising rental-DOM trend means longer vacancies and softer asking-rent achievability than the comps imply.
- What's the recent tenant-quality profile in this submarket — average credit score on applications, eviction rate, late-payment / NSF rate, and stable-employment percentage? A property-management company in the area should have these aggregated.
- How much new for-sale + rental construction is in the pipeline within 1–3 miles? Heavy new supply typically softens prices + rents 12–24 months out; constrained supply supports both.
Investment metrics
- 1% rule
- 0.88% ✗
- Cap rate
- 6.15%
- Cash-on-cash
- -0.50%
- DSCR
- 0.98
- GRM
- 9.5
CMA / ARV
- ARV (median comp)
- $346,808
- List price
- $250,000
- Delta
- -27.91%
- Verdict
- UNDERPRICED
- Comps
- 20 within 1.0 mi
Show comp detail 12 sales within ~0.75 mi
| Address | Dist | Beds/Ba | Sqft | Sold | Price | $/sf | Match |
|---|---|---|---|---|---|---|---|
| 44188 W Cydnee Dr | 0.46mi | 4/2.0 | 1,917 (-5%) | 1mo | $287,000 | $150 | 68 |
| 43522 W Snow Dr | 0.28mi | 4/3.0 | 2,228 (+11%) | 1mo | $345,000 | $155 | 66 |
| 20743 N Enchantment Pass | 0.50mi | 3/3.0 (-1) | 2,057 (+2%) | 2mo | $500,000 | $243 | 64 |
| 43843 W Roth Rd | 0.49mi | 3/2.0 (-1) | 1,885 (-6%) | 1mo | $385,000 | $204 | 59 |
| 20626 N Madison Dr | 0.42mi | 4/2.0 | 2,252 (+12%) | 1mo | $475,000 | $211 | 57 |
| 43302 W Bunker Dr | 0.70mi | 4/2.0 | 2,092 (+4%) | 2mo | $430,000 | $206 | 57 |
| 44175 W Snow Dr | 0.44mi | 4/2.5 | 2,309 (+15%) | 0mo | $299,000 | $129 | 55 |
| 22392 N Balboa Dr | 0.71mi | 3/2.0 (-1) | 1,950 (-3%) | 0mo | $375,000 | $192 | 54 |
| 43874 W Bailey Dr | 0.64mi | 3/2.5 (-1) | 1,820 (-10%) | 2mo | $379,000 | $208 | 47 |
| 44469 W Canyon Creek Dr | 0.74mi | 4/2.0 | 2,207 (+10%) | 2mo | $415,000 | $188 | 46 |
| 43423 W Venture Rd | 0.72mi | 3/2.0 (-1) | 2,218 (+10%) | 2mo | $370,000 | $167 | 40 |
| 44729 W Alamendras St | 0.75mi | 4/2.0 | 1,754 (-13%) | 2mo | $265,000 | $151 | 40 |
Match score weights: distance 35% · size 25% · config 20% · recency 20%. Top-matched comps best support the ARV.
Projected returns pro-forma
-0.89% appreciation · 1.78% rent growth · sell at horizon
- IRR
- -7.3%
- Equity multiple
- 0.69×
- Total profit
- $-22,028
- Equity at exit
- $61,697
- IRR
- -1.6%
- Equity multiple
- 0.85×
- Total profit
- $-10,349
- Equity at exit
- $65,944
Cash invested: $70,000 (down + closing). Projections, not guarantees.
Landlord ↔ Tenant lean methodology
- Overall (STATE)
- 87 Strongly Landlord-Friendly
- State Arizona
- 87 Strongly Landlord-Friendly · R+3
- County
- — inherits STATE
- City
- — inherits STATE
ZIP-level market 85138
- Home prices YoY
- -0.3%
- Rents YoY
- 1.8%
- Active inventory
- 858
- Price-to-rent
- 9.5×
Monthly cashflow live
- Estimated rent
- $2,198 high interval (Pro) →
- Mortgage (P&I)
- −$1,311
- Tax from tax record
- −$169 /mo · $2,026/yr
- Insurance
- −$104
- HOA
- −$182
- Lot rent
- −$0
- Vacancy / Maint / Mgmt
- −$462
- Net cashflow
- $-29
Break-even live
Sensitivity live
| Price | -10% $112 | -5% $41 | +0% $-29 | +5% $-100 | +10% $-171 |
|---|---|---|---|---|---|
| Rent | -10% $-203 | -5% $-116 | +0% $-29 | +5% $58 | +10% $144 |
| Rate | -1.0pp $97 | -0.5pp $34 | base $-29 | +0.5pp $-94 | +1.0pp $-160 |
UW: 25.0% down · 7.5% · 30yr · 1.5% tax · 5.0% vac · 8.0% maint · 8.0% mgmt
Financing live
Cash to close
- Down payment
- $62,500
- Closing costs
- $7,500
- Reserves months
- —
- Total cash needed
- —
Loan-product check · same deal, 3 products live
Conventional
25% down · 7.5% · 30yr
- Down + closing
- —
- Monthly P&I
- —
- Monthly cashflow
- —
- DSCR
- —
- Eligible?
- —
Personal DTI + credit; lowest rate.
DSCR
20% down · 8.5% · 30yr
- Down + closing
- —
- Monthly P&I
- —
- Monthly cashflow
- —
- DSCR
- —
- Eligible?
- —
No personal income docs; deal must DSCR.
Hard money
10% down · 12.0% · 12mo
- Down + closing
- —
- Monthly P&I
- —
- Monthly cashflow
- —
- DSCR
- —
- Eligible?
- —
Short-term bridge; refi at stabilization.
Rent comps 40 comps
| Address | Beds | Baths | Sqft | Rent | $/sqft | DOM | Units | Dist |
|---|---|---|---|---|---|---|---|---|
| 43697 W Sagebrush Trl Maricopa, AZ | 3.0 | 2.5 | 1981 | $1,600 | $0.81 | 26d | 1 | 0.08mi |
| 21054 N Sansom Dr Maricopa, AZ | 5.0 | 2.0 | 2278 | $2,200 | $0.97 | 46d | 1 | 0.22mi |
| 43207 W Lindgren Dr Maricopa, AZ | 3.0 | 2.0 | 1907 | $1,699 | $0.89 | 46d | 1 | 0.25mi |
| 21061 N Bustos Way Maricopa, AZ | 3.0 | 2.0 | 1907 | $1,749 | $0.92 | 46d | 1 | 0.29mi |
| 21552 N Duncan Dr Maricopa, AZ | 3.0 | 2.0 | 1701 | $1,825 | $1.07 | 1d | 1 | 0.29mi |
| 21563 N Greenway Rd Maricopa, AZ | 3.0 | 2.0 | 1625 | $3,200 | $1.97 | 1d | 1 | 0.33mi |
| 43878 W Wade Dr Maricopa, AZ | 3.0 | 2.0 | 1685 | $1,750 | $1.04 | 5d | 1 | 0.34mi |
| 43854 W Cahill Dr Unit 1545679P Maricopa, AZ | 3.0 | 2.0 | 1689 | $2,258 | $1.34 | 17d | 1 | 0.37mi |
| 20793 N Marquez Dr Maricopa, AZ | 3.0 | 2.0 | 1441 | $1,550 | $1.08 | 46d | 1 | 0.41mi |
| 21047 N Alma Dr Maricopa, AZ | 3.0 | 2.0 | 1628 | $1,995 | $1.23 | 46d | 1 | 0.43mi |
| 44212 W Cydnee Dr Maricopa, AZ | 3.0 | 2.0 | 1441 | $1,700 | $1.18 | 46d | 1 | 0.46mi |
| 43205 W Roth Rd Maricopa, AZ | 4.0 | 2.0 | 2216 | $2,100 | $0.95 | 13d | 1 | 0.48mi |
| 43205 W Roth Rd Maricopa, AZ | 4.0 | 2.0 | 2215 | $2,200 | $0.99 | 46d | 1 | 0.48mi |
| 43332 W Griffis Dr Maricopa, AZ | 4.0 | 2.0 | 2235 | $4,200 | $1.88 | 46d | 1 | 0.52mi |
| 43849 W Kramer Ln Maricopa, AZ | 4.0 | 2.0 | 1870 | $1,895 | $1.01 | 19d | 1 | 0.53mi |
| 19696 N Madison Dr Maricopa, AZ | 4.0 | 2.5 | 2219 | $3,400 | $1.53 | 26d | 1 | 0.53mi |
| 44304 W Vineyard St Maricopa, AZ | 5.0 | 2.5 | 2561 | $1,995 | $0.78 | 17d | 1 | 0.55mi |
| 20544 N Alma Dr Maricopa, AZ | 3.0 | 2.5 | 2301 | $2,200 | $0.96 | 7d | 1 | 0.63mi |
| 22257 N Gibson Dr Maricopa, AZ | 3.0 | 2.5 | 1806 | $1,795 | $0.99 | 22d | 1 | 0.67mi |
| 22257 N Gibson Dr Maricopa, AZ | 3.0 | 2.5 | 1806 | $1,795 | $0.99 | 46d | 1 | 0.67mi |
| 22257 N Gibson Dr Maricopa, AZ | 3.0 | 2.5 | 1806 | $1,795 | $0.99 | 26d | 1 | 0.67mi |
| 44812 W Paraiso Ln Maricopa, AZ | 3.0 | 2.0 | 1413 | $1,595 | $1.13 | 6d | 1 | 0.77mi |
| 44456 W Eddie Way Maricopa, AZ | 3.0 | 2.0 | 1679 | $1,695 | $1.01 | 46d | 1 | 0.78mi |
| 22165 N Celtic Ave Maricopa, AZ | 3.0 | 2.0 | 2363 | $2,295 | $0.97 | 0d | 1 | 0.78mi |
| 42376 W Chisholm Dr Maricopa, AZ | 3.0 | 2.0 | 2312 | $2,000 | $0.87 | 7d | 1 | 0.80mi |
| 43531 W Oster Dr Maricopa, AZ | 5.0 | 3.0 | 2494 | $1,900 | $0.76 | 26d | 1 | 0.80mi |
| 43368 W Palmen Dr Maricopa, AZ | 4.0 | 2.5 | 2200 | $1,889 | $0.86 | 46d | 1 | 0.87mi |
| 22156 N Sunset Dr Maricopa, AZ | 3.0 | 2.0 | 2112 | $2,100 | $0.99 | 0d | 1 | 0.87mi |
| 22641 N Gibson Dr Maricopa, AZ | 3.0 | 2.0 | 2169 | $1,699 | $0.78 | 46d | 1 | 0.87mi |
| 42187 W Chisholm Dr Maricopa, AZ | 3.0 | 2.0 | 2312 | $5,500 | $2.38 | 46d | 1 | 0.90mi |
| 44415 W Knauss Dr Maricopa, AZ | 4.0 | 2.5 | 2454 | $1,895 | $0.77 | 46d | 1 | 0.90mi |
| 43194 W Sunland Dr Maricopa, AZ | 4.0 | 2.0 | 1937 | $1,850 | $0.96 | 17d | 1 | 0.91mi |
| 43914 W Adobe Cir Maricopa, AZ | 3.0 | 2.0 | 2168 | $2,070 | $0.95 | 46d | 1 | 0.91mi |
| 21619 N Van Loo Dr Maricopa, AZ | 3.0 | 2.0 | 1938 | $3,500 | $1.81 | 5d | 1 | 0.95mi |
| 44216 W Palmen Dr Maricopa, AZ | 4.0 | 2.5 | 2604 | $1,895 | $0.73 | 46d | 1 | 0.95mi |
| 44151 W Palmen Dr Maricopa, AZ | 4.0 | 2.5 | 2604 | $2,350 | $0.90 | 20d | 1 | 0.96mi |
| 43223 W Neely Dr Maricopa, AZ | 4.0 | 2.0 | 2223 | $2,900 | $1.30 | 19d | 1 | 0.96mi |
| 44425 W Oster Dr Maricopa, AZ | 4.0 | 2.5 | 2500 | $2,200 | $0.88 | 7d | 1 | 0.99mi |
| 45023 W Miramar Rd Maricopa, AZ | 3.0 | 2.0 | 1653 | $3,000 | $1.81 | 46d | 1 | 1.01mi |
| 44171 W Adobe Cir Maricopa, AZ | 4.0 | 2.0 | 2160 | $2,100 | $0.97 | 0d | 1 | 1.01mi |
HOA detail
- Monthly dues
- $182 · $2,184/yr
Listing history 21 events
-
2026-06-22statusdays on market $250,000 Pending 39 DOM
-
2026-06-21days on market $250,000 Active 38 DOM
-
2026-06-18days on market $250,000 Active 35 DOM
-
2026-06-17price $250,000 Active 34 DOM
-
2026-06-17days on market $270,000 Active 34 DOM
-
2026-06-16days on market $270,000 Active 33 DOM
-
2026-06-15days on market $270,000 Active 32 DOM
-
2026-06-13days on market $270,000 Active 30 DOM
-
2026-06-13days on market $270,000 Active 29 DOM
-
2026-06-09days on market $270,000 Active 26 DOM
-
2026-06-08days on market $270,000 Active 25 DOM
-
2026-06-07days on market $270,000 Active 24 DOM
-
2026-06-04pricedays on market $270,000 Active 21 DOM
-
2026-06-03days on market $280,000 Active 20 DOM
-
2026-06-02days on market $280,000 Active 19 DOM
-
2026-06-01days on market $280,000 Active 18 DOM
-
2026-05-31days on market $280,000 Active 17 DOM
-
2026-05-14$290,000 Active 831-char remark
-
2010-05-07soldstatus $77,000 Closed 155-char remark
Show marketing remark (155 chars)
Nice home! Come take a look today - You can purchase this home for as little as 3% down with Home Path Financing. Offered strictly AS-IS - No SPDS or CLUE.
-
2010-03-15historical 155-char remark
Show marketing remark (155 chars)
Nice home! Come take a look today - You can purchase this home for as little as 3% down with Home Path Financing. Offered strictly AS-IS - No SPDS or CLUE.
-
2009-12-24$77,000 155-char remark
Show marketing remark (155 chars)
Nice home! Come take a look today - You can purchase this home for as little as 3% down with Home Path Financing. Offered strictly AS-IS - No SPDS or CLUE.
ⓘ Source: listings_history table (triggers on properties + properties_extension) + one-shot
backfill from property_details.listing_events for pre-trigger history.
Tax reassessment forecast AZ · Resets to sale price
- Current annual tax
- $2,026 · $169/mo
- Projected year-2 tax
- $2,026 · $169/mo
- Expected delta
- $0/yr ($0/mo · 0.0%)
ⓘ Screening estimate from a state-policy table — verify with the county assessor before closing.
Climate risk First Street
- Flood 1/10 Low FEMA zone X (shaded) · 0% chance over 30 yrs
- Wildfire 7/10 Severe
- Heat 9/10 Extreme 7 d/yr ≥114°F today · 18 d/yr by 30 yrs out
- Wind 1/10 Low
- Air quality 1/10 Low 0 unhealthy d/yr today · 0 by 30 yrs out
Nearby sold comps map
Loading sold comps map…
Walkable amenities ~0.75 mi
Loading nearby amenities…
Taxation est. · year 1
- Rental income
- $26,381
- − Mortgage interest
- −$14,004
- − Property taxes
- −$2,026
- − Insurance
- −$1,250
- − Repairs & maintenance
- −$2,110
- − Management
- −$2,110
- − HOA
- −$2,184
- − Depreciation
- −$7,273
- Taxable loss
- −$4,577
- Est. tax savings @ 24.0%
- +$1,098
- After-tax cash flow
- $747/yr
For passive investors: Depreciation is non-cash, so a rental often shows a tax loss while cash-flowing — sheltering income. Rental losses are passive: they offset passive income freely, and up to $25,000/yr can offset ordinary (W-2) income if you actively participate and your MAGI is under $100k (phasing out to $0 by $150k); unused losses carry forward. On sale, claimed depreciation is recaptured at up to 25%, and gains may owe capital-gains tax (a 1031 exchange can defer both). Figures are a year-1 estimate at your 24.0% rate — not tax advice; consult a CPA.
Schools (NCES district)
- District
- Maricopa Unified School District (4441)
- NCES district ID
- 0404720
- Math proficiency
- 20% ▼ -18.00%
- Reading proficiency
- 29% ▼ -9.00%
- Median HH income
- $63,725
- Composite
- 22.92/100
- National rank
- #7993
- State rank
- #128 of 249 in AZ
Livability — Maricopa
- Score
- 72/100
- State rank
- #28
- US rank
- #5943
Category grades
Schools grade is shown separately in the Schools card above.
Census & demographics
- Census place
- Maricopa, AZ
- County
- Pinal County · 399,947 people
- City population
- 76,044
- Metro
- Phoenix-Mesa-Chandler, AZ
- Population (ZIP)
- 55,260
- Household income
- $95,867
- Rent vs Own
- Severe rent burden
- 432.0
Population outlook (Pinal County) Hauer SSP2
- Today (2025)
- 437,574 people
- By 2030
- 446,903 · +2.1%
- By 2040
- 452,589 · +3.4%
- By 2050
- 444,126 · +1.5%
- By 2075
- 430,300 · -1.7%
- By 2100
- 393,536 · -10.1%
Race, ethnicity, and origin ACS 2023
- Neighborhood character
- Diverse neighborhood (Simpson 0.69)
- Race & ethnicity
- White 45% Hispanic / Latino 30% Two or more races 17% Black 13% Native American 3% Asian 3% Pacific Islander 1%
- Hispanic origin (detail)
- Mexican 26% Puerto Rican 1%
- Common ancestry
- Lithuanian 2% Romanian 2% Italian 2%
- Foreign-born
- 10% · Canada
- Languages at home
- 79% English-only · Spanish 16% Other Asian/Pacific 1% Other Indo-European 1%
Political lean MEDSL · Pinal
- 2024 margin
- Strong R (+22.1) · D 38.5% · R 60.6%
- 2008→2024 swing
- -7.6pp toward R · 2008: -14.5pp · 2024: -22.1pp
- All cycles
- 2024: R+22.1 2020: R+17.3 2016: R+19.3 2012: R+17.1 2008: R+14.5
Not yet ingested
- Civics
- —
Market trends
- HPI YoY
- ▼ -0.89%
- Current HPI
- 258.1461
- Rent YoY
- ▲ 1.78%
- Metro
- Phoenix-Mesa-Chandler, AZ
- State GDP YoY
- ▲ 4.54%
- F500 in state
- 20
Industry mix (Fortune 500 HQ in AZ)
| Industry | F500 HQs | Revenue |
|---|---|---|
| Technology | 2 | $13B |
|
||
| Mining / Metals | 1 | $23B |
|
||
| Environmental Services | 1 | $16B |
|
||
| Metals / Steel | 1 | $14B |
|
||
| Technology Distribution | 1 | $9B |
|
||
| Homebuilding | 1 | $8B |
|
||
Price history
+224.7% since first listed7 events — show timeline
- 2026-06-17 Price Changed $250,000 ARMLS
- 2026-06-03 Price Changed $270,000 ARMLS
- 2026-05-24 Price Changed $280,000 ARMLS
- 2026-05-14 Listed $290,000 ARMLS
- 2010-05-07 Sold (MLS) $77,000 ARMLS
- 2010-03-15 Listing Removed — ARMLS
- 2009-12-24 Listed $77,000 ARMLS
Property tax history
+0.0%/yrLatest (2025): $2,026 · +3.6% YoY. Source: county tax records.
Cash-flow waterfall
monthlySold comps — $/sqft
last 12 mo · ≤1 miLoading sold comps…