 🏷️ Likely Rental
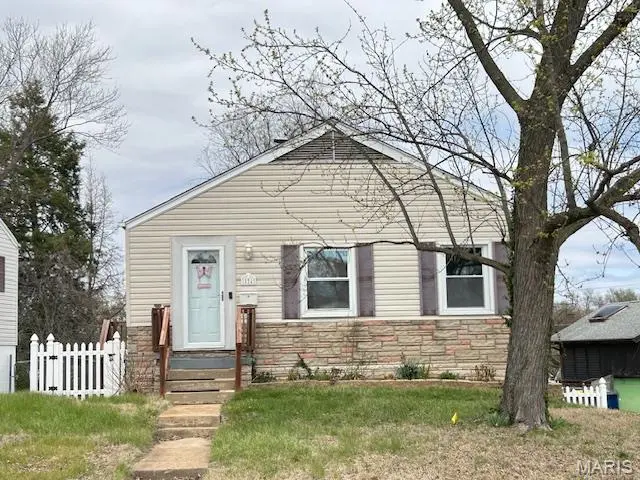
10243 Saint Katherine Ln · St. Ann, MO
Flood risk 1/10 · Minimal
- FEMA flood zone
- X (unshaded)
- Chance of flooding over 30 yrs
- 0.0%
- Est. flood insurance / yr
- $473 – $860
Fire risk 1/10 · Minimal
- Est. fire insurance / yr
- $1,054 – $1,958
Heat risk 4/10 · Minor
- Hot days now (above 106°F)
- 7 days/yr
- Hot days in 30 yrs
- 21 days/yr
Wind risk 2/10 · Minimal
- Chance of severe wind over 30 yrs
- 1.0%
Air-quality risk 2/10 · Minimal
- Unhealthy air days now
- 1 days/yr
- Unhealthy air days in 30 yrs
- 3 days/yr
Risk factors via First Street. Map © Google.
Why this score? — see what drove the D+ grade
The composite is a weighted blend of 9 inputs, each scored 0–100. Each bar is that input's sub-score; the figure is the points it added to the 100-point composite (weight × sub-score).
- Cash flow +15.0/30.0
- ARV discount +15.0/15.0
- DSCR +4.6/10.0
- 1% rule +3.7/10.0
- Rent growth +3.5/5.0
- Livability +2.5/5.0
- Condition / age +2.5/5.0
- Schools +1.7/10.0
- Appreciation +0.0/10.0
$150,000
🖨 Deal sheet 📄 Offer letter ✓ Due diligence
Listing remarks MLS
Fantastic opportunity in St. Ann! This 2-bedroom, 1-bathroom home features a functional main-floor layout and a finished walk-out basement that includes a family room and a versatile space perfect for a home office or additional sleeping area. Currently tenant-occupied, this is a perfect turn-key addition to your portfolio. Due to tenant occupancy, showings are limited. Join us for an Open House on Thursday, April 16th, from 4:00 PM – 7:00 PM.
Key facts
- 7,069 sq ft lot
- Built 1943
- Listed 38 days
Neighborhood map
What this means for you Summary
Snapshot
- This is a 2-bed/1.0-bath single-family listed at $150k.
Deal economics
- At list price, monthly cash flow is $48 ($576/yr) — positive.
- The deal already cash-flows at list — no discount required.
- To meet the 1% rule (rent ≥ 1% of price), the offer needs to be $131k (12.7% below list).
- Recommended offer: $131k (12.7% below list) — sets the bar for 1% rule.
Location & tenants
- Location reads: area grade D — affects rentability + tenant quality, not the cash-flow math above.
- Ritenour (suburban): math 13% / reading 27% proficiency, ranked #304 of 324 in MO (top 94%) — low school quality limits family demand, transient renter base, plan for 1-2y turnover; 66% free/reduced lunch — lower-income household profile, screen leases tightly.
- Market conditions: Rents rising fast (+4.1%/yr); 61 active listings in the ZIP; 34 comparable units currently listed for rent nearby; rentals at typical pace (median 24d on market — plan ~3-4 weeks tenant-placement turnaround); 47% of comp listings sitting > 30 days — soft ceiling on asking rent; 920 units permitted in St. Louis County in 2024 (250 in 5+ unit buildings).
- This rent runs 30% of the median local income ($52k/yr) — at the standard rent-burdened threshold; future hikes will face affordability resistance.
Forward outlook
- Local home prices are declining (-3.0%/yr); year-one equity from $1k of loan paydown is wiped out by about $4k of value loss. Plan a longer hold.
Negotiation context
- It's been on market 38 days — a 3% lower offer ($146k) is reasonable based on typical stale-listing flexibility.
- 4 sale attempts since 8y ago with the ask held roughly flat each time — persistent listings suggest the price (not the market) is what's stuck; bring a comps-based counter.
- Current owner paid $90k; list at $150k implies a 67% gain — meaningful room to come down on a strong offer.
Risks & watch-outs
- Watch-outs: built in 1943 — expect roof / HVAC / electrical / plumbing capex.
Questions for the listing agent
- It's been on market 38 days. Have you received any prior offers? Is the seller open to a 13% concession, seller financing, or rate buy-down credit?
- Built in 1943 — when were the roof, HVAC, electrical panel, plumbing, and water heater last replaced?
- Is there a deadline driving the sale (1031 exchange, divorce, estate, relocation)? That informs how much negotiation room exists.
- The area grade is low — what's the realistic commute time and amenity access for the typical tenant pool here? Any planned neighborhood developments (good or bad) we should know about?
- What's the average days-on-market for RENTAL listings here right now (not sales)? A rising rental-DOM trend means longer vacancies and softer asking-rent achievability than the comps imply.
- What's the recent tenant-quality profile in this submarket — average credit score on applications, eviction rate, late-payment / NSF rate, and stable-employment percentage? A property-management company in the area should have these aggregated.
- How much new for-sale + rental construction is in the pipeline within 1–3 miles? Heavy new supply typically softens prices + rents 12–24 months out; constrained supply supports both.
Investment metrics
- 1% rule
- 0.87% ✗
- Cap rate
- 6.68%
- Cash-on-cash
- 1.37%
- DSCR
- 1.06
- GRM
- 9.5
CMA / ARV
- ARV (median comp)
- $188,490
- List price
- $150,000
- Delta
- -20.42%
- Verdict
- UNDERPRICED
- Comps
- 20 within 1.0 mi
Show comp detail 12 sales within ~0.75 mi
| Address | Dist | Beds/Ba | Sqft | Sold | Price | $/sf | Match |
|---|---|---|---|---|---|---|---|
| 10512 Saint Francis Ln | 0.35mi | 2/1.0 | 792 (+1%) | 1mo | $149,900 | $189 | 81 |
| 10262 Breckenridge Rd | 0.34mi | 2/1.0 | 792 (+1%) | 2mo | $99,900 | $126 | 80 |
| 10212 Saint Arthur Ln | 0.44mi | 2/1.0 | 784 (0%) | 3mo | $154,900 | $198 | 77 |
| 3438 Ashby Rd | 0.33mi | 2/1.0 | 816 (+4%) | 1mo | $159,900 | $196 | 77 |
| 3525 Wismer Rd | 0.48mi | 2/1.0 | 816 (+4%) | 5mo | $148,500 | $182 | 67 |
| 3507 Westridge Ln | 0.30mi | 3/1.0 (+1) | 864 (+10%) | 1mo | $165,000 | $191 | 63 |
| 3219 Royalton Ave | 0.73mi | 2/1.0 | 792 (+1%) | 3mo | $102,500 | $129 | 62 |
| 10346 Saint Henry Ln | 0.47mi | 2/1.0 | 864 (+10%) | 1mo | $155,000 | $179 | 60 |
| 10019 Saint Martha Ln | 0.45mi | 3/1.0 (+1) | 864 (+10%) | 4mo | $188,000 | $218 | 54 |
| 10335 Saint Joan Ln | 0.54mi | 2/1.0 | 897 (+14%) | 2mo | $174,900 | $195 | 49 |
| 10500 Saint Michael Ln | 0.48mi | 2/2.0 | 888 (+13%) | 5mo | $125,900 | $142 | 47 |
| 10738 Saint Cosmas Ln | 0.74mi | 3/2.0 (+1) | 864 (+10%) | 5mo | $214,900 | $249 | 36 |
Match score weights: distance 35% · size 25% · config 20% · recency 20%. Top-matched comps best support the ARV.
Projected returns pro-forma
-3.0% appreciation · 4.14% rent growth · sell at horizon
- IRR
- -12.9%
- Equity multiple
- 0.53×
- Total profit
- $-19,743
- Equity at exit
- $22,365
- IRR
- -2.3%
- Equity multiple
- 0.84×
- Total profit
- $-6,919
- Equity at exit
- $12,969
Cash invested: $42,000 (down + closing). Projections, not guarantees.
Landlord ↔ Tenant lean methodology
- Overall (STATE)
- 81 Strongly Landlord-Friendly
- State Missouri
- 81 Strongly Landlord-Friendly · R+10
- County
- — inherits STATE
- City
- — inherits STATE
ZIP-level market 63074
- Rents YoY
- 4.1%
- Active inventory
- 61
- Price-to-rent
- 9.5×
Monthly cashflow live
- Estimated rent
- $1,310 high interval (Pro) →
- Mortgage (P&I)
- −$787
- Tax from tax record
- −$138 /mo · $1,655/yr
- Insurance
- −$62
- HOA
- −$0
- Vacancy / Maint / Mgmt
- −$275
- Net cashflow
- $48
Break-even live
UW: 25.0% down · 7.5% · 30yr · 1.5% tax · 5.0% vac · 8.0% maint · 8.0% mgmt
Financing live
Cash to close
- Down payment
- $37,500
- Closing costs
- $4,500
- Reserves months
- —
- Total cash needed
- —
Loan-product check · same deal, 3 products live
Conventional
25% down · 7.5% · 30yr
- Down + closing
- —
- Monthly P&I
- —
- Monthly cashflow
- —
- DSCR
- —
- Eligible?
- —
Personal DTI + credit; lowest rate.
DSCR
20% down · 8.5% · 30yr
- Down + closing
- —
- Monthly P&I
- —
- Monthly cashflow
- —
- DSCR
- —
- Eligible?
- —
No personal income docs; deal must DSCR.
Hard money
10% down · 12.0% · 12mo
- Down + closing
- —
- Monthly P&I
- —
- Monthly cashflow
- —
- DSCR
- —
- Eligible?
- —
Short-term bridge; refi at stabilization.
Rent comps 34 comps
| Address | Beds | Baths | Sqft | Rent | $/sqft | DOM | Units | Dist |
|---|---|---|---|---|---|---|---|---|
| 10214 Saint Anthony Ln Saint Ann, MO | 2.0 | 1.0 | 734 | $1,200 | $1.63 | 43d | 1 | 0.06mi |
| 10116 Saint Katherine Ln Saint Ann, MO | 3.0 | 1.0 | 984 | $1,865 | $1.90 | 17d | 1 | 0.17mi |
| 3529 Saint Joachim Ln Saint Ann, MO | 2.0 | 1.0 | 900 | $1,450 | $1.61 | 23d | 1 | 0.22mi |
| 3529 Saint Joachim Ln Unit NA St Ann, MO | 2.0 | 1.0 | 900 | $1,450 | $1.61 | 20d | 1 | 0.23mi |
| 10205 Saint Daniel Ln Saint Ann, MO | 2.0 | 1.0 | 792 | $1,450 | $1.83 | 43d | 1 | 0.40mi |
| 3434 Sims Ave Saint Ann, MO | 3.0 | 1.5 | 988 | $1,545 | $1.56 | 43d | 1 | 0.42mi |
| 10069 Livingston Ave St Ann, MO | 2.0 | 1.0 | 875 | $1,100 | $1.26 | 23d | 1 | 0.73mi |
| 3219 Royalton Ave Saint Louis, MO | 2.0 | 1.0 | 792 | $1,095 | $1.38 | 21d | 1 | 0.73mi |
| 3209 Royalton Ave Saint Louis, MO | 2.0 | 1.0 | 805 | $1,150 | $1.43 | 43d | 1 | 0.75mi |
| 9675 Muriel Ave Unit 9627 Overland, MO | 2.0 | 1.5 | 830 | $1,200 | $1.45 | 43d | 1 | 0.79mi |
| 9675 Muriel Ave Unit 9733 Overland, MO | 2.0 | 1.5 | 830 | $1,200 | $1.45 | 3d | 1 | 0.79mi |
| 9618 De Porres Ln Saint Louis, MO | 2.0 | 1.0 | 875 | $1,200 | $1.37 | 43d | 1 | 0.82mi |
| 3961 Jane Ave Unit 3963 St Ann, MO | 2.0 | 1.0 | 750 | $1,195 | $1.59 | 14d | 1 | 0.86mi |
| 9807 Guthrie Ave Saint Louis, MO | 3.0 | 2.0 | 1068 | $1,700 | $1.59 | 23d | 1 | 0.92mi |
| 3648 Edmundson Rd Unit 1 St. Louis, MO | 2.0 | 1.0 | 900 | $995 | $1.11 | 43d | 1 | 0.99mi |
| 3209 Dix Ave Saint Louis, MO | 3.0 | 1.0 | 1122 | $1,550 | $1.38 | 23d | 1 | 1.06mi |
| 9535 Baltimore Ave Saint Louis, MO | 2.0 | 1.0 | 800 | $1,145 | $1.43 | 23d | 1 | 1.08mi |
| 3208 Dix Ave Saint Louis, MO | 2.0 | 1.0 | 656 | $1,235 | $1.88 | 10d | 1 | 1.08mi |
| 10742 Tropic Dr Unit VACANT St Ann, MO | 2.0 | 1.0 | 800 | $1,200 | $1.50 | 43d | 1 | 1.10mi |
| 9448 Harold Dr Saint Louis, MO | 2.0 | 1.0 | 864 | $1,495 | $1.73 | 43d | 1 | 1.12mi |
| 11042 Florence Ave Saint Ann, MO | 3.0 | 1.0 | 864 | $1,300 | $1.50 | 12d | 1 | 1.12mi |
| 10788 Tropic Dr Saint Ann, MO | 2.0 | 1.0 | 828 | $1,260 | $1.52 | 43d | 1 | 1.13mi |
| 10145 Cabana Club Dr St Ann, MO | 1.0–2.0 | 1.0–2.0 | 776 | $1,060 | $1.37 | 43d | 8 | 1.14mi |
| 2732 Annapolis Ave Saint Louis, MO | 2.0 | 1.0 | 768 | $1,250 | $1.63 | 43d | 1 | 1.17mi |
| 4120 Geraldine Ave St Ann, MO | 1.0 | 1.0 | 540 | $875 | $1.62 | 43d | 1 | 1.18mi |
| 4120 Geraldine Ave St Ann, MO | 2.0 | 1.5 | 922 | $1,200 | $1.30 | 17d | 1 | 1.18mi |
| 4120 Geraldine Ave St Ann, MO | 1.0 | 1.0 | 540 | $875 | $1.62 | 21d | 1 | 1.18mi |
| 9310 Shirley Gardens Dr Apt C St. Louis, MO | 2.0 | 1.0 | 800 | $1,200 | $1.50 | 43d | 1 | 1.19mi |
| 9310 Shirley Gardens Dr Apt B St. Louis, MO | 2.0 | 1.0 | 800 | $1,100 | $1.38 | 43d | 1 | 1.19mi |
| 11120 Graben Dr St Ann, MO | 1.0–2.0 | 1.0–1.5 | 850 | $1,250 | $1.47 | 1d | 14 | 1.23mi |
| 9429 Baltimore Ave Saint Louis, MO | 2.0 | 1.0 | 900 | $1,200 | $1.33 | 23d | 1 | 1.25mi |
| 11276 Liana Ln Saint Ann, MO | 2.0 | 1.0 | 780 | $1,189 | $1.52 | 4d | 1 | 1.29mi |
| 3010 Woodson Rd Breckenridge Hills, MO | 1.0 | 1.0 | 850 | $895 | $1.05 | 43d | 1 | 1.33mi |
| 4616 Country Ln St Ann, MO | 2.0 | 1.0–2.0 | 758 | $1,505 | $1.99 | 2d | 9 | 1.45mi |
Listing history 15 events
-
2026-04-16$150,000 Active 453-char remark
Show marketing remark (453 chars)
Fantastic opportunity in St. Ann! This 2-bedroom, 1-bathroom home features a functional main-floor layout and a finished walk-out basement that includes a family room and a versatile space perfect for a home office or additional sleeping area. Currently tenant-occupied, this is a perfect turn-key addition to your portfolio. Due to tenant occupancy, showings are limited. Join us for an Open House on Thursday, April 16th, from 4:00 PM – 7:00 PM.
-
2026-04-09historical $150,000 453-char remark
Show marketing remark (453 chars)
Fantastic opportunity in St. Ann! This 2-bedroom, 1-bathroom home features a functional main-floor layout and a finished walk-out basement that includes a family room and a versatile space perfect for a home office or additional sleeping area. Currently tenant-occupied, this is a perfect turn-key addition to your portfolio. Due to tenant occupancy, showings are limited. Join us for an Open House on Thursday, April 16th, from 4:00 PM – 7:00 PM.
-
2023-10-06soldstatus Closed 259-char remark
Show marketing remark (259 chars)
Check out this wonderful new listing in St. Ann! This cute ranch home comes with lots of updates, a finished lower level, and much, much more! - Check it out today before it's gone! - NO SHOWINGS UNTIL THE OPEN HOUSE ON SUNDAY, AUGUST 27TH FROM 1:00-3:00 P.M.
-
2023-09-14status Pending 259-char remark
Show marketing remark (259 chars)
Check out this wonderful new listing in St. Ann! This cute ranch home comes with lots of updates, a finished lower level, and much, much more! - Check it out today before it's gone! - NO SHOWINGS UNTIL THE OPEN HOUSE ON SUNDAY, AUGUST 27TH FROM 1:00-3:00 P.M.
-
2023-09-01historical Active Under Contract 259-char remark
Show marketing remark (259 chars)
Check out this wonderful new listing in St. Ann! This cute ranch home comes with lots of updates, a finished lower level, and much, much more! - Check it out today before it's gone! - NO SHOWINGS UNTIL THE OPEN HOUSE ON SUNDAY, AUGUST 27TH FROM 1:00-3:00 P.M.
-
2023-08-30status Active 259-char remark
Show marketing remark (259 chars)
Check out this wonderful new listing in St. Ann! This cute ranch home comes with lots of updates, a finished lower level, and much, much more! - Check it out today before it's gone! - NO SHOWINGS UNTIL THE OPEN HOUSE ON SUNDAY, AUGUST 27TH FROM 1:00-3:00 P.M.
-
2023-08-30status Pending 259-char remark
Show marketing remark (259 chars)
Check out this wonderful new listing in St. Ann! This cute ranch home comes with lots of updates, a finished lower level, and much, much more! - Check it out today before it's gone! - NO SHOWINGS UNTIL THE OPEN HOUSE ON SUNDAY, AUGUST 27TH FROM 1:00-3:00 P.M.
-
2023-08-25$139,900 Active 259-char remark
Show marketing remark (259 chars)
Check out this wonderful new listing in St. Ann! This cute ranch home comes with lots of updates, a finished lower level, and much, much more! - Check it out today before it's gone! - NO SHOWINGS UNTIL THE OPEN HOUSE ON SUNDAY, AUGUST 27TH FROM 1:00-3:00 P.M.
-
2018-05-15soldstatus $89,900
-
2018-05-11status Pending
-
2018-05-11soldstatus Closed
-
2018-04-02historical Contingent (No Kickout)
-
2018-03-24$89,900 Active
-
2004-10-05soldstatus $105,000
-
1992-01-03soldstatus $52,000
ⓘ Source: listings_history table (triggers on properties + properties_extension) + one-shot
backfill from property_details.listing_events for pre-trigger history.
Tax reassessment forecast MO · Resets to sale price
- Current annual tax
- $1,655 · $138/mo
- Projected year-2 tax
- $1,655 · $138/mo
- Expected delta
- $0/yr ($0/mo · 0.0%)
ⓘ Screening estimate from a state-policy table — verify with the county assessor before closing.
Climate risk First Street
- Flood 1/10 Low FEMA zone X (unshaded) · 0% chance over 30 yrs
- Wildfire 1/10 Low
- Heat 4/10 Moderate 7 d/yr ≥106°F today · 21 d/yr by 30 yrs out
- Wind 2/10 Low 100% chance of damaging wind over 30 yrs
- Air quality 2/10 Low 1 unhealthy d/yr today · 3 by 30 yrs out
Nearby sold comps map
Loading sold comps map…
Walkable amenities ~0.75 mi
Loading nearby amenities…
Taxation est. · year 1
- Rental income
- $15,721
- − Mortgage interest
- −$8,402
- − Property taxes
- −$1,655
- − Insurance
- −$750
- − Repairs & maintenance
- −$1,258
- − Management
- −$1,258
- − Depreciation
- −$4,364
- Taxable loss
- −$1,965
- Est. tax savings @ 24.0%
- +$472
- After-tax cash flow
- $1,047/yr
For passive investors: Depreciation is non-cash, so a rental often shows a tax loss while cash-flowing — sheltering income. Rental losses are passive: they offset passive income freely, and up to $25,000/yr can offset ordinary (W-2) income if you actively participate and your MAGI is under $100k (phasing out to $0 by $150k); unused losses carry forward. On sale, claimed depreciation is recaptured at up to 25%, and gains may owe capital-gains tax (a 1031 exchange can defer both). Figures are a year-1 estimate at your 24.0% rate — not tax advice; consult a CPA.
Schools (NCES district)
- District
- Ritenour
- NCES district ID
- 2926640
- Math proficiency
- 13% ▼ -14.00%
- Reading proficiency
- 27% ▼ -7.00%
- Median HH income
- $41,410
- Composite
- 17.04/100
- National rank
- #9125
- State rank
- #304 of 324 in MO
Livability — St. Ann
No livability data for this city. (Only ~50 U.S. cities are tracked.)
Census & demographics
- Census place
- St. Ann, MO
- County
- Saint Louis County · 888,823 people
- City population
- 16,237
- Metro
- St. Louis, MO-IL
- Population (ZIP)
- 15,793
- Household income
- $51,610
- Rent vs Own
- Severe rent burden
- 782.0
Population outlook (St. Louis County) Hauer SSP2
- Today (2025)
- 1,025,227 people
- By 2030
- 1,028,023 · +0.3%
- By 2040
- 1,020,940 · -0.4%
- By 2050
- 1,007,280 · -1.8%
- By 2075
- 987,277 · -3.7%
- By 2100
- 921,984 · -10.1%
Race, ethnicity, and origin ACS 2023
- Neighborhood character
- Diverse neighborhood (Simpson 0.65)
- Race & ethnicity
- White 50% Black 27% Hispanic / Latino 19% Two or more races 5% Asian 2%
- Hispanic origin (detail)
- Mexican 16%
- Common ancestry
- Lithuanian 2% Italian 1% Romanian 1%
- Foreign-born
- 13% · Canada, China
- Languages at home
- 80% English-only · Spanish 17% Chinese 1% German/W. Germanic 1%
Political lean MEDSL · St. Louis
- 2024 margin
- Strong D (+23.4) · D 60.8% · R 37.4% · Other 1.7%
- 2008→2024 swing
- +3.5pp toward D · 2008: 19.9pp · 2024: 23.4pp
- All cycles
- 2024: D+23.4 2020: D+24.0 2016: D+16.2 2012: D+13.7 2008: D+19.9
Not yet ingested
- Civics
- —
Market trends
- HPI YoY
- ▼ -242.89%
- Current HPI
- 210.6588
- Rent YoY
- ▲ 4.14%
- Metro
- St. Louis, MO-IL
- State GDP YoY
- ▲ 1.84%
- F500 in state
- 20
Industry mix (Fortune 500 HQ in MO)
| Industry | F500 HQs | Revenue |
|---|---|---|
| Healthcare | 1 | $163B |
|
||
| Insurance | 1 | $21B |
|
||
| Industrial Technology | 1 | $17B |
|
||
| Retail | 1 | $16B |
|
||
| Industrial Distribution | 1 | $10B |
|
||
| Utilities | 1 | $9B |
|
||
Price history
+188.5% since first listed15 events — show timeline
- 2026-04-16 Listed $150,000 MARIS as Distributed by MLS Grid
- 2026-04-09 Coming Soon $150,000 MARIS as Distributed by MLS Grid
- 2023-10-06 Sold (MLS) — MARIS as Distributed by MLS Grid
- 2023-09-14 Pending — MARIS as Distributed by MLS Grid
- 2023-09-01 Contingent — MARIS as Distributed by MLS Grid
- 2023-08-30 Relisted — MARIS as Distributed by MLS Grid
- 2023-08-30 Pending — MARIS as Distributed by MLS Grid
- 2023-08-25 Listed $139,900 MARIS as Distributed by MLS Grid
- 2018-05-15 Sold (Public Records) $89,900 Public Records
- 2018-05-11 Pending — MARIS as Distributed by MLS Grid
- 2018-05-11 Sold (MLS) — MARIS as Distributed by MLS Grid
- 2018-04-02 Contingent — MARIS as Distributed by MLS Grid
- 2018-03-24 Listed $89,900 MARIS as Distributed by MLS Grid
- 2004-10-05 Sold (Public Records) $105,000 Public Records
- 1992-01-03 Sold (Public Records) $52,000 Public Records
Property tax history
+3.2%/yrLatest (2022): $1,655 · +0.1% YoY. Source: county tax records.
Cash-flow waterfall
monthlySold comps — $/sqft
last 12 mo · ≤1 miLoading sold comps…