 Multi-family
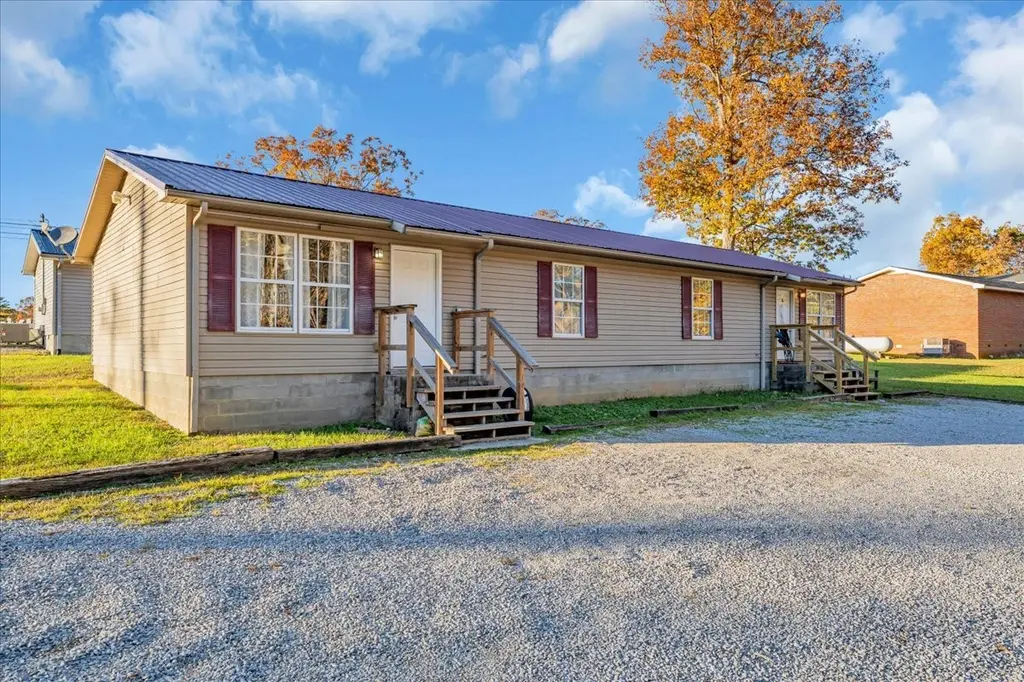
34 SR 399 · Palmer, TN
Flood risk 1/10 · Minimal
- FEMA flood zone
- X (unshaded)
- Chance of flooding over 30 yrs
- 0.0%
- Est. flood insurance / yr
- $507 – $1,088
Fire risk 7/10 · Major
- Est. fire insurance / yr
- $949 – $1,763
Heat risk 4/10 · Minor
- Hot days now (above 100°F)
- 7 days/yr
- Hot days in 30 yrs
- 21 days/yr
Wind risk 4/10 · Minor
- Chance of severe wind over 30 yrs
- 10.0%
Air-quality risk 3/10 · Minor
- Unhealthy air days now
- 2 days/yr
- Unhealthy air days in 30 yrs
- 2 days/yr
Risk factors via First Street. Map © Google.
Why this score? — see what drove the C- grade
The composite is a weighted blend of 9 inputs, each scored 0–100. Each bar is that input's sub-score; the figure is the points it added to the 100-point composite (weight × sub-score).
- Cash flow +23.4/30.0
- DSCR +7.5/10.0
- 1% rule +5.0/10.0
- Appreciation +5.0/10.0
- ARV discount +2.5/15.0
- Rent growth +2.5/5.0
- Condition / age +2.5/5.0
- Livability +2.4/5.0
- Schools +1.8/10.0
$170,000
🖨 Deal sheet 📄 Offer letter ✓ Due diligence
Multi-family units
County records classify this as Multi-Family (2-4 Unit). Listing-text estimate: 1 unit. estimate disagrees with records
Listing remarks MLS
Excellent investment opportunity on a spacious 1-acre lot. This well-maintained duplex offers two separate units, each featuring 2 bedrooms, 1 full bath, and approximately 900 square feet of living space with an open kitchen and living area. Recent updates include brand-new porches on both units, hot water heaters replaced within the last two years, septic tank pumped (serviced last year), and new main water lines installed to both properties. Perfect for investors or owner-occupants seeking rental income in a move-in-ready property.
Key facts
- New porches
- Hot water heaters
- Septic tank pumped
Tags
Neighborhood map
What this means for you Summary
Snapshot
- This is a 4-bed/3.0-bath multifamily listed at $170k.
Deal economics
- At list price, monthly cash flow is $314 ($4k/yr) — positive.
- The deal already cash-flows at list — no discount required.
- To meet the 1% rule (rent ≥ 1% of price), the offer needs to be $170k (0.2% below list).
- Recommended offer: $150k (12.0% below list) — sets the bar for market timing.
Location & tenants
- Location reads 47/100 on livability (#421 in TN) — a working-class tenant base; expect higher turnover. Strengths: cost of living A+, housing A+; Watch: schools F, crime F, amenities F.
- Grundy County (rural): math 21% / reading 23% proficiency, ranked #110 of 139 in TN (top 79%) — low school quality limits family demand, transient renter base, plan for 1-2y turnover; 72% free/reduced lunch — lower-income household profile, screen leases tightly.
- Market conditions: 28 active listings in the ZIP; 16 units permitted in Grundy County in 2024 (0 in 5+ unit buildings).
Forward outlook
- In year one you build about $6k of equity ($1k loan paydown + $5k appreciation (3.0% local appreciation)).
- Grundy County population projected at -24% by 2050 — secular population decline; favor cash flow + early exit over multi-decade hold.
- At projected returns (3.0% appreciation + 3.0% rent growth), your $48k cash investment doubles in ~5 years — after that, you're playing with house money.
- By year 6, paydown + projected appreciation supports a ~$33k cash-out refi (75% LTV) — recoverable capital for the next deal without selling this one.
Negotiation context
- It's been on market 224 days — a 12% lower offer ($150k) is reasonable based on typical stale-listing flexibility.
- 6 sale attempts since 12y ago with the ask held roughly flat each time — persistent listings suggest the price (not the market) is what's stuck; bring a comps-based counter.
- Current owner paid $120k; 42% above their basis — modest negotiation headroom, anchor on the comps not their cost.
Risks & watch-outs
- Climate carrying-cost: major wildfire risk — expect insurance premiums to compound above CPI over the hold.
Questions for the listing agent
- It's been on market 224 days. Have you received any prior offers? Is the seller open to a 12% concession, seller financing, or rate buy-down credit?
- Why hasn't it sold? Are there any deal-killer items the seller is aware of (foundation, flood, title, zoning, code violations)?
- Is there a deadline driving the sale (1031 exchange, divorce, estate, relocation)? That informs how much negotiation room exists.
- Schools are F-rated, which usually means shorter tenancies and higher turnover. Who's the typical renter profile here, and what's been the actual vacancy rate?
- Crime grade is F in this area — have there been break-ins, vandalism, or insurance claims at this property in the last 3 years? What carrier currently insures it and at what premium?
- What's the average days-on-market for RENTAL listings here right now (not sales)? A rising rental-DOM trend means longer vacancies and softer asking-rent achievability than the comps imply.
- What's the recent tenant-quality profile in this submarket — average credit score on applications, eviction rate, late-payment / NSF rate, and stable-employment percentage? A property-management company in the area should have these aggregated.
- How much new apartment / multifamily construction is in the pipeline within 1–3 miles? Heavy new supply (>2% of stock underway) typically softens rents 12–24 months out; light construction supports rent growth.
Investment metrics
- 1% rule
- 1.00% ✗
- Cap rate
- 8.51%
- Cash-on-cash
- 7.90%
- DSCR
- 1.35
- GRM
- 8.4
CMA / ARV
- ARV (median comp)
- $152,939
- List price
- $170,000
- Delta
- 11.16%
- Verdict
- OVERPRICED
- Comps
- 8 within 1.0 mi
Projected returns pro-forma
3.0% appreciation · 3.0% rent growth · sell at horizon
- IRR
- 14.9%
- Equity multiple
- 1.85×
- Total profit
- $40,381
- Equity at exit
- $76,439
- IRR
- 16.6%
- Equity multiple
- 3.43×
- Total profit
- $115,705
- Equity at exit
- $117,802
Cash invested: $47,600 (down + closing). Projections, not guarantees.
Landlord ↔ Tenant lean methodology
- Overall (STATE)
- 87 Strongly Landlord-Friendly
- State Tennessee
- 87 Strongly Landlord-Friendly · R+13
- County
- — inherits STATE
- City
- — inherits STATE
ZIP-level market 37365
- Active inventory
- 28
- Price-to-rent
- 16.7×
Monthly cashflow live
- Estimated rent
- $1,696 medium interval (Pro) →
- Mortgage (P&I)
- −$891
- Tax from tax record
- −$64 /mo · $768/yr
- Insurance
- −$71
- HOA
- −$0
- Vacancy / Maint / Mgmt
- −$356
- Net cashflow
- $314
Break-even live
2-unit breakdown (identical units grouped — click to expand)
| Units | Beds | Baths | Est. rent |
|---|---|---|---|
| 2× units | 2 | 1 | $1,696 |
| #1 | 2 | 1 | $848 |
| #2 | 2 | 1 | $848 |
| Total (2 units) | $1,696 | ||
UW: 25.0% down · 7.5% · 30yr · 1.5% tax · 5.0% vac · 8.0% maint · 8.0% mgmt
Financing live
Cash to close
- Down payment
- $42,500
- Closing costs
- $5,100
- Reserves months
- —
- Total cash needed
- —
Loan-product check · same deal, 3 products live
Conventional
25% down · 7.5% · 30yr
- Down + closing
- —
- Monthly P&I
- —
- Monthly cashflow
- —
- DSCR
- —
- Eligible?
- —
Personal DTI + credit; lowest rate.
DSCR
20% down · 8.5% · 30yr
- Down + closing
- —
- Monthly P&I
- —
- Monthly cashflow
- —
- DSCR
- —
- Eligible?
- —
No personal income docs; deal must DSCR.
Hard money
10% down · 12.0% · 12mo
- Down + closing
- —
- Monthly P&I
- —
- Monthly cashflow
- —
- DSCR
- —
- Eligible?
- —
Short-term bridge; refi at stabilization.
Listing history 26 events
-
2026-06-19days on market $170,000 Active 224 DOM
-
2026-06-18days on market $170,000 Active 223 DOM
-
2026-06-17days on market $170,000 Active 222 DOM
-
2026-06-16days on market $170,000 Active 221 DOM
-
2026-06-15days on market $170,000 Active 220 DOM
-
2026-06-14days on market $170,000 Active 218 DOM
-
2026-06-12days on market $170,000 Active 217 DOM
-
2026-06-09days on market $170,000 Active 214 DOM
-
2026-06-08days on market $170,000 Active 213 DOM
-
2026-06-07days on market $170,000 Active 212 DOM
-
2026-06-02days on market $170,000 Active 207 DOM
-
2026-06-01days on market $170,000 Active 206 DOM
-
2026-05-31days on market $170,000 Active 205 DOM
-
2026-05-30days on market $170,000 Active 204 DOM
-
2026-04-29status Active 541-char remark
Show marketing remark (541 chars)
Excellent investment opportunity on a spacious 1-acre lot. This well-maintained duplex offers two separate units, each featuring 2 bedrooms, 1 full bath, and approximately 900 square feet of living space with an open kitchen and living area. Recent updates include brand-new porches on both units, hot water heaters replaced within the last two years, septic tank pumped (serviced last year), and new main water lines installed to both properties. Perfect for investors or owner-occupants seeking rental income in a move-in-ready property.
-
2026-04-22historical 541-char remark
Show marketing remark (541 chars)
Excellent investment opportunity on a spacious 1-acre lot. This well-maintained duplex offers two separate units, each featuring 2 bedrooms, 1 full bath, and approximately 900 square feet of living space with an open kitchen and living area. Recent updates include brand-new porches on both units, hot water heaters replaced within the last two years, septic tank pumped (serviced last year), and new main water lines installed to both properties. Perfect for investors or owner-occupants seeking rental income in a move-in-ready property.
-
2025-10-31$175,000 Active 541-char remark
Show marketing remark (541 chars)
Excellent investment opportunity on a spacious 1-acre lot. This well-maintained duplex offers two separate units, each featuring 2 bedrooms, 1 full bath, and approximately 900 square feet of living space with an open kitchen and living area. Recent updates include brand-new porches on both units, hot water heaters replaced within the last two years, septic tank pumped (serviced last year), and new main water lines installed to both properties. Perfect for investors or owner-occupants seeking rental income in a move-in-ready property.
-
2025-07-15historical
-
2025-02-04$235,000 Active
-
2022-08-16soldstatus $120,000
-
2017-08-11soldstatus $75,000
-
2016-01-09historical
-
2015-08-08$78,900 Active
-
2015-07-31historical
-
2015-01-06$78,900 Active
-
2014-08-06$78,900
ⓘ Source: listings_history table (triggers on properties + properties_extension) + one-shot
backfill from property_details.listing_events for pre-trigger history.
Tax reassessment forecast TN · Resets to sale price
- Current annual tax
- $768 · $64/mo
- Projected year-2 tax
- $1,207 · $101/mo
- Expected delta
- +$439/yr (+$37/mo · 57.2%)
ⓘ Screening estimate from a state-policy table — verify with the county assessor before closing.
Climate risk First Street
- Flood 1/10 Low FEMA zone X (unshaded) · 0% chance over 30 yrs
- Wildfire 7/10 Severe
- Heat 4/10 Moderate 7 d/yr ≥100°F today · 21 d/yr by 30 yrs out
- Wind 4/10 Moderate 10% chance of damaging wind over 30 yrs
- Air quality 3/10 Moderate 2 unhealthy d/yr today · 2 by 30 yrs out
Nearby sold comps map
Loading sold comps map…
Walkable amenities ~0.75 mi
Loading nearby amenities…
Taxation est. · year 1
- Rental income
- $20,352
- − Mortgage interest
- −$9,523
- − Property taxes
- −$768
- − Insurance
- −$850
- − Repairs & maintenance
- −$1,628
- − Management
- −$1,628
- − Depreciation
- −$4,945
- Taxable income
- $1,010
- Est. tax owed @ 24.0%
- −$242
- After-tax cash flow
- $3,520/yr
For passive investors: Depreciation is non-cash, so a rental often shows a tax loss while cash-flowing — sheltering income. Rental losses are passive: they offset passive income freely, and up to $25,000/yr can offset ordinary (W-2) income if you actively participate and your MAGI is under $100k (phasing out to $0 by $150k); unused losses carry forward. On sale, claimed depreciation is recaptured at up to 25%, and gains may owe capital-gains tax (a 1031 exchange can defer both). Figures are a year-1 estimate at your 24.0% rate — not tax advice; consult a CPA.
Schools (NCES district)
- District
- Grundy County
- NCES district ID
- 4701530
- Math proficiency
- 21% ▼ -4.00%
- Reading proficiency
- 23% ▼ -3.00%
- Median HH income
- $28,948
- Composite
- 17.56/100
- National rank
- #9044
- State rank
- #110 of 139 in TN
Livability — Palmer
- Score
- 47/100
- State rank
- #421
- US rank
- #26252
Category grades
Schools grade is shown separately in the Schools card above.
Census & demographics
- Population (ZIP)
- 1,729
Population outlook (Grundy County) Hauer SSP2
- Today (2025)
- 12,660 people
- By 2030
- 12,088 · -4.5%
- By 2040
- 10,879 · -14.1%
- By 2050
- 9,666 · -23.6%
- By 2075
- 7,126 · -43.7%
- By 2100
- 4,941 · -61.0%
Race, ethnicity, and origin ACS 2023
- Neighborhood character
- Predominantly White (97%)
- Race & ethnicity
- White 97% Two or more races 3%
- Common ancestry
- Scottish 5% Slovak 3% Lithuanian 1%
Political lean MEDSL · Grundy
- 2024 margin
- Solid R (+69.3) · D 15.0% · R 84.3%
- 2008→2024 swing
- -56.5pp toward R · 2008: -12.8pp · 2024: -69.3pp
- All cycles
- 2024: R+69.3 2020: R+65.2 2016: R+55.3 2012: R+20.5 2008: R+12.8
Not yet ingested
- Civics
- —
Market trends
- HPI YoY
- —
- Current HPI
- —
- Rent YoY
- —
- Metro
- —
- State GDP YoY
- ▲ 2.78%
- F500 in state
- 22
Industry mix (Fortune 500 HQ in TN)
| Industry | F500 HQs | Revenue |
|---|---|---|
| Healthcare | 3 | $91B |
|
||
| Retail | 3 | $72B |
|
||
| Transportation / Logistics | 1 | $88B |
|
||
| Paper / Packaging | 1 | $19B |
|
||
| Insurance | 1 | $13B |
|
||
| Energy | 1 | $12B |
|
||
Price history
+121.8% since first listed12 events — show timeline
- 2026-04-29 Relisted — REALTRACS as Distributed by MLS Grid
- 2026-04-22 Listing Removed — REALTRACS as Distributed by MLS Grid
- 2025-10-31 Listed $175,000 REALTRACS as Distributed by MLS Grid
- 2025-07-15 Listing Removed — REALTRACS as Distributed by MLS Grid
- 2025-02-04 Listed $235,000 REALTRACS as Distributed by MLS Grid
- 2022-08-16 Sold (Public Records) $120,000 Public Records
- 2017-08-11 Sold (Public Records) $75,000 Public Records
- 2016-01-09 Listing Removed — REALTRACS as Distributed by MLS Grid
- 2015-08-08 Listed $78,900 REALTRACS as Distributed by MLS Grid
- 2015-07-31 Listing Removed — REALTRACS as Distributed by MLS Grid
- 2015-01-06 Listed $78,900 REALTRACS as Distributed by MLS Grid
- 2014-08-06 Listed $78,900 REALTRACS as Distributed by MLS Grid
Property tax history
-0.9%/yrLatest (2025): $768 · +0.0% YoY. Source: county tax records.
Cash-flow waterfall
monthlySold comps — $/sqft
last 12 mo · ≤1 miLoading sold comps…