 🌊 Lakefront
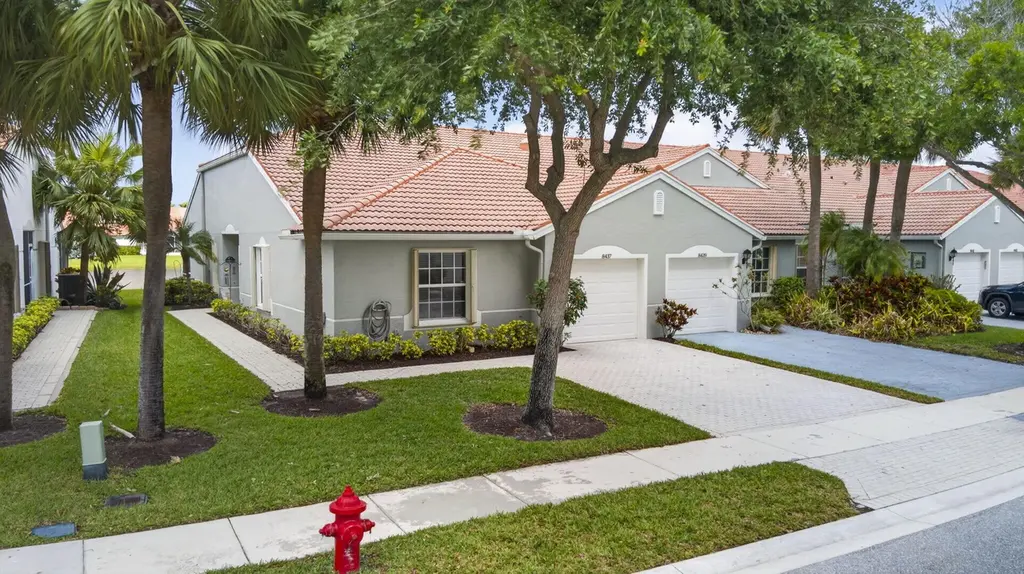
8437 Logia Cir · Greenacres, FL
Flood risk 1/10 · Minimal
- FEMA flood zone
- X (unshaded)
- Chance of flooding over 30 yrs
- 0.0%
- Est. flood insurance / yr
- $507 – $1,088
Fire risk 1/10 · Minimal
- Est. fire insurance / yr
- $947 – $1,759
Heat risk 9/10 · Severe
- Hot days now (above 106°F)
- 7 days/yr
- Hot days in 30 yrs
- 26 days/yr
Wind risk 10/10 · Severe
- Chance of severe wind over 30 yrs
- 99.0%
Air-quality risk 2/10 · Minimal
- Unhealthy air days now
- 0 days/yr
- Unhealthy air days in 30 yrs
- 2 days/yr
Risk factors via First Street. Map © Google.
Why this score? — see what drove the D- grade
The composite is a weighted blend of 9 inputs, each scored 0–100. Each bar is that input's sub-score; the figure is the points it added to the 100-point composite (weight × sub-score).
- Cash flow +7.5/30.0
- ARV discount +7.5/15.0
- Appreciation +5.1/10.0
- 1% rule +4.6/10.0
- Schools +4.3/10.0
- Livability +3.5/5.0
- Rent growth +2.5/5.0
- Condition / age +2.5/5.0
- DSCR +1.6/10.0
$335,000
🖨 Deal sheet (PDF) 📄 Offer letter ✓ Due diligence
Listing remarks MLS
DROP DEAD GORGEOUS W/ ONE OF A KIND VIEW--UPGRADES AND TASTE!CORNER VILLA W/ TRIPLE SIZED SCREENED PATIO OVERLOOKING LAKE. NEUTRAL TONES &TILE THROUGHOUT AND MORE!
Key facts
- Lakefront
- Tranquil lake views
- Screened lanai
Tags
Property features AI
Finance
- Other: Pets allowed (breed restrictions and possible pet restrictions); Part of a senior community; Community contains multiple units
- HOA & community: Community association with amenities including clubhouse, fitness center, pool, spa/hot tub, tennis and pickleball courts, billiard and game rooms, business center, café/restaurant, community room, library, jogging path, recreation facilities; gated community features; HOA fee paid monthly
Exterior
- Parking: Attached 1-car garage; Driveway (covered spaces: 1, total parking for 2)
- Security: Gated community with guard; Security system
- Utilities: Public water; Public sewer; Electricity available; Water available
- Home design: Villa; Single-story; Resale property; Faces south
- Construction: CBS construction; Barrel roof; Built as a single-story structure
- Exterior features: Screened patio; Patio; Waterfront
Interior
- Kitchen: Dishwasher; Refrigerator; Electric water heater
- Bedrooms: 2 bedrooms on the main level
- Flooring: Ceramic tile
- Bathrooms: 2 full bathrooms (main level)
- Heating & cooling: Central heating; Central air conditioning
- Interior features: Cathedral and vaulted ceilings; Split bedroom layout; Unfurnished
- Laundry & utility: Indoor laundry
Neighborhood map
What this means for you Summary
Snapshot
- This is a 3-bed/2.0-bath single-family listed at $335k.
Deal economics
- At list price, monthly cash flow is $-413 ($-5k/yr) — negative.
- To cash-flow at today's rent, offer at most $262k (21.8% below list).
- To meet the 1% rule (rent ≥ 1% of price), the offer needs to be $322k (3.9% below list).
- Recommended offer: $262k (21.8% below list) — sets the bar for cash-flow.
Location & tenants
- Location reads 69/100 on livability (#490 in FL) — a middle-class / working-renter tenant base. Strengths: cost of living A+, housing A+, health & safety A; Watch: employment D, amenities F, commute F.
- Palm Beach (suburban): math 46% / reading 53% proficiency, ranked #34 of 73 in FL (top 47%) — families likely to look elsewhere, expect single-tenant / working-renter base with shorter leases.
- Zoned schools: Sunset Palms Elementary School (math 80% / reading 79%, grade A, #116 of 2,144 statewide, top 6%, 920 students, 13% FRL); Park Vista Community High School (math 43% / reading 64%, grade C-, #146 of 667 statewide, top 22%, 3,191 students, 28% FRL) — zoned schools average 21% FRL vs 52% district-wide (31 pts lower); this property's tenant base skews higher-income than the district average.
- Zoned-school proficiency averages 66% at this address vs 50% district-wide (+17 pts) — the actual schools serving this property are materially stronger than the Palm Beach average implies; a family-tenant draw the district grade alone would hide.
- Market conditions: 173 active listings in the ZIP; 16 comparable units currently listed for rent nearby; rentals at typical pace (median 24d on market — plan ~3-4 weeks tenant-placement turnaround); 3,974 units permitted in Palm Beach County in 2024 (1,012 in 5+ unit buildings).
Forward outlook
- In year one you build about $3k of equity ($2k loan paydown + $664 appreciation (0.2% local appreciation)).
- Palm Beach County population projected at +30% by 2050 — long-run rental-demand tailwind backs the buy-and-hold thesis.
- By year 9, paydown + projected appreciation supports a ~$33k cash-out refi (75% LTV) — recoverable capital for the next deal without selling this one.
Negotiation context
- It's been on market 22 days — a 2% lower offer ($330k) is reasonable based on typical stale-listing flexibility.
- 2 sale attempts since 23y ago with the ask held roughly flat each time — persistent listings suggest the price (not the market) is what's stuck; bring a comps-based counter.
- Current owner paid $290k; 16% above their basis — modest negotiation headroom, anchor on the comps not their cost.
Risks & watch-outs
- Watch-outs: HOA is 20% of rent.
- Climate carrying-cost: severe wind risk, 99% chance of damaging wind over 30y; extreme-heat days projected 7→26/yr by 2055 (HVAC capex compounding) — expect insurance premiums to compound above CPI over the hold.
Questions for the listing agent
- What do current leases actually rent for vs. the listed asking? Can we see a recent rent roll and the last 12 months of T-12 income?
- What does the HOA fee cover, when was the last increase, and are there any pending special assessments or reserve-fund shortfalls?
- Is there a deadline driving the sale (1031 exchange, divorce, estate, relocation)? That informs how much negotiation room exists.
- Schools are D-rated, which usually means shorter tenancies and higher turnover. Who's the typical renter profile here, and what's been the actual vacancy rate?
- The area grade is low — what's the realistic commute time and amenity access for the typical tenant pool here? Any planned neighborhood developments (good or bad) we should know about?
- This sits on a lake — are riparian / water-frontage rights deeded with the parcel? Any dock permits, shoreline easements, or HOA water-use restrictions?
- What's the documented flood / surge / shoreline-erosion history here (FEMA AND non-FEMA — e.g., storm surge, creek backup, septic-field saturation)?
- Any water-quality or seasonal algae-bloom issues that affect tenant satisfaction or short-term-rental demand?
- What's the average days-on-market for RENTAL listings here right now (not sales)? A rising rental-DOM trend means longer vacancies and softer asking-rent achievability than the comps imply.
- What's the recent tenant-quality profile in this submarket — average credit score on applications, eviction rate, late-payment / NSF rate, and stable-employment percentage? A property-management company in the area should have these aggregated.
- How much new for-sale + rental construction is in the pipeline within 1–3 miles? Heavy new supply typically softens prices + rents 12–24 months out; constrained supply supports both.
Investment metrics
- 1% rule
- 0.96% ✗
- Cap rate
- 4.81%
- Cash-on-cash
- -5.29%
- DSCR
- 0.76
- GRM
- 8.7
CMA / ARV
No comps found within radius.
Projected returns pro-forma
0.2% appreciation · 3.0% rent growth · sell at horizon
- IRR
- -7.3%
- Equity multiple
- 0.65×
- Total profit
- $-32,550
- Equity at exit
- $100,605
- IRR
- -1.3%
- Equity multiple
- 0.86×
- Total profit
- $-12,928
- Equity at exit
- $123,623
Cash invested: $93,800 (down + closing). Projections, not guarantees.
Landlord ↔ Tenant lean methodology
- Overall (STATE)
- 87 Strongly Landlord-Friendly
- State Florida
- 87 Strongly Landlord-Friendly · R+3
- County
- — inherits STATE
- City
- — inherits STATE
ZIP-level market 33472
- Home prices YoY
- 0.1%
- Active inventory
- 173
- Price-to-rent
- 8.7×
Monthly cashflow live
- Estimated rent
- $3,218 high interval (Pro) →
- Mortgage (P&I)
- −$1,757
- Tax from tax record
- −$408 /mo · $4,890/yr
- Insurance
- −$140
- HOA
- −$652
- Vacancy / Maint / Mgmt
- −$676
- Net cashflow
- $-413
Break-even live
Sensitivity live
| Price | -10% $-224 | -5% $-319 | +0% $-413 | +5% $-508 | +10% $-603 |
|---|---|---|---|---|---|
| Rent | -10% $-668 | -5% $-540 | +0% $-413 | +5% $-286 | +10% $-159 |
| Rate | -1.0pp $-245 | -0.5pp $-328 | base $-413 | +0.5pp $-500 | +1.0pp $-588 |
UW: 25.0% down · 7.5% · 30yr · 1.5% tax · 5.0% vac · 8.0% maint · 8.0% mgmt
Financing live
Cash to close
- Down payment
- $83,750
- Closing costs
- $10,050
- Reserves months
- —
- Total cash needed
- —
Loan-product check · same deal, 3 products live
Conventional
25% down · 7.5% · 30yr
- Down + closing
- —
- Monthly P&I
- —
- Monthly cashflow
- —
- DSCR
- —
- Eligible?
- —
Personal DTI + credit; lowest rate.
DSCR
20% down · 8.5% · 30yr
- Down + closing
- —
- Monthly P&I
- —
- Monthly cashflow
- —
- DSCR
- —
- Eligible?
- —
No personal income docs; deal must DSCR.
Hard money
10% down · 12.0% · 12mo
- Down + closing
- —
- Monthly P&I
- —
- Monthly cashflow
- —
- DSCR
- —
- Eligible?
- —
Short-term bridge; refi at stabilization.
Rent comps 16 comps
| Address | Beds | Baths | Sqft | Rent | $/sqft | DOM | Units | Dist |
|---|---|---|---|---|---|---|---|---|
| 8063 Dolomtian Way Boynton Beach, FL | 2.0 | 2.0 | 1417 | $3,100 | $2.19 | 0d | 1 | 0.18mi |
| 8481 Siciliano St Unit 8481 Boynton Beach, FL | 3.0 | 2.0 | 1774 | $3,650 | $2.06 | 26d | 1 | 0.38mi |
| 8451 Siciliano St Boynton Beach, FL | 3.0 | 2.0 | 1627 | $3,200 | $1.97 | 14d | 1 | 0.39mi |
| 7975 Rockford Rd Boynton Beach, FL | 2.0 | 2.0 | 1720 | $3,700 | $2.15 | 26d | 1 | 0.87mi |
| 7430 Lyons Rd Wellington, FL | 1.0–3.0 | 1.0–2.0 | 1006 | $3,190 | $3.17 | 0d | 8 | 0.89mi |
| 7936 Rockford Rd Boynton Beach, FL | 3.0 | 2.0 | 1871 | $9,000 | $4.81 | 23d | 1 | 0.92mi |
| 7273 Burgess Dr Lake Worth, FL | 3.0 | 2.0 | 1385 | $2,630 | $1.90 | 9d | 1 | 0.96mi |
| 7600 Edisto Dr Lake Worth, FL | 3.0 | 2.5 | 1764 | $2,700 | $1.53 | 22d | 1 | 0.96mi |
| 7832 Rockford Rd Boynton Beach, FL | 3.0 | 2.0 | 1598 | $3,800 | $2.38 | 23d | 1 | 1.12mi |
| 7218 Michigan Isle Rd Lake Worth, FL | 3.0 | 2.0 | 1656 | $3,500 | $2.11 | 16d | 1 | 1.25mi |
| 7218 Michigan Isle Rd Lake Worth, FL | 3.0 | 2.0 | 1656 | $3,500 | $2.11 | 15d | 1 | 1.25mi |
| 9664 Porta Leona Ln Boynton Beach, FL | 3.0 | 2.5 | 1570 | $2,800 | $1.78 | 26d | 1 | 1.33mi |
| 9663 Lago Dr Boynton Beach, FL | 3.0 | 2.5 | 1570 | $2,680 | $1.71 | 26d | 1 | 1.33mi |
| 9680 Lago Dr Unit 9680 Boynton Beach, FL | 3.0 | 2.5 | 1570 | $2,750 | $1.75 | 26d | 1 | 1.35mi |
| 9772 Porta Leona Ln Boynton Beach, FL | 3.0 | 2.0 | 1502 | $2,750 | $1.83 | 26d | 1 | 1.40mi |
| 9798 Casa Mar Dr Lake Worth, FL | 3.0 | 2.0 | 1856 | $4,500 | $2.42 | 26d | 1 | 1.40mi |
HOA detail
- Monthly dues
- $652 · $7,824/yr
Listing history 8 events
-
2026-05-05status Pending
-
2026-04-24historical Active Under Contract
-
2026-04-12$335,000 Active
-
2004-11-16soldstatus $290,000
-
2003-09-10soldstatus $212,500
-
2003-06-27soldstatus $212,500 167-char remark
Show marketing remark (167 chars)
DROP DEAD GORGEOUS W/ ONE OF A KIND VIEW--UPGRADES AND TASTE!CORNER VILLA W/ TRIPLE SIZED SCREENED PATIO OVERLOOKING LAKE. NEUTRAL TONES &TILE THROUGHOUT AND MORE!
-
2003-05-01historical 167-char remark
Show marketing remark (167 chars)
DROP DEAD GORGEOUS W/ ONE OF A KIND VIEW--UPGRADES AND TASTE!CORNER VILLA W/ TRIPLE SIZED SCREENED PATIO OVERLOOKING LAKE. NEUTRAL TONES &TILE THROUGHOUT AND MORE!
-
2003-03-05$215,000 167-char remark
Show marketing remark (167 chars)
DROP DEAD GORGEOUS W/ ONE OF A KIND VIEW--UPGRADES AND TASTE!CORNER VILLA W/ TRIPLE SIZED SCREENED PATIO OVERLOOKING LAKE. NEUTRAL TONES &TILE THROUGHOUT AND MORE!
ⓘ Source: listings_history table (triggers on properties + properties_extension) + one-shot
backfill from property_details.listing_events for pre-trigger history.
Tax reassessment forecast FL · Resets to sale price
- Current annual tax
- $4,890 · $408/mo
- Projected year-2 tax
- $4,890 · $408/mo
- Expected delta
- $0/yr ($0/mo · 0.0%)
ⓘ Screening estimate from a state-policy table — verify with the county assessor before closing.
Climate risk First Street
- Flood 1/10 Low FEMA zone X (unshaded) · 0% chance over 30 yrs
- Wildfire 1/10 Low
- Heat 9/10 Extreme 7 d/yr ≥106°F today · 26 d/yr by 30 yrs out
- Wind 10/10 Extreme 99% chance of damaging wind over 30 yrs
- Air quality 2/10 Low 0 unhealthy d/yr today · 2 by 30 yrs out
Nearby sold comps map
Loading sold comps map…
Walkable amenities ~0.75 mi
Loading nearby amenities…
Taxation est. · year 1
- Rental income
- $38,621
- − Mortgage interest
- −$18,765
- − Property taxes
- −$4,890
- − Insurance
- −$1,675
- − Repairs & maintenance
- −$3,090
- − Management
- −$3,090
- − HOA
- −$7,824
- − Depreciation
- −$9,745
- Taxable loss
- −$10,458
- Est. tax savings @ 24.0%
- +$2,510
- After-tax cash flow
- $-2,450/yr
For passive investors: Depreciation is non-cash, so a rental often shows a tax loss while cash-flowing — sheltering income. Rental losses are passive: they offset passive income freely, and up to $25,000/yr can offset ordinary (W-2) income if you actively participate and your MAGI is under $100k (phasing out to $0 by $150k); unused losses carry forward. On sale, claimed depreciation is recaptured at up to 25%, and gains may owe capital-gains tax (a 1031 exchange can defer both). Figures are a year-1 estimate at your 24.0% rate — not tax advice; consult a CPA.
Schools (NCES district)
- District
- Palm Beach
- NCES district ID
- 1201500
- Math proficiency
- 46% ▼ -16.00%
- Reading proficiency
- 53% ▼ -4.00%
- Median HH income
- $53,943
- Composite
- 42.72/100
- National rank
- #3160
- State rank
- #34 of 73 in FL
Livability — Greenacres
- Score
- 69/100
- State rank
- #490
- US rank
- #9008
Category grades
Schools grade is shown separately in the Schools card above.
Census & demographics
- City population
- 65,478
- Population (ZIP)
- 18,689
Population outlook (Palm Beach County) Hauer SSP2
- Today (2025)
- 1,637,487 people
- By 2030
- 1,743,255 · +6.5%
- By 2040
- 1,948,712 · +19.0%
- By 2050
- 2,132,979 · +30.3%
- By 2075
- 2,530,027 · +54.5%
- By 2100
- 2,706,979 · +65.3%
Race, ethnicity, and origin ACS 2023
- Neighborhood character
- Diverse neighborhood (Simpson 0.56)
- Race & ethnicity
- White 63% Hispanic / Latino 18% Two or more races 14% Black 10% Asian 4%
- Hispanic origin (detail)
- Mexican 2% Puerto Rican 2% Cuban 7%
- Common ancestry
- Romanian 5% Scotch-Irish 4% Hispanic 3%
- Foreign-born
- 24% · Canada, China, Jamaica
- Languages at home
- 77% English-only · Spanish 11% Other Indo-European 4% French/Haitian/Cajun 3%
Political lean MEDSL · Palm Beach
- 2024 margin
- Toss-up / Even · D 50.0% · R 49.2%
- 2008→2024 swing
- -22.1pp toward R · 2008: 22.9pp · 2024: 0.8pp
- All cycles
- 2024: D+0.8 2020: D+12.8 2016: D+15.3 2012: D+17.0 2008: D+22.9
Not yet ingested
- Civics
- —
Market trends
- HPI YoY
- ▲ 0.20%
- Current HPI
- 268.1142
- Rent YoY
- —
- Metro
- —
- State GDP YoY
- ▲ 3.28%
- F500 in state
- 36
Industry mix (Fortune 500 HQ in FL)
| Industry | F500 HQs | Revenue |
|---|---|---|
| Industrial Technology | 2 | $29B |
|
||
| Insurance | 2 | $17B |
|
||
| Retail | 1 | $60B |
|
||
| Technology Distribution | 1 | $58B |
|
||
| Homebuilding | 1 | $35B |
|
||
| Technology Manufacturing | 1 | $35B |
|
||
Price history
+55.8% since first listed8 events — show timeline
- 2026-05-05 Pending — Beaches MLS
- 2026-04-24 Contingent — Beaches MLS
- 2026-04-12 Listed $335,000 Beaches MLS
- 2004-11-16 Sold (Public Records) $290,000 Public Records
- 2003-09-10 Sold (Public Records) $212,500 Public Records
- 2003-06-27 Sold (MLS) $212,500 Beaches MLS
- 2003-05-01 Listing Removed — Beaches MLS
- 2003-03-05 Listed $215,000 Beaches MLS
Property tax history
+5.2%/yrLatest (2025): $4,890 · -15.4% YoY. Source: county tax records.
Cash-flow waterfall
monthlySold comps — $/sqft
last 12 mo · ≤1 miLoading sold comps…