 Multi-family
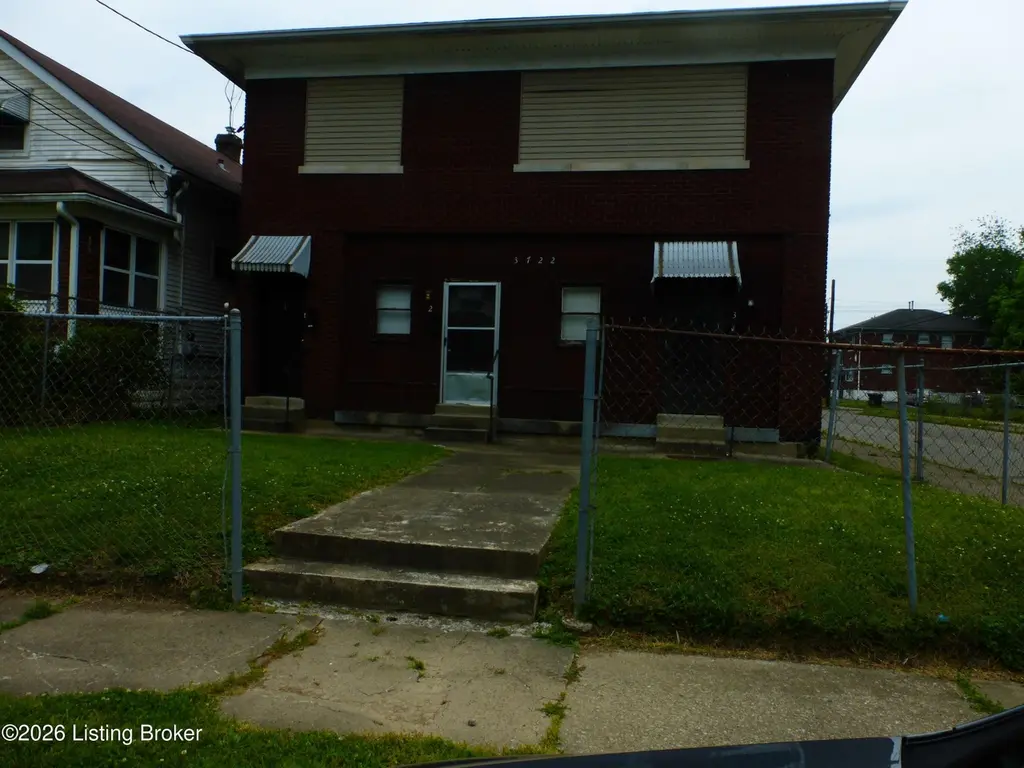
3722 Vermont Ave · Louisville, KY
Flood risk 8/10 · Major
- FEMA flood zone
- X (shaded)
- Chance of flooding over 30 yrs
- 0.99%
- Est. flood insurance / yr
- $473 – $860
Fire risk 1/10 · Minimal
- Est. fire insurance / yr
- $839 – $1,559
Heat risk 5/10 · Moderate
- Hot days now (above 104°F)
- 7 days/yr
- Hot days in 30 yrs
- 20 days/yr
Wind risk 2/10 · Minimal
- Chance of severe wind over 30 yrs
- 1.0%
Air-quality risk 2/10 · Minimal
- Unhealthy air days now
- 1 days/yr
- Unhealthy air days in 30 yrs
- 2 days/yr
Risk factors via First Street. Map © Google.
Why this score? — see what drove the C+ grade
The composite is a weighted blend of 9 inputs, each scored 0–100. Each bar is that input's sub-score; the figure is the points it added to the 100-point composite (weight × sub-score).
- Cash flow +30.0/30.0
- DSCR +10.0/10.0
- 1% rule +9.4/10.0
- Rent growth +3.7/5.0
- Livability +3.2/5.0
- Condition / age +2.5/5.0
- Schools +2.3/10.0
- ARV discount +0.0/15.0
- Appreciation +0.0/10.0
$225,000
🖨 Deal sheet 📄 Offer letter ✓ Due diligence
Multi-family units
County records classify this as Multi-Family (5+ Unit). Listing-text estimate: 1 unit. estimate disagrees with records
5+ unit building — per-unit beds/baths from public records are typically unavailable; the breakdown below (if shown) is an estimate from the listing text.
Listing remarks MLS
ABSOLUTE AUCTION EXTRAVAGANZA! Auction Date: Thursday January 21st. Time: 5:00pm Location: Cottonwood Suites, 4110 Dixie Highway. 15 Properties Selling to Highest Winning Bidder Regardless of Price. ***This property is currently fully rented*** UNIT ONE: Upstairs, 3 Beds, 1 Bath, $500/month and a $250 security deposit** UNIT TWO: Downstairs, 2 Beds, 1 Bath, $350/month and a $100 security deposit*** UNIT THREE: Downstairs, 2 beds, 1 bath, $300/month, $200 security deposit***Auction Conducted by Elizabeth Monarch & Lonnie Gann, Auctioneers with Auction Solutions For terms and conditions visit www.auctionsolutionsllc.com. All Realtors must register his and her client 48 hours prior to auction.
Key facts
- 5,637 sq ft lot
- Built 1928
- Listed 22 days
Property features AI
Finance
- Other: Building area reported as 2,880 total; Lot dimensions approximately 35.5 x 161 (0.13 acres)
- HOA & community: No association fee
Exterior
- Parking: No covered parking
- Utilities: Multiple furnaces (3); No central HVAC units reported; Other utilities (unspecified)
- Home design: Triplex; Built in 1928; Shingle roof; Concrete and brick construction
- Construction: Concrete and brick construction; Shingle roof; Year built 1928
- Exterior features: No notable exterior features listed; Sidewalks on the lot
Interior
- Kitchen: Kitchens in multiple units (2 on 1st level, 1 on 2nd level); Ranges/stoves in units (2 on 1st level, 1 on 2nd level); Refrigerators in units (2 on 1st level, 1 on 2nd level); No dishwashers listed
- Bedrooms: 7 total bedrooms (4 on 1st level, 3 on 2nd level)
- Bathrooms: 3 full bathrooms (2 on 1st level, 1 on 2nd level)
- Heating & cooling: Electric forced-air heating (3 furnaces); Wall/window air conditioning units
- Interior features: Separate meters for units; Basement with storage
- Laundry & utility: Laundry in multiple units (2 on 1st level, 1 on 2nd level)
Neighborhood map
What this means for you Summary
Snapshot
- This is a 7-bed/3.0-bath multifamily listed at $225k.
Deal economics
- At list price, monthly cash flow is $1k ($14k/yr) — positive.
- The deal already cash-flows at list — no discount required.
- Meets the 1% rule at list price ($3k rent vs $225k).
- Recommended offer: $222k (1.5% below list) — sets the bar for market timing.
- Cap rate 12.8% vs local median 5.0% in Louisville — top-decile yield for the area; either an underpriced asset or a hidden risk that comps aren't pricing in. Stress-test before assuming the spread holds.
Location & tenants
- Location reads 63/100 on livability (#333 in KY) — a middle-class / working-renter tenant base. Strengths: cost of living A+, housing A+; Watch: employment C-, health & safety D+, schools D-.
- Jefferson County (urban): math 19% / reading 35% proficiency, ranked #121 of 165 in KY (top 73%) — low school quality limits family demand, transient renter base, plan for 1-2y turnover.
- Market conditions: Rents rising fast (+4.9%/yr); 140 active listings in the ZIP; lower-income renter base — watch delinquency; 2,836 units permitted in Jefferson County in 2024 (1,558 in 5+ unit buildings).
- At $3,233/mo this rent would consume 122% of the median local household income ($32k/yr) (locally 1483% of renters already pay >50% of income on rent) — very limited rent-growth headroom before tenants either downsize or default.
Forward outlook
- Local home prices are declining (-3.0%/yr); year-one equity from $2k of loan paydown is wiped out by about $7k of value loss. Plan a longer hold.
- Jefferson County population projected at +13% by 2050 — modest demand growth; plan on rents tracking national, not racing it.
- At projected returns (-3.0% appreciation + 4.9% rent growth), your $63k cash investment doubles in ~6 years — after that, you're playing with house money.
Negotiation context
- It's been on market 22 days — a 2% lower offer ($222k) is reasonable based on typical stale-listing flexibility.
- 3 sale attempts since 10y ago with the ask held roughly flat each time — persistent listings suggest the price (not the market) is what's stuck; bring a comps-based counter.
- Current owner paid $20k; list at $225k implies a 1036% gain — meaningful room to come down on a strong offer.
Risks & watch-outs
- Watch-outs: flood insurance adds $56/mo; built in 1928 — expect roof / HVAC / electrical / plumbing capex.
- Climate carrying-cost: severe flood risk; extreme-heat days projected 7→20/yr by 2055 (HVAC capex compounding) — expect insurance premiums to compound above CPI over the hold.
Questions for the listing agent
- Built in 1928 — when were the roof, HVAC, electrical panel, plumbing, and water heater last replaced?
- What's the actual annual flood-insurance premium (NFIP or private), and is the property in a SFHA with mandatory coverage?
- Is there a deadline driving the sale (1031 exchange, divorce, estate, relocation)? That informs how much negotiation room exists.
- Schools are D-rated, which usually means shorter tenancies and higher turnover. Who's the typical renter profile here, and what's been the actual vacancy rate?
- Crime grade is F in this area — have there been break-ins, vandalism, or insurance claims at this property in the last 3 years? What carrier currently insures it and at what premium?
- What's the average days-on-market for RENTAL listings here right now (not sales)? A rising rental-DOM trend means longer vacancies and softer asking-rent achievability than the comps imply.
- What's the recent tenant-quality profile in this submarket — average credit score on applications, eviction rate, late-payment / NSF rate, and stable-employment percentage? A property-management company in the area should have these aggregated.
- How much new apartment / multifamily construction is in the pipeline within 1–3 miles? Heavy new supply (>2% of stock underway) typically softens rents 12–24 months out; light construction supports rent growth.
Investment metrics
- 1% rule
- 1.44% ✓
- Cap rate
- 12.79%
- Cash-on-cash
- 23.19%
- DSCR
- 2.03
- GRM
- 5.8
CMA / ARV
- ARV (on-the-fly)
- $181,440
- Comps found
- 1
Show comp detail 1 sale within ~0.75 mi
| Address | Dist | Beds/Ba | Sqft | Sold | Price | $/sf | Match |
|---|---|---|---|---|---|---|---|
| 715 S 41st St | 0.54mi | 6/2.0 (-1) | 3,072 (+7%) | 5mo | $194,000 | $63 | 51 |
Match score weights: distance 35% · size 25% · config 20% · recency 20%. Top-matched comps best support the ARV.
Projected returns pro-forma
-3.0% appreciation · 4.87% rent growth · sell at horizon
- IRR
- 16.8%
- Equity multiple
- 1.69×
- Total profit
- $43,684
- Equity at exit
- $33,548
- IRR
- 26.6%
- Equity multiple
- 3.53×
- Total profit
- $159,534
- Equity at exit
- $19,454
Cash invested: $63,000 (down + closing). Projections, not guarantees.
Landlord ↔ Tenant lean methodology
- Overall (STATE)
- 83 Strongly Landlord-Friendly
- State Kentucky
- 83 Strongly Landlord-Friendly · R+16
- County
- — inherits STATE
- City
- — inherits STATE
ZIP-level market 40211
- Home prices YoY
- -33.4%
- Rents YoY
- 4.9%
- Active inventory
- 140
- Price-to-rent
- 17.9×
Monthly cashflow live
- Estimated rent
- $3,233 high interval (Pro) →
- Mortgage (P&I)
- −$1,180
- Tax from tax record
- −$63 /mo · $756/yr
- Insurance
- −$94
- Flood insurance flood zone
- −$56 /mo · $666/yr
- HOA
- −$0
- Vacancy / Maint / Mgmt
- −$679
- Net cashflow
- $1,162
Break-even live
3-unit breakdown (identical units grouped — click to expand)
| Units | Beds | Baths | Est. rent |
|---|---|---|---|
| 2× units | 2 | 1 | $2,092 |
| #1 | 2 | 1 | $1,046 |
| #2 | 2 | 1 | $1,046 |
| 1× unit | 3 | 1 | $1,142 |
| Total (3 units) | $3,233 | ||
UW: 25.0% down · 7.5% · 30yr · 1.5% tax · 5.0% vac · 8.0% maint · 8.0% mgmt
Financing live
Cash to close
- Down payment
- $56,250
- Closing costs
- $6,750
- Reserves months
- —
- Total cash needed
- —
Loan-product check · same deal, 3 products live
Conventional
25% down · 7.5% · 30yr
- Down + closing
- —
- Monthly P&I
- —
- Monthly cashflow
- —
- DSCR
- —
- Eligible?
- —
Personal DTI + credit; lowest rate.
DSCR
20% down · 8.5% · 30yr
- Down + closing
- —
- Monthly P&I
- —
- Monthly cashflow
- —
- DSCR
- —
- Eligible?
- —
No personal income docs; deal must DSCR.
Hard money
10% down · 12.0% · 12mo
- Down + closing
- —
- Monthly P&I
- —
- Monthly cashflow
- —
- DSCR
- —
- Eligible?
- —
Short-term bridge; refi at stabilization.
Listing history 19 events
-
2026-06-18days on market $225,000 Active 22 DOM
-
2026-06-17days on market $225,000 Active 21 DOM
-
2026-06-16days on market $225,000 Active 20 DOM
-
2026-06-15days on market $225,000 Active 19 DOM
-
2026-06-13days on market $225,000 Active 17 DOM
-
2026-06-10days on market $225,000 Active 14 DOM
-
2026-06-09days on market $225,000 Active 13 DOM
-
2026-06-08days on market $225,000 Active 12 DOM
-
2026-06-07days on market $225,000 Active 11 DOM
-
2026-06-03days on market $225,000 Active 7 DOM
-
2026-06-02days on market $225,000 Active 6 DOM
-
2026-06-01days on market $225,000 Active 5 DOM
-
2026-05-31days on market $225,000 Active 4 DOM
-
2026-05-26$225,000 Active
-
2025-08-21historical
-
2025-05-21$225,000 Active
-
2016-02-10soldstatus $19,800 Closed 703-char remark
Show marketing remark (703 chars)
ABSOLUTE AUCTION EXTRAVAGANZA! Auction Date: Thursday January 21st. Time: 5:00pm Location: Cottonwood Suites, 4110 Dixie Highway. 15 Properties Selling to Highest Winning Bidder Regardless of Price. ***This property is currently fully rented*** UNIT ONE: Upstairs, 3 Beds, 1 Bath, $500/month and a $250 security deposit** UNIT TWO: Downstairs, 2 Beds, 1 Bath, $350/month and a $100 security deposit*** UNIT THREE: Downstairs, 2 beds, 1 bath, $300/month, $200 security deposit***Auction Conducted by Elizabeth Monarch & Lonnie Gann, Auctioneers with Auction Solutions For terms and conditions visit www.auctionsolutionsllc.com. All Realtors must register his and her client 48 hours prior to auction.
-
2016-01-26status Pending 703-char remark
Show marketing remark (703 chars)
ABSOLUTE AUCTION EXTRAVAGANZA! Auction Date: Thursday January 21st. Time: 5:00pm Location: Cottonwood Suites, 4110 Dixie Highway. 15 Properties Selling to Highest Winning Bidder Regardless of Price. ***This property is currently fully rented*** UNIT ONE: Upstairs, 3 Beds, 1 Bath, $500/month and a $250 security deposit** UNIT TWO: Downstairs, 2 Beds, 1 Bath, $350/month and a $100 security deposit*** UNIT THREE: Downstairs, 2 beds, 1 bath, $300/month, $200 security deposit***Auction Conducted by Elizabeth Monarch & Lonnie Gann, Auctioneers with Auction Solutions For terms and conditions visit www.auctionsolutionsllc.com. All Realtors must register his and her client 48 hours prior to auction.
-
2016-01-06$1 Active 703-char remark
Show marketing remark (703 chars)
ABSOLUTE AUCTION EXTRAVAGANZA! Auction Date: Thursday January 21st. Time: 5:00pm Location: Cottonwood Suites, 4110 Dixie Highway. 15 Properties Selling to Highest Winning Bidder Regardless of Price. ***This property is currently fully rented*** UNIT ONE: Upstairs, 3 Beds, 1 Bath, $500/month and a $250 security deposit** UNIT TWO: Downstairs, 2 Beds, 1 Bath, $350/month and a $100 security deposit*** UNIT THREE: Downstairs, 2 beds, 1 bath, $300/month, $200 security deposit***Auction Conducted by Elizabeth Monarch & Lonnie Gann, Auctioneers with Auction Solutions For terms and conditions visit www.auctionsolutionsllc.com. All Realtors must register his and her client 48 hours prior to auction.
ⓘ Source: listings_history table (triggers on properties + properties_extension) + one-shot
backfill from property_details.listing_events for pre-trigger history.
Tax reassessment forecast KY · Resets to sale price
- Current annual tax
- $756 · $63/mo
- Projected year-2 tax
- $1,935 · $161/mo
- Expected delta
- +$1,179/yr (+$98/mo · 156.0%)
ⓘ Screening estimate from a state-policy table — verify with the county assessor before closing.
Climate risk First Street
- Flood 8/10 Severe FEMA zone X (shaded) · 99% chance over 30 yrs
- Wildfire 1/10 Low
- Heat 5/10 Major 7 d/yr ≥104°F today · 20 d/yr by 30 yrs out
- Wind 2/10 Low 100% chance of damaging wind over 30 yrs
- Air quality 2/10 Low 1 unhealthy d/yr today · 2 by 30 yrs out
Nearby sold comps map
Loading sold comps map…
Walkable amenities ~0.75 mi
Loading nearby amenities…
Taxation est. · year 1
- Rental income
- $38,796
- − Mortgage interest
- −$12,603
- − Property taxes
- −$756
- − Insurance
- −$1,792
- − Repairs & maintenance
- −$3,104
- − Management
- −$3,104
- − Depreciation
- −$6,545
- Taxable income
- $10,892
- Est. tax owed @ 24.0%
- −$2,614
- After-tax cash flow
- $11,328/yr
For passive investors: Depreciation is non-cash, so a rental often shows a tax loss while cash-flowing — sheltering income. Rental losses are passive: they offset passive income freely, and up to $25,000/yr can offset ordinary (W-2) income if you actively participate and your MAGI is under $100k (phasing out to $0 by $150k); unused losses carry forward. On sale, claimed depreciation is recaptured at up to 25%, and gains may owe capital-gains tax (a 1031 exchange can defer both). Figures are a year-1 estimate at your 24.0% rate — not tax advice; consult a CPA.
Schools (NCES district)
- District
- Jefferson County
- NCES district ID
- 2102990
- Math proficiency
- 19% ▼ -17.00%
- Reading proficiency
- 35% ▼ -11.00%
- Median HH income
- $47,885
- Composite
- 23.45/100
- National rank
- #7884
- State rank
- #121 of 165 in KY
Livability — Louisville
- Score
- 63/100
- State rank
- #333
- US rank
- #15887
Category grades
Schools grade is shown separately in the Schools card above.
Census & demographics
- Census place
- Louisville, KY
- County
- Jefferson County · 790,184 people
- City population
- 769,292
- Metro
- Louisville/Jefferson County, KY-IN
- Population (ZIP)
- 20,407
- Household income
- $31,749
- Rent vs Own
- Severe rent burden
- 1483.0
Population outlook (Jefferson County) Hauer SSP2
- Today (2025)
- 823,112 people
- By 2030
- 849,343 · +3.2%
- By 2040
- 895,696 · +8.8%
- By 2050
- 933,630 · +13.4%
- By 2075
- 1,028,262 · +24.9%
- By 2100
- 1,072,675 · +30.3%
Race, ethnicity, and origin ACS 2023
- Neighborhood character
- Predominantly Black (90%)
- Race & ethnicity
- Black 90% White 5% Two or more races 4% Hispanic / Latino 1%
- Common ancestry
- Italian 1%
- Foreign-born
- 1% · Canada
- Languages at home
- 98% English-only · Spanish 1%
Political lean MEDSL · Jefferson
- 2024 margin
- D (+16.6) · D 57.4% · R 40.9% · Other 1.7%
- 2008→2024 swing
- +4.5pp toward D · 2008: 12.0pp · 2024: 16.6pp
- All cycles
- 2024: D+16.6 2020: D+20.1 2016: D+13.3 2012: D+11.1 2008: D+12.0
Not yet ingested
- Civics
- —
Market trends
- HPI YoY
- ▼ -88.22%
- Current HPI
- 176.337
- Rent YoY
- ▲ 4.87%
- Metro
- Louisville/Jefferson County, KY-IN
- State GDP YoY
- ▲ 1.81%
- F500 in state
- 4
Industry mix (Fortune 500 HQ in KY)
| Industry | F500 HQs | Revenue |
|---|---|---|
| Healthcare | 1 | $118B |
|
||
| Food / Beverage | 1 | $7B |
|
||
Price history
+1036.4% since first listed6 events — show timeline
- 2026-05-26 Listed $225,000 Metro Search MLS
- 2025-08-21 Listing Removed — Metro Search MLS
- 2025-05-21 Listed $225,000 Metro Search MLS
- 2016-02-10 Sold (MLS) $19,800 Metro Search MLS
- 2016-01-26 Pending — Metro Search MLS
- 2016-01-06 Listed $1 Metro Search MLS
Property tax history
+0.1%/yrLatest (2025): $756 · -1.9% YoY. Source: county tax records.
Cash-flow waterfall
monthlySold comps — $/sqft
last 12 mo · ≤1 miLoading sold comps…