515 Harmon St · Corpus Christi, TX
Flood risk 5/10 · Moderate
- FEMA flood zone
- X (unshaded)
- Chance of flooding over 30 yrs
- 0.65%
- Est. flood insurance / yr
- $507 – $1,088
Fire risk 1/10 · Minimal
- Est. fire insurance / yr
- $1,222 – $2,270
Heat risk 10/10 · Severe
- Hot days now (above 107°F)
- 7 days/yr
- Hot days in 30 yrs
- 24 days/yr
Wind risk 9/10 · Severe
- Chance of severe wind over 30 yrs
- 99.0%
Air-quality risk 1/10 · Minimal
- Unhealthy air days now
- 0 days/yr
- Unhealthy air days in 30 yrs
- 0 days/yr
Risk factors via First Street. Map © Google.
Why this score? — see what drove the D grade
The composite is a weighted blend of 9 inputs, each scored 0–100. Each bar is that input's sub-score; the figure is the points it added to the 100-point composite (weight × sub-score).
- Cash flow +12.7/30.0
- Appreciation +5.7/10.0
- ARV discount +4.6/15.0
- 1% rule +4.0/10.0
- Livability +3.9/5.0
- DSCR +3.8/10.0
- Schools +2.8/10.0
- Rent growth +2.5/5.0
- Condition / age +2.5/5.0
$143,900
🖨 Deal sheet (PDF) 📄 Offer letter ✓ Due diligence
Listing remarks MLS
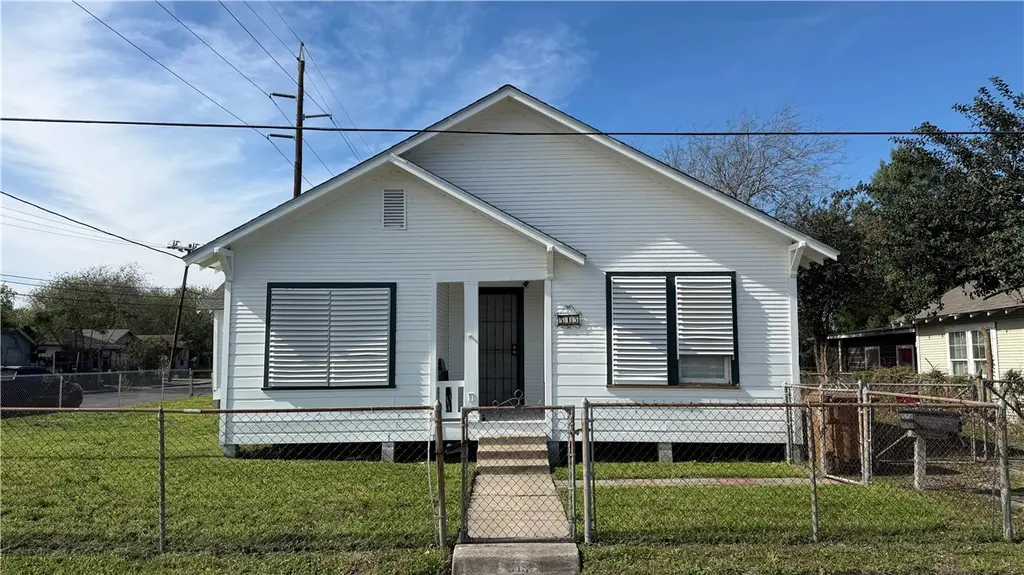
A lovely 1,450 sqft 1960’s Craftsman Home for sale on a huge 10,500 sqft corner lot. The home has 3 bedrooms, 2 newly remodeled bathrooms and floors, large kitchen with a breakfast area, open dinning/den area and living room. The property has two vehicle driveway entrances that lead to a large covered car port area and a storage accessory building. Huge yard area is perfect for playtime and sunbathing or for additional structures to be built for more revenue. Property is large enough for potential duplex with no zoning incumbrance. The home’s layout is also ideal for a small real estate, attorney, dentist, home occupation office or a non-profit providing services to the community due to its close proximity and visibility to Port Ave. The property is 10 minutes from downtown , City Hall and the SEA District.
Key facts
- Large kitchen
- Corner lot
- Breakfast area
Tags
Neighborhood map
What this means for you Summary
Snapshot
- This is a 3-bed/2.0-bath single-family listed at $144k.
Deal economics
- At list price, monthly cash flow is $-16 ($-192/yr) — negative.
- To cash-flow at today's rent, offer at most $141k (2.0% below list).
- To meet the 1% rule (rent ≥ 1% of price), the offer needs to be $130k (9.8% below list).
- Recommended offer: $130k (9.8% below list) — sets the bar for 1% rule.
- Cap rate 6.2% vs local median 3.6% in Corpus Christi — top-decile yield for the area; either an underpriced asset or a hidden risk that comps aren't pricing in. Stress-test before assuming the spread holds.
Location & tenants
- Location reads 78/100 on livability (#66 in TX, #2,404 nationally) — a middle-class / working-renter tenant base. Strengths: commute A+, cost of living A+, housing A+; Watch: crime F.
- Corpus Christi ISD (urban): math 31% / reading 35% proficiency, ranked #562 of 826 in TX (top 68%) — families likely to look elsewhere, expect single-tenant / working-renter base with shorter leases; 63% free/reduced lunch — lower-income household profile, screen leases tightly.
- Zoned schools: Windsor Park G/T (math 85% / reading 90%, grade A+, #6 of 4,322 statewide, top 0%, 609 students, 29% FRL); Adkins Middle (math 40% / reading 39%, grade F, #660 of 1,662 statewide, top 41%, 956 students, 48% FRL); Roy Miller H S And Metro School of Design (math 24% / reading 32%, grade F, #1,170 of 1,632 statewide, top 72%, 1,538 students, 88% FRL).
- Zoned-school proficiency averages 52% at this address vs 33% district-wide (+19 pts) — the actual schools serving this property are materially stronger than the Corpus Christi ISD average implies; a family-tenant draw the district grade alone would hide.
- Market conditions: 77 active listings in the ZIP; 16 comparable units currently listed for rent nearby; rentals at typical pace (median 23d on market — plan ~3-4 weeks tenant-placement turnaround); 44% of comp listings sitting > 30 days — soft ceiling on asking rent; lower-income renter base — watch delinquency; 1,397 units permitted in Nueces County in 2024 (47 in 5+ unit buildings).
- This rent runs 41% of the median local income ($38k/yr) — at the standard rent-burdened threshold; future hikes will face affordability resistance.
Forward outlook
- In year one you build about $3k of equity ($995 loan paydown + $2k appreciation (1.4% local appreciation)).
- Nueces County population projected at +36% by 2050 — long-run rental-demand tailwind backs the buy-and-hold thesis.
- At projected returns (1.4% appreciation + 3.0% rent growth), your $40k cash investment doubles in ~9 years — after that, you're playing with house money.
- By year 10, paydown + projected appreciation supports a ~$31k cash-out refi (75% LTV) — recoverable capital for the next deal without selling this one.
Negotiation context
- It's been on market 82 days — a 6% lower offer ($135k) is reasonable based on typical stale-listing flexibility.
Risks & watch-outs
- Climate carrying-cost: moderate flood risk; severe wind risk, 99% chance of damaging wind over 30y; extreme-heat days projected 7→24/yr by 2055 (HVAC capex compounding) — expect insurance premiums to compound above CPI over the hold.
Questions for the listing agent
- What do current leases actually rent for vs. the listed asking? Can we see a recent rent roll and the last 12 months of T-12 income?
- It's been on market 82 days. Have you received any prior offers? Is the seller open to a 10% concession, seller financing, or rate buy-down credit?
- Built in 1960 — when were the roof, HVAC, electrical panel, plumbing, and water heater last replaced?
- Why hasn't it sold? Are there any deal-killer items the seller is aware of (foundation, flood, title, zoning, code violations)?
- Is there a deadline driving the sale (1031 exchange, divorce, estate, relocation)? That informs how much negotiation room exists.
- Crime grade is F in this area — have there been break-ins, vandalism, or insurance claims at this property in the last 3 years? What carrier currently insures it and at what premium?
- The area grade is low — what's the realistic commute time and amenity access for the typical tenant pool here? Any planned neighborhood developments (good or bad) we should know about?
- What's the average days-on-market for RENTAL listings here right now (not sales)? A rising rental-DOM trend means longer vacancies and softer asking-rent achievability than the comps imply.
- What's the recent tenant-quality profile in this submarket — average credit score on applications, eviction rate, late-payment / NSF rate, and stable-employment percentage? A property-management company in the area should have these aggregated.
- How much new for-sale + rental construction is in the pipeline within 1–3 miles? Heavy new supply typically softens prices + rents 12–24 months out; constrained supply supports both.
Investment metrics
- 1% rule
- 0.90% ✗
- Cap rate
- 6.16%
- Cash-on-cash
- -0.48%
- DSCR
- 0.98
- GRM
- 9.2
CMA / ARV
- ARV (median comp)
- $135,250
- List price
- $143,900
- Delta
- 6.40%
- Verdict
- FAIR
- Comps
- 20 within 1.0 mi
Show comp detail 12 sales within ~0.75 mi
| Address | Dist | Beds/Ba | Sqft | Sold | Price | $/sf | Match |
|---|---|---|---|---|---|---|---|
| 1216 Espinoza St | 0.51mi | 3/2.0 | 1,500 (+3%) | 1mo | $115,000 | $77 | 70 |
| 318 Cheyenne St | 0.56mi | 3/2.0 | 1,368 (-6%) | 2mo | $215,000 | $157 | 62 |
| 717 25th St | 0.17mi | 3/1.0 | 1,307 (-10%) | 12mo | $42,500 | $33 | 61 |
| 2832 Highland Ave | 0.21mi | 3/2.0 | 1,263 (-13%) | 9mo | $199,900 | $158 | 61 |
| 528 S 19th St | 0.49mi | 3/2.0 | 1,288 (-12%) | 3mo | $199,000 | $155 | 56 |
| 532 S 19th St | 0.50mi | 3/2.0 | 1,288 (-12%) | 4mo | $199,000 | $155 | 55 |
| 2201 Morris St | 0.49mi | 4/2.0 (+1) | 1,352 (-7%) | 8mo | $215,000 | $159 | 54 |
| 2206 Coleman Ave | 0.48mi | 4/2.0 (+1) | 1,352 (-7%) | 8mo | $215,000 | $159 | 54 |
| 2202 Coleman Ave | 0.49mi | 4/2.0 (+1) | 1,352 (-7%) | 10mo | $215,000 | $159 | 52 |
| 3410 Kenwood Dr | 0.58mi | 4/1.0 (+1) | 1,368 (-6%) | 9mo | $149,900 | $110 | 46 |
| 2201 Comanche St | 0.67mi | 3/1.0 | 1,340 (-8%) | 8mo | $44,000 | $33 | 45 |
| 310 W Longview St | 0.65mi | 3/1.0 | 1,248 (-14%) | 14mo | $175,000 | $140 | 30 |
Match score weights: distance 35% · size 25% · config 20% · recency 20%. Top-matched comps best support the ARV.
Projected returns pro-forma
1.42% appreciation · 3.0% rent growth · sell at horizon
- IRR
- 2.2%
- Equity multiple
- 1.12×
- Total profit
- $4,704
- Equity at exit
- $52,301
- IRR
- 6.6%
- Equity multiple
- 1.84×
- Total profit
- $33,742
- Equity at exit
- $72,028
Cash invested: $40,292 (down + closing). Projections, not guarantees.
Landlord ↔ Tenant lean methodology
- Overall (STATE)
- 87 Strongly Landlord-Friendly
- State Texas
- 87 Strongly Landlord-Friendly · R+5
- County
- — inherits STATE
- City
- — inherits STATE
ZIP-level market 78405
- Home prices YoY
- 1.3%
- Active inventory
- 77
- Price-to-rent
- 9.2×
Monthly cashflow live
- Estimated rent
- $1,297 high interval (Pro) →
- Mortgage (P&I)
- −$755
- Tax from tax record
- −$226 /mo · $2,717/yr
- Insurance
- −$60
- HOA
- −$0
- Vacancy / Maint / Mgmt
- −$272
- Net cashflow
- $-16
Break-even live
Sensitivity live
| Price | -10% $65 | -5% $25 | +0% $-16 | +5% $-57 | +10% $-97 |
|---|---|---|---|---|---|
| Rent | -10% $-119 | -5% $-67 | +0% $-16 | +5% $35 | +10% $86 |
| Rate | -1.0pp $56 | -0.5pp $21 | base $-16 | +0.5pp $-53 | +1.0pp $-91 |
UW: 25.0% down · 7.5% · 30yr · 1.5% tax · 5.0% vac · 8.0% maint · 8.0% mgmt
Financing live
Cash to close
- Down payment
- $35,975
- Closing costs
- $4,317
- Reserves months
- —
- Total cash needed
- —
Loan-product check · same deal, 3 products live
Conventional
25% down · 7.5% · 30yr
- Down + closing
- —
- Monthly P&I
- —
- Monthly cashflow
- —
- DSCR
- —
- Eligible?
- —
Personal DTI + credit; lowest rate.
DSCR
20% down · 8.5% · 30yr
- Down + closing
- —
- Monthly P&I
- —
- Monthly cashflow
- —
- DSCR
- —
- Eligible?
- —
No personal income docs; deal must DSCR.
Hard money
10% down · 12.0% · 12mo
- Down + closing
- —
- Monthly P&I
- —
- Monthly cashflow
- —
- DSCR
- —
- Eligible?
- —
Short-term bridge; refi at stabilization.
Rent comps 16 comps
| Address | Beds | Baths | Sqft | Rent | $/sqft | DOM | Units | Dist |
|---|---|---|---|---|---|---|---|---|
| 2245 Comanche St Unit A Corpus Christi, TX | 3.0 | 1.0 | 1016 | $1,350 | $1.33 | 23d | 1 | 0.63mi |
| 2402 Segrest St Corpus Christi, TX | 2.0 | 1.0 | 1120 | $825 | $0.74 | 23d | 1 | 0.65mi |
| 616 16th St Unit A Corpus Christi, TX | 3.0 | 1.0 | 1040 | $1,050 | $1.01 | 45d | 1 | 0.67mi |
| 2522 Cleo St Corpus Christi, TX | 3.0 | 1.0 | 992 | $1,350 | $1.36 | 15d | 1 | 0.78mi |
| 1107 14th St Corpus Christi, TX | 4.0 | 1.5 | 1520 | $1,300 | $0.86 | 45d | 1 | 0.83mi |
| 110 Josephine St Corpus Christi, TX | 3.0 | 2.0 | 1050 | $2,000 | $1.90 | 45d | 1 | 1.03mi |
| 801 S Alameda St Unit A Corpus Christi, TX | 2.0 | 1.0 | 1760 | $900 | $0.51 | 45d | 1 | 1.08mi |
| 1525 S 19th St Unit B Corpus Christi, TX | 3.0 | 2.0 | 1062 | $2,100 | $1.98 | 15d | 1 | 1.08mi |
| 2622 Cloyde St Corpus Christi, TX | 2.0 | 1.0 | 1693 | $1,150 | $0.68 | 45d | 1 | 1.16mi |
| 3762 Up River Rd Corpus Christi, TX | 1.0–2.0 | 1.0–2.0 | 855 | $1,199 | $1.40 | 15d | 6 | 1.24mi |
| 1628 18th St Corpus Christi, TX | 2.0 | 1.0 | 1112 | $1,000 | $0.90 | 45d | 1 | 1.24mi |
| 826 Hancock Ave Unit 2 Corpus Christi, TX | 2.0 | 1.0 | 1000 | $950 | $0.95 | 23d | 1 | 1.30mi |
| 813 Furman Ave Apt 1 Corpus Christi, TX | 3.0 | 2.0 | 1430 | $1,475 | $1.03 | 15d | 1 | 1.34mi |
| 1722 Trenton Dr Corpus Christi, TX | 4.0 | 2.0 | 1432 | $2,100 | $1.47 | 15d | 1 | 1.34mi |
| 1634 14th St Corpus Christi, TX | 2.0 | 1.5 | 980 | $1,090 | $1.11 | 45d | 1 | 1.35mi |
| 1318 6th St Corpus Christi, TX | 2.0 | 1.0 | 900 | $900 | $1.00 | 15d | 1 | 1.41mi |
Listing history 18 events
-
2026-06-21days on market $143,900 Active 82 DOM
-
2026-06-18days on market $143,900 Active 79 DOM
-
2026-06-17days on market $143,900 Active 78 DOM
-
2026-06-16days on market $143,900 Active 77 DOM
-
2026-06-15days on market $143,900 Active 76 DOM
-
2026-06-14days on market $143,900 Active 74 DOM
-
2026-06-10days on market $143,900 Active 71 DOM
-
2026-06-09days on market $143,900 Active 70 DOM
-
2026-06-08days on market $143,900 Active 69 DOM
-
2026-06-07days on market $143,900 Active 68 DOM
-
2026-06-05days on market $143,900 Active 65 DOM
-
2026-06-03days on market $143,900 Active 64 DOM
-
2026-06-02days on market $143,900 Active 63 DOM
-
2026-06-01days on market $143,900 Active 62 DOM
-
2026-05-31days on market $143,900 Active 61 DOM
-
2026-05-30days on market $143,900 Active 60 DOM
-
2026-03-31$143,900 Active 867-char remark
Show marketing remark (867 chars)
A lovely 1,450 sqft 1960’s Craftsman Home for sale on a huge 10,500 sqft corner lot. The home has 3 bedrooms, 2 newly remodeled bathrooms and floors, large kitchen with a breakfast area, open dinning/den area and living room. The property has two vehicle driveway entrances that lead to a large covered car port area and a storage accessory building. Huge yard area is perfect for playtime and sunbathing or for additional structures to be built for more revenue. Property is large enough for potential duplex with no zoning incumbrance. The home’s layout is also ideal for a small real estate, attorney, dentist, home occupation office or a non-profit providing services to the community due to its close proximity and visibility to Port Ave. The property is 10 minutes from downtown , City Hall and the SEA District.
-
2001-12-18soldstatus
ⓘ Source: listings_history table (triggers on properties + properties_extension) + one-shot
backfill from property_details.listing_events for pre-trigger history.
Tax reassessment forecast TX · Resets to sale price
- Current annual tax
- $2,717 · $226/mo
- Projected year-2 tax
- $2,717 · $226/mo
- Expected delta
- $0/yr ($0/mo · 0.0%)
ⓘ Screening estimate from a state-policy table — verify with the county assessor before closing.
Climate risk First Street
- Flood 5/10 Major FEMA zone X (unshaded) · 65% chance over 30 yrs
- Wildfire 1/10 Low
- Heat 10/10 Extreme 7 d/yr ≥107°F today · 24 d/yr by 30 yrs out
- Wind 9/10 Extreme 99% chance of damaging wind over 30 yrs
- Air quality 1/10 Low 0 unhealthy d/yr today · 0 by 30 yrs out
Nearby sold comps map
Loading sold comps map…
Walkable amenities ~0.75 mi
Loading nearby amenities…
Taxation est. · year 1
- Rental income
- $15,570
- − Mortgage interest
- −$8,061
- − Property taxes
- −$2,717
- − Insurance
- −$720
- − Repairs & maintenance
- −$1,246
- − Management
- −$1,246
- − Depreciation
- −$4,186
- Taxable loss
- −$2,605
- Est. tax savings @ 24.0%
- +$625
- After-tax cash flow
- $433/yr
For passive investors: Depreciation is non-cash, so a rental often shows a tax loss while cash-flowing — sheltering income. Rental losses are passive: they offset passive income freely, and up to $25,000/yr can offset ordinary (W-2) income if you actively participate and your MAGI is under $100k (phasing out to $0 by $150k); unused losses carry forward. On sale, claimed depreciation is recaptured at up to 25%, and gains may owe capital-gains tax (a 1031 exchange can defer both). Figures are a year-1 estimate at your 24.0% rate — not tax advice; consult a CPA.
Schools (NCES district)
- District
- Corpus Christi ISD
- NCES district ID
- 4815270
- Math proficiency
- 31% ▼ -18.00%
- Reading proficiency
- 35% ▼ -7.00%
- Median HH income
- $45,672
- Composite
- 28.27/100
- National rank
- #6793
- State rank
- #562 of 826 in TX
Livability — Corpus Christi
- Score
- 78/100
- State rank
- #66
- US rank
- #2404
Category grades
Schools grade is shown separately in the Schools card above.
Census & demographics
- Census place
- Corpus Christi, TX
- County
- Nueces County · 296,836 people
- City population
- 296,836
- Metro
- Corpus Christi, TX
- Population (ZIP)
- 14,602
- Household income
- $38,294
- Rent vs Own
- Severe rent burden
- 867.0
Population outlook (Nueces County) Hauer SSP2
- Today (2025)
- 418,037 people
- By 2030
- 447,123 · +7.0%
- By 2040
- 505,911 · +21.0%
- By 2050
- 567,522 · +35.8%
- By 2075
- 729,686 · +74.6%
- By 2100
- 847,087 · +102.6%
Race, ethnicity, and origin ACS 2023
- Neighborhood character
- Predominantly Hispanic (91%)
- Race & ethnicity
- Hispanic / Latino 91% Two or more races 48% Black 4% White 4%
- Hispanic origin (detail)
- Mexican 83%
- Foreign-born
- 18% · Canada
- Languages at home
- 52% English-only · Spanish 48%
Political lean MEDSL · Nueces
- 2024 margin
- R (+11.5) · D 43.8% · R 55.3%
- 2008→2024 swing
- -7.1pp toward R · 2008: -4.4pp · 2024: -11.5pp
- All cycles
- 2024: R+11.5 2020: R+2.9 2016: R+1.5 2012: R+3.2 2008: R+4.4
Not yet ingested
- Civics
- —
Market trends
- HPI YoY
- ▲ 1.42%
- Current HPI
- 113.2227
- Rent YoY
- —
- Metro
- Corpus Christi, TX
- State GDP YoY
- ▲ 3.95%
- F500 in state
- 110
Industry mix (Fortune 500 HQ in TX)
| Industry | F500 HQs | Revenue |
|---|---|---|
| Energy | 16 | $1,198B |
|
||
| Technology | 5 | $198B |
|
||
| Engineering / Construction | 4 | $72B |
|
||
| Energy Services | 3 | $60B |
|
||
| Utilities | 3 | $41B |
|
||
| Healthcare | 2 | $330B |
|
||
Price history
2 events — show timeline
- 2026-03-31 Listed $143,900 CBMLS
- 2001-12-18 Sold (Public Records) — Public Records
Property tax history
+6.7%/yrLatest (2025): $2,717 · +12.0% YoY. Source: county tax records.
Cash-flow waterfall
monthlySold comps — $/sqft
last 12 mo · ≤1 miLoading sold comps…