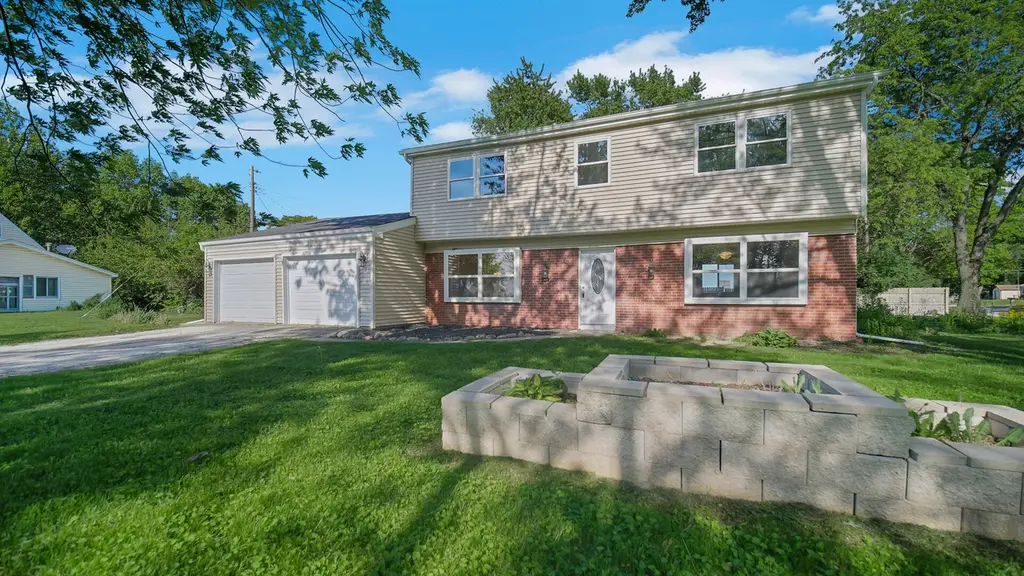
731 Mccool Rd · South Haven, IN
Flood risk 1/10 · Minimal
- FEMA flood zone
- X (unshaded)
- Chance of flooding over 30 yrs
- 0.0%
- Est. flood insurance / yr
- $507 – $1,088
Fire risk 1/10 · Minimal
- Est. fire insurance / yr
- $717 – $1,331
Heat risk 2/10 · Minimal
- Hot days now (above 102°F)
- 7 days/yr
- Hot days in 30 yrs
- 15 days/yr
Wind risk 2/10 · Minimal
- Chance of severe wind over 30 yrs
- 0.0%
Air-quality risk 2/10 · Minimal
- Unhealthy air days now
- 1 days/yr
- Unhealthy air days in 30 yrs
- 2 days/yr
Risk factors via First Street. Map © Google.
Why this score? — see what drove the F grade
The composite is a weighted blend of 9 inputs, each scored 0–100. Each bar is that input's sub-score; the figure is the points it added to the 100-point composite (weight × sub-score).
- Cash flow +11.5/30.0
- Livability +3.6/5.0
- DSCR +3.4/10.0
- Schools +2.7/10.0
- Rent growth +2.5/5.0
- Condition / age +2.5/5.0
- 1% rule +2.2/10.0
- ARV discount +0.0/15.0
- Appreciation +0.0/10.0
$285,000
🖨 Deal sheet 📄 Offer letter ✓ Due diligence
Listing remarks
Completely remodeled 4-bedroom, 2-story home with a bonus room situated on a spacious oversized lot of more than 1/3 acre. This move-in ready home offers a flexible floor plan with two separate living areas, providing plenty of space for entertaining, working from home, or everyday living. The stunning kitchen has been fully updated with new cabinetry, quartz countertops, and modern finishes. Recent renovations throughout the home include new interior doors, trim, paint, flooring, light fixtures, and more, creating a fresh, modern feel from top to bottom. Major mechanical and structural updates provide peace of mind, including a brand-new furnace, central air conditioner, water heater, and
Key facts
- Flexible floor plan
- Bonus room
- New cabinetry
Tags
Property features AI
Exterior
- Parking: 2-car garage
- Utilities: Public water; Public sewer
- Home design: Two-story property; Built in 1963
- Exterior features: Neighborhood view; Crawl space basement
Interior
- Kitchen: Dishwasher; Microwave
- Bedrooms: Primary bedroom; Bedroom 2; Bedroom 3; Bedroom 4
- Flooring: Vinyl flooring
- Bathrooms: 2 full bathrooms; 1 half bathroom
- Heating & cooling: Central air conditioning; Forced air heating
- Interior features: Stone counters; Bonus room; Living room; Dining room; Den
Neighborhood map
What this means for you Summary
Snapshot
- This is a 4-bed/2.5-bath single-family listed at $285k.
Deal economics
- At list price, monthly cash flow is $-96 ($-1k/yr) — negative.
- To cash-flow at today's rent, offer at most $268k (5.9% below list).
- To meet the 1% rule (rent ≥ 1% of price), the offer needs to be $204k (28.5% below list).
- Recommended offer: $204k (28.5% below list) — sets the bar for 1% rule.
Location & tenants
- Location reads 72/100 on livability (#119 in IN) — a middle-class / working-renter tenant base. Strengths: cost of living A+, housing A+, health & safety A; Watch: amenities F, commute F.
- Portage Township Schools (suburban): math 26% / reading 36% proficiency, ranked #221 of 301 in IN (top 73%) — families likely to look elsewhere, expect single-tenant / working-renter base with shorter leases.
- Market conditions: 375 active listings in the ZIP; 1 comparable units currently listed for rent nearby; solid renter incomes; 542 units permitted in Porter County in 2024 (0 in 5+ unit buildings).
Forward outlook
- Local home prices are declining (-3.0%/yr); year-one equity from $2k of loan paydown is wiped out by about $9k of value loss. Plan a longer hold.
- Porter County population projected at +6% by 2050 — modest demand growth; plan on rents tracking national, not racing it.
Negotiation context
- Only 4 days on market — expect competitive offers; lowballing is unlikely to land.
- 3 sale attempts since 22y ago with the ask held roughly flat each time — persistent listings suggest the price (not the market) is what's stuck; bring a comps-based counter.
Questions for the listing agent
- What do current leases actually rent for vs. the listed asking? Can we see a recent rent roll and the last 12 months of T-12 income?
- Built in 1963 — when were the roof, HVAC, electrical panel, plumbing, and water heater last replaced?
- Is there a deadline driving the sale (1031 exchange, divorce, estate, relocation)? That informs how much negotiation room exists.
- The area grade is low — what's the realistic commute time and amenity access for the typical tenant pool here? Any planned neighborhood developments (good or bad) we should know about?
- What's the average days-on-market for RENTAL listings here right now (not sales)? A rising rental-DOM trend means longer vacancies and softer asking-rent achievability than the comps imply.
- What's the recent tenant-quality profile in this submarket — average credit score on applications, eviction rate, late-payment / NSF rate, and stable-employment percentage? A property-management company in the area should have these aggregated.
- How much new for-sale + rental construction is in the pipeline within 1–3 miles? Heavy new supply typically softens prices + rents 12–24 months out; constrained supply supports both.
Investment metrics
- 1% rule
- 0.72% ✗
- Cap rate
- 5.89%
- Cash-on-cash
- -1.44%
- DSCR
- 0.94
- GRM
- 11.7
CMA / ARV
- ARV (on-the-fly)
- $232,200
- Comps found
- 12
Show comp detail 12 sales within ~0.75 mi
| Address | Dist | Beds/Ba | Sqft | Sold | Price | $/sf | Match |
|---|---|---|---|---|---|---|---|
| 392 Stonehill Dr | 0.16mi | 4/2.0 | 1,872 (+4%) | 4mo | $225,000 | $120 | 81 |
| 717 Mccool Rd | 0.18mi | 4/2.5 | 1,690 (-6%) | 8mo | $259,000 | $153 | 75 |
| 382 Pinewood Dr | 0.26mi | 4/2.0 | 1,912 (+6%) | 1mo | $285,000 | $149 | 75 |
| 734 1 Juniper Rd | 0.34mi | 4/2.0 | 1,920 (+7%) | 3mo | $210,000 | $109 | 69 |
| 373 W Millport Dr | 0.26mi | 3/1.5 (-1) | 1,664 (-8%) | 2mo | $215,000 | $129 | 65 |
| 723 Fox River Rd | 0.62mi | 4/2.0 | 1,872 (+4%) | 2mo | $251,000 | $134 | 61 |
| 753 Imperial Rd | 0.49mi | 4/2.0 | 1,920 (+7%) | 5mo | $226,000 | $118 | 60 |
| 695 Cross Meadows Dr | 0.40mi | 4/3.0 | 2,000 (+11%) | 2mo | $360,000 | $180 | 59 |
| 388 Sycamore Dr | 0.33mi | 3/2.5 (-1) | 2,000 (+11%) | 6mo | $265,000 | $133 | 56 |
| 765 Governor Rd | 0.64mi | 4/2.0 | 1,920 (+7%) | 2mo | $239,900 | $125 | 55 |
| 772 Imperial Rd | 0.55mi | 4/1.0 | 1,920 (+7%) | 8mo | $155,000 | $81 | 51 |
| 722 Devonshire Rd | 0.72mi | 4/2.0 | 1,920 (+7%) | 8mo | $248,000 | $129 | 47 |
Match score weights: distance 35% · size 25% · config 20% · recency 20%. Top-matched comps best support the ARV.
Projected returns pro-forma
-3.0% appreciation · 3.0% rent growth · sell at horizon
- IRR
- -18.7%
- Equity multiple
- 0.34×
- Total profit
- $-52,397
- Equity at exit
- $42,494
- IRR
- -11.3%
- Equity multiple
- 0.32×
- Total profit
- $-53,992
- Equity at exit
- $24,642
Cash invested: $79,800 (down + closing). Projections, not guarantees.
Landlord ↔ Tenant lean methodology
- Overall (STATE)
- 90 Strongly Landlord-Friendly
- State Indiana
- 90 Strongly Landlord-Friendly · R+11
- County
- — inherits STATE
- City
- — inherits STATE
ZIP-level market 46385
- Active inventory
- 375
- Price-to-rent
- 11.7×
Monthly cashflow live
- Estimated rent
- $2,038 medium interval (Pro) →
- Mortgage (P&I)
- −$1,495
- Tax from tax record
- −$92 /mo · $1,110/yr
- Insurance
- −$119
- HOA
- −$0
- Vacancy / Maint / Mgmt
- −$428
- Net cashflow
- $-96
Break-even live
UW: 25.0% down · 7.5% · 30yr · 1.5% tax · 5.0% vac · 8.0% maint · 8.0% mgmt
Financing live
Cash to close
- Down payment
- $71,250
- Closing costs
- $8,550
- Reserves months
- —
- Total cash needed
- —
Loan-product check · same deal, 3 products live
Conventional
25% down · 7.5% · 30yr
- Down + closing
- —
- Monthly P&I
- —
- Monthly cashflow
- —
- DSCR
- —
- Eligible?
- —
Personal DTI + credit; lowest rate.
DSCR
20% down · 8.5% · 30yr
- Down + closing
- —
- Monthly P&I
- —
- Monthly cashflow
- —
- DSCR
- —
- Eligible?
- —
No personal income docs; deal must DSCR.
Hard money
10% down · 12.0% · 12mo
- Down + closing
- —
- Monthly P&I
- —
- Monthly cashflow
- —
- DSCR
- —
- Eligible?
- —
Short-term bridge; refi at stabilization.
Rent comps 1 comps
| Address | Beds | Baths | Sqft | Rent | $/sqft | DOM | Units | Dist |
|---|---|---|---|---|---|---|---|---|
| 397 Plymouth Rd Unit B Valparaiso, IN | 3.0 | 2.0 | 1300 | $1,795 | $1.38 | 43d | 1 | 0.56mi |
Listing history 3 events
-
2026-06-02statusdays on market $285,000 Pending 4 DOM
-
2026-06-01days on market $285,000 Active 3 DOM
-
2026-05-31days on market $285,000 Active 2 DOM
ⓘ Source: listings_history table (triggers on properties + properties_extension) + one-shot
backfill from property_details.listing_events for pre-trigger history.
Tax reassessment forecast IN · Partial reset (capped growth)
- Current annual tax
- $1,110 · $92/mo
- Projected year-2 tax
- $1,766 · $147/mo
- Expected delta
- +$656/yr (+$55/mo · 59.1%)
ⓘ Screening estimate from a state-policy table — verify with the county assessor before closing.
Climate risk First Street
- Flood 1/10 Low FEMA zone X (unshaded) · 0% chance over 30 yrs
- Wildfire 1/10 Low
- Heat 2/10 Low 7 d/yr ≥102°F today · 15 d/yr by 30 yrs out
- Wind 2/10 Low 0% chance of damaging wind over 30 yrs
- Air quality 2/10 Low 1 unhealthy d/yr today · 2 by 30 yrs out
Nearby sold comps map
Loading sold comps map…
Walkable amenities ~0.75 mi
Loading nearby amenities…
Taxation est. · year 1
- Rental income
- $24,460
- − Mortgage interest
- −$15,964
- − Property taxes
- −$1,110
- − Insurance
- −$1,425
- − Repairs & maintenance
- −$1,957
- − Management
- −$1,957
- − Depreciation
- −$8,291
- Taxable loss
- −$6,244
- Est. tax savings @ 24.0%
- +$1,498
- After-tax cash flow
- $352/yr
For passive investors: Depreciation is non-cash, so a rental often shows a tax loss while cash-flowing — sheltering income. Rental losses are passive: they offset passive income freely, and up to $25,000/yr can offset ordinary (W-2) income if you actively participate and your MAGI is under $100k (phasing out to $0 by $150k); unused losses carry forward. On sale, claimed depreciation is recaptured at up to 25%, and gains may owe capital-gains tax (a 1031 exchange can defer both). Figures are a year-1 estimate at your 24.0% rate — not tax advice; consult a CPA.
Schools (NCES district)
- District
- Portage Township Schools
- NCES district ID
- 1809150
- Math proficiency
- 26% ▼ -15.00%
- Reading proficiency
- 36% ▼ -10.00%
- Median HH income
- $53,880
- Composite
- 27.37/100
- National rank
- #6978
- State rank
- #221 of 301 in IN
Livability — South Haven
- Score
- 72/100
- State rank
- #119
- US rank
- #6424
Category grades
Schools grade is shown separately in the Schools card above.
Census & demographics
- Census place
- South Haven, IN
- County
- Porter County · 151,647 people
- Metro
- Chicago-Naperville-Elgin, IL-IN-WI
- Population (ZIP)
- 40,856
- Household income
- $98,957
- Rent vs Own
- Severe rent burden
- 304.0
Population outlook (Porter County) Hauer SSP2
- Today (2025)
- 177,804 people
- By 2030
- 181,552 · +2.1%
- By 2040
- 185,830 · +4.5%
- By 2050
- 187,498 · +5.5%
- By 2075
- 189,585 · +6.6%
- By 2100
- 183,722 · +3.3%
Race, ethnicity, and origin ACS 2023
- Neighborhood character
- Predominantly White (83%)
- Race & ethnicity
- White 83% Hispanic / Latino 9% Two or more races 7% Black 2% Asian 2%
- Hispanic origin (detail)
- Mexican 6% Puerto Rican 2%
- Common ancestry
- Romanian 9% Italian 2% Lithuanian 2%
- Foreign-born
- 3% · Canada, Philippines
- Languages at home
- 94% English-only · Spanish 2% Other Indo-European 1% Russian/Polish/Slavic 1%
Political lean MEDSL · Porter
- 2024 margin
- R (+10.5) · D 43.8% · R 54.3% · Other 1.8%
- 2008→2024 swing
- -17.7pp toward R · 2008: 7.2pp · 2024: -10.5pp
- All cycles
- 2024: R+10.5 2020: R+6.1 2016: R+6.8 2012: D+3.8 2008: D+7.2
Not yet ingested
- Civics
- —
Market trends
- HPI YoY
- ▼ -151.11%
- Current HPI
- 201.7039
- Rent YoY
- —
- Metro
- Chicago-Naperville-Elgin, IL-IN-WI
- State GDP YoY
- ▲ 2.90%
- F500 in state
- 18
Industry mix (Fortune 500 HQ in IN)
| Industry | F500 HQs | Revenue |
|---|---|---|
| Industrial Machinery | 2 | $37B |
|
||
| Healthcare | 1 | $177B |
|
||
| Pharmaceuticals | 1 | $45B |
|
||
| Metals / Steel | 1 | $18B |
|
||
| Agriculture | 1 | $17B |
|
||
| Packaging | 1 | $12B |
|
||
Price history
+161.5% since first listed5 events — show timeline
- 2026-05-29 Listed $285,000 NIRA MLS as Distributed by MLS Grid
- 2006-03-03 Listing Removed — NIRA MLS as Distributed by MLS Grid
- 2005-01-24 Listed $109,000 NIRA MLS as Distributed by MLS Grid
- 2004-12-11 Listing Removed — NIRA MLS as Distributed by MLS Grid
- 2004-06-10 Listed $109,000 NIRA MLS as Distributed by MLS Grid
Property tax history
+1.3%/yrLatest (2024): $1,110 · -3.3% YoY. Source: county tax records.
Cash-flow waterfall
monthlySold comps — $/sqft
last 12 mo · ≤1 miLoading sold comps…