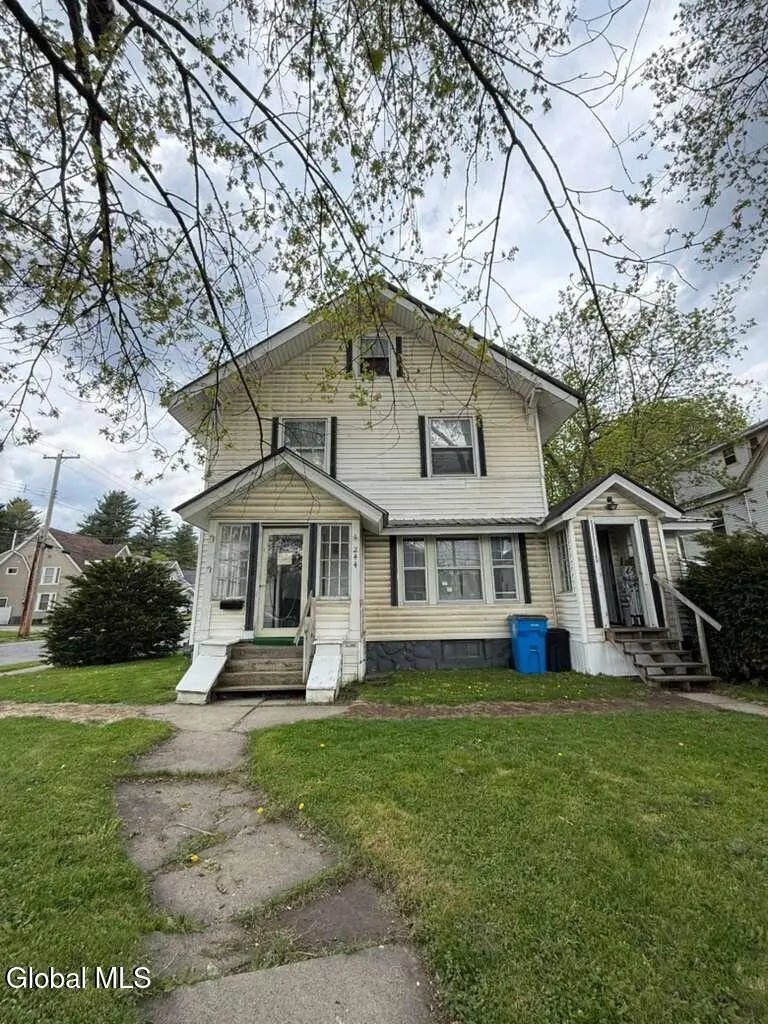
244 W Fulton St · Gloversville, NY
Flood risk 1/10 · Minimal
- FEMA flood zone
- X
- Chance of flooding over 30 yrs
- 0.0%
- Est. flood insurance / yr
- $473 – $860
Fire risk 2/10 · Minimal
- Est. fire insurance / yr
- $691 – $1,283
Heat risk 2/10 · Minimal
- Hot days now (above 95°F)
- 7 days/yr
- Hot days in 30 yrs
- 16 days/yr
Wind risk 2/10 · Minimal
- Chance of severe wind over 30 yrs
- 3.0%
Air-quality risk 1/10 · Minimal
- Unhealthy air days now
- 0 days/yr
- Unhealthy air days in 30 yrs
- 0 days/yr
Risk factors via First Street. Map © Google.
Why this score? — see what drove the C- grade
The composite is a weighted blend of 9 inputs, each scored 0–100. Each bar is that input's sub-score; the figure is the points it added to the 100-point composite (weight × sub-score).
- Cash flow +16.0/30.0
- Appreciation +10.0/10.0
- ARV discount +5.2/15.0
- DSCR +5.0/10.0
- Livability +4.1/5.0
- 1% rule +3.3/10.0
- Schools +2.8/10.0
- Rent growth +2.5/5.0
- Condition / age +2.5/5.0
$195,000
🖨 Deal sheet (PDF) 📄 Offer letter ✓ Due diligence
Listing remarks
Large, well-maintained single-family home featuring 5 bedrooms plus a separate studio apartment, perfect for in-laws, guests, or additional rental income. Recent updates include a new Navien condensing combination boiler and a new hot water tank. The property also offers ample parking, a small fenced backyard, and a convenient location near shopping and transportation.
Key facts
- New hot water tank
- Ample parking
- 6,534 sq ft lot
Tags
Property features AI
Exterior
- Parking: 6 parking spaces
- Utilities: Public water; Public sewer; 100 Amp electric service with circuit breakers
- Home design: Single family residence; Vinyl siding exterior; Stone foundation
- Construction: Shingle roof
- Exterior features: Garden; Back yard fence
Interior
- Kitchen: Range; Refrigerator
- Bedrooms: Bedroom on the first level; Three bedrooms on the second level; Two bedrooms on the third level
- Flooring: Hardwood
- Bathrooms: 2 full bathrooms (one on the first level, one on the second level)
- Heating & cooling: Hot water heating; Window air conditioning units
- Interior features: 9 rooms total; Full basement; Hardwood flooring
- Laundry & utility: Washer and dryer; Gas water heater
Neighborhood map
What this means for you Summary
Snapshot
- This is a 5-bed/1.0-bath single-family listed at $195k.
Deal economics
- At list price, monthly cash flow is $98 ($1k/yr) — positive.
- The deal already cash-flows at list — no discount required.
- To meet the 1% rule (rent ≥ 1% of price), the offer needs to be $162k (16.8% below list).
- Recommended offer: $162k (16.8% below list) — sets the bar for 1% rule.
Location & tenants
- Location reads 82/100 on livability (#70 in NY, #1,048 nationally) — a professional / high-income tenant draw. Strengths: amenities A+, commute A+, cost of living A+; Watch: employment F.
- Gloversville City School District (town): math 26% / reading 42% proficiency, ranked #565 of 590 in NY (top 96%) — families likely to look elsewhere, expect single-tenant / working-renter base with shorter leases.
- Zoned schools: Gloversville Middle School (math 6% / reading 35%, grade F, #664 of 729 statewide, top 91%, 548 students, 70% FRL); Gloversville High School (math 82% / reading 77%, grade A-, #518 of 1,100 statewide, top 51%, 697 students, 71% FRL) — zoned schools average 71% FRL vs 54% district-wide (16 pts higher); higher-poverty schools than district average — tighter screening recommended.
- Zoned-school proficiency averages 50% at this address vs 34% district-wide (+16 pts) — the actual schools serving this property are materially stronger than the Gloversville City School District average implies; a family-tenant draw the district grade alone would hide.
- Market conditions: 173 active listings in the ZIP; 112 units permitted in Fulton County in 2024 (50 in 5+ unit buildings).
Forward outlook
- In year one you build about $21k of equity ($1k loan paydown + $20k appreciation (10.0% local appreciation)).
- Fulton County population projected at -23% by 2050 — secular population decline; favor cash flow + early exit over multi-decade hold.
- At projected returns (10.0% appreciation + 3.0% rent growth), your $55k cash investment doubles in ~3 years — after that, you're playing with house money.
- By year 2, paydown + projected appreciation supports a ~$34k cash-out refi (75% LTV) — recoverable capital for the next deal without selling this one.
Negotiation context
- It's been on market 40 days — a 3% lower offer ($189k) is reasonable based on typical stale-listing flexibility.
- Current owner paid $37k; list at $195k implies a 423% gain — meaningful room to come down on a strong offer.
Risks & watch-outs
- Watch-outs: built in 1935 — expect roof / HVAC / electrical / plumbing capex.
Questions for the listing agent
- It's been on market 40 days. Have you received any prior offers? Is the seller open to a 17% concession, seller financing, or rate buy-down credit?
- Built in 1935 — when were the roof, HVAC, electrical panel, plumbing, and water heater last replaced?
- Is there a deadline driving the sale (1031 exchange, divorce, estate, relocation)? That informs how much negotiation room exists.
- Schools are D-rated, which usually means shorter tenancies and higher turnover. Who's the typical renter profile here, and what's been the actual vacancy rate?
- What's the average days-on-market for RENTAL listings here right now (not sales)? A rising rental-DOM trend means longer vacancies and softer asking-rent achievability than the comps imply.
- What's the recent tenant-quality profile in this submarket — average credit score on applications, eviction rate, late-payment / NSF rate, and stable-employment percentage? A property-management company in the area should have these aggregated.
- How much new for-sale + rental construction is in the pipeline within 1–3 miles? Heavy new supply typically softens prices + rents 12–24 months out; constrained supply supports both.
Investment metrics
- 1% rule
- 0.83% ✗
- Cap rate
- 6.90%
- Cash-on-cash
- 2.15%
- DSCR
- 1.10
- GRM
- 10.0
CMA / ARV
- ARV (median comp)
- $185,587
- List price
- $195,000
- Delta
- 5.07%
- Verdict
- FAIR
- Comps
- 20 within 1.0 mi
Show comp detail 3 sales within ~0.75 mi
| Address | Dist | Beds/Ba | Sqft | Sold | Price | $/sf | Match |
|---|---|---|---|---|---|---|---|
| 37 Highland Ter | 0.36mi | 4/1.5 (-1) | 1,839 (-10%) | 8mo | $260,000 | $141 | 53 |
| 34 Willow St | 0.70mi | 4/2.0 (-1) | 2,024 (-1%) | 20mo | $174,600 | $86 | 40 |
| 6 John St | 0.54mi | 4/1.5 (-1) | 2,300 (+12%) | 22mo | $135,000 | $59 | 29 |
Match score weights: distance 35% · size 25% · config 20% · recency 20%. Top-matched comps best support the ARV.
Projected returns pro-forma
10.0% appreciation · 3.0% rent growth · sell at horizon
- IRR
- 25.8%
- Equity multiple
- 3.06×
- Total profit
- $112,362
- Equity at exit
- $175,671
- IRR
- 22.7%
- Equity multiple
- 6.97×
- Total profit
- $325,831
- Equity at exit
- $378,842
Cash invested: $54,600 (down + closing). Projections, not guarantees.
Landlord ↔ Tenant lean methodology
- Overall (STATE)
- 15 Strongly Tenant-Friendly
- State New York
- 15 Strongly Tenant-Friendly · D+10
- County
- — inherits STATE
- City
- — inherits STATE
ZIP-level market 12078
- Home prices YoY
- 12.2%
- Active inventory
- 173
- Price-to-rent
- 10.0×
Monthly cashflow live
- Estimated rent
- $1,622 medium interval (Pro) →
- Mortgage (P&I)
- −$1,023
- Tax from tax record
- −$79 /mo · $954/yr
- Insurance
- −$81
- HOA
- −$0
- Vacancy / Maint / Mgmt
- −$341
- Net cashflow
- $98
Break-even live
Sensitivity live
| Price | -10% $208 | -5% $153 | +0% $98 | +5% $43 | +10% $-12 |
|---|---|---|---|---|---|
| Rent | -10% $-30 | -5% $34 | +0% $98 | +5% $162 | +10% $226 |
| Rate | -1.0pp $196 | -0.5pp $148 | base $98 | +0.5pp $47 | +1.0pp $-4 |
UW: 25.0% down · 7.5% · 30yr · 1.5% tax · 5.0% vac · 8.0% maint · 8.0% mgmt
Financing live
Cash to close
- Down payment
- $48,750
- Closing costs
- $5,850
- Reserves months
- —
- Total cash needed
- —
Loan-product check · same deal, 3 products live
Conventional
25% down · 7.5% · 30yr
- Down + closing
- —
- Monthly P&I
- —
- Monthly cashflow
- —
- DSCR
- —
- Eligible?
- —
Personal DTI + credit; lowest rate.
DSCR
20% down · 8.5% · 30yr
- Down + closing
- —
- Monthly P&I
- —
- Monthly cashflow
- —
- DSCR
- —
- Eligible?
- —
No personal income docs; deal must DSCR.
Hard money
10% down · 12.0% · 12mo
- Down + closing
- —
- Monthly P&I
- —
- Monthly cashflow
- —
- DSCR
- —
- Eligible?
- —
Short-term bridge; refi at stabilization.
Listing history 19 events
-
2026-06-21days on market $195,000 Active 40 DOM
-
2026-06-21days on market $195,000 Active 39 DOM
-
2026-06-18days on market $195,000 Active 37 DOM
-
2026-06-17days on market $195,000 Active 36 DOM
-
2026-06-16days on market $195,000 Active 35 DOM
-
2026-06-15days on market $195,000 Active 34 DOM
-
2026-06-13days on market $195,000 Active 32 DOM
-
2026-06-12days on market $195,000 Active 31 DOM
-
2026-06-09days on market $195,000 Active 28 DOM
-
2026-06-08days on market $195,000 Active 27 DOM
-
2026-06-07days on market $195,000 Active 26 DOM
-
2026-06-07days on market $195,000 Active 25 DOM
-
2026-06-04days on market $195,000 Active 22 DOM
-
2026-06-02days on market $195,000 Active 21 DOM
-
2026-06-01days on market $195,000 Active 20 DOM
-
2026-05-31days on market $195,000 Active 19 DOM
-
2026-05-12$195,000 Active 371-char remark
-
1999-01-15soldstatus $37,300
-
1994-09-27soldstatus $55,000
ⓘ Source: listings_history table (triggers on properties + properties_extension) + one-shot
backfill from property_details.listing_events for pre-trigger history.
Tax reassessment forecast NY · Partial reset (capped growth)
- Current annual tax
- $954 · $79/mo
- Projected year-2 tax
- $2,125 · $177/mo
- Expected delta
- +$1,171/yr (+$98/mo · 122.8%)
ⓘ Screening estimate from a state-policy table — verify with the county assessor before closing.
Climate risk First Street
- Flood 1/10 Low FEMA zone X · 0% chance over 30 yrs
- Wildfire 2/10 Low
- Heat 2/10 Low 7 d/yr ≥95°F today · 16 d/yr by 30 yrs out
- Wind 2/10 Low 3% chance of damaging wind over 30 yrs
- Air quality 1/10 Low 0 unhealthy d/yr today · 0 by 30 yrs out
Nearby sold comps map
Loading sold comps map…
Walkable amenities ~0.75 mi
Loading nearby amenities…
Taxation est. · year 1
- Rental income
- $19,462
- − Mortgage interest
- −$10,923
- − Property taxes
- −$954
- − Insurance
- −$975
- − Repairs & maintenance
- −$1,557
- − Management
- −$1,557
- − Depreciation
- −$5,673
- Taxable loss
- −$2,177
- Est. tax savings @ 24.0%
- +$522
- After-tax cash flow
- $1,697/yr
For passive investors: Depreciation is non-cash, so a rental often shows a tax loss while cash-flowing — sheltering income. Rental losses are passive: they offset passive income freely, and up to $25,000/yr can offset ordinary (W-2) income if you actively participate and your MAGI is under $100k (phasing out to $0 by $150k); unused losses carry forward. On sale, claimed depreciation is recaptured at up to 25%, and gains may owe capital-gains tax (a 1031 exchange can defer both). Figures are a year-1 estimate at your 24.0% rate — not tax advice; consult a CPA.
Schools (NCES district)
- District
- Gloversville City School District
- NCES district ID
- 3612270
- Math proficiency
- 26% ▼ -6.00%
- Reading proficiency
- 42% ▲ 7.00%
- Median HH income
- $36,775
- Composite
- 28.2/100
- National rank
- #6806
- State rank
- #565 of 590 in NY
Livability — Gloversville
- Score
- 82/100
- State rank
- #70
- US rank
- #1048
Category grades
Schools grade is shown separately in the Schools card above.
Census & demographics
- Census place
- Gloversville, NY
- Population (ZIP)
- 23,087
Population outlook (Fulton County) Hauer SSP2
- Today (2025)
- 51,132 people
- By 2030
- 49,114 · -3.9%
- By 2040
- 44,373 · -13.2%
- By 2050
- 39,321 · -23.1%
- By 2075
- 28,503 · -44.3%
- By 2100
- 19,268 · -62.3%
Race, ethnicity, and origin ACS 2023
- Neighborhood character
- Predominantly White (86%)
- Race & ethnicity
- White 86% Two or more races 8% Hispanic / Latino 5% Black 2% Asian 1%
- Hispanic origin (detail)
- Puerto Rican 3%
- Common ancestry
- Lithuanian 5% Romanian 4% Iranian 4%
- Foreign-born
- 2% · Canada, China
- Languages at home
- 97% English-only · Spanish 2%
Political lean MEDSL · Fulton
- 2024 margin
- Solid R (+35.9) · D 32.1% · R 67.9%
- 2008→2024 swing
- -26.6pp toward R · 2008: -9.2pp · 2024: -35.9pp
- All cycles
- 2024: R+35.9 2020: R+31.4 2016: R+35.5 2012: R+10.5 2008: R+9.2
Not yet ingested
- Civics
- —
Market trends
- HPI YoY
- ▲ 34.22%
- Current HPI
- 315.1368
- Rent YoY
- —
- Metro
- —
- State GDP YoY
- ▲ 2.60%
- F500 in state
- 92
Industry mix (Fortune 500 HQ in NY)
| Industry | F500 HQs | Revenue |
|---|---|---|
| Financial Services | 10 | $950B |
|
||
| Consumer Goods | 9 | $162B |
|
||
| Insurance | 4 | $225B |
|
||
| Telecommunications | 2 | $144B |
|
||
| Pharmaceuticals | 2 | $112B |
|
||
| Media / Entertainment | 2 | $69B |
|
||
Price history
+254.5% since first listed3 events — show timeline
- 2026-05-12 Listed $195,000 Global MLS
- 1999-01-15 Sold (Public Records) $37,300 Public Records
- 1994-09-27 Sold (Public Records) $55,000 Public Records
Property tax history
-0.9%/yrLatest (2025): $954 · +5.4% YoY. Source: county tax records.
Cash-flow waterfall
monthlySold comps — $/sqft
last 12 mo · ≤1 miLoading sold comps…