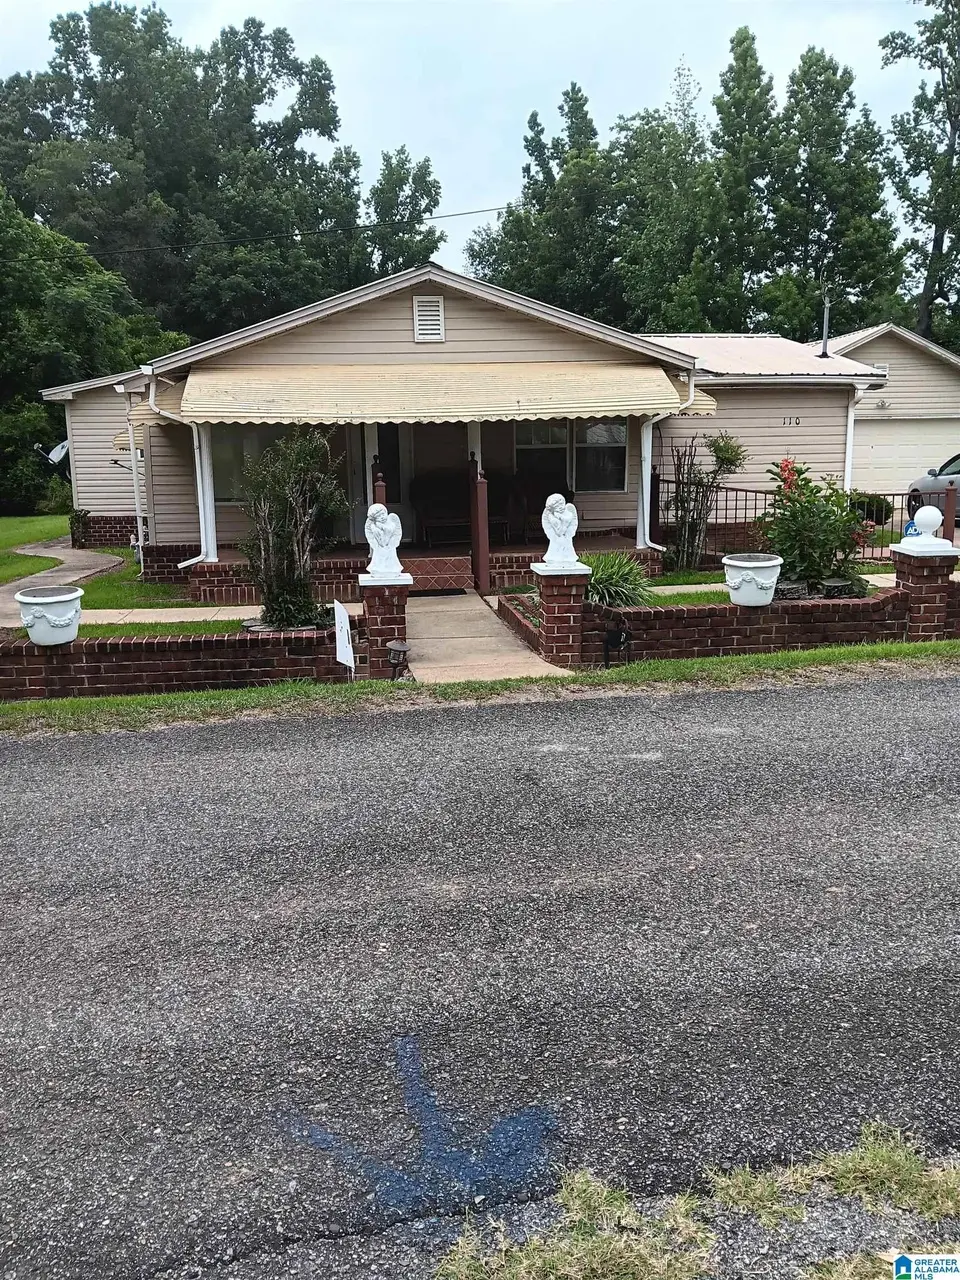
110 3rd Ave N · Akron, AL
Flood risk 1/10 · Minimal
- FEMA flood zone
- A
- Chance of flooding over 30 yrs
- 0.0%
- Est. flood insurance / yr
- $1,009 – $1,996
Fire risk 3/10 · Minor
- Est. fire insurance / yr
- $916 – $1,700
Heat risk 7/10 · Major
- Hot days now (above 108°F)
- 7 days/yr
- Hot days in 30 yrs
- 20 days/yr
Wind risk 6/10 · Moderate
- Chance of severe wind over 30 yrs
- 68.0%
Air-quality risk 1/10 · Minimal
- Unhealthy air days now
- 0 days/yr
- Unhealthy air days in 30 yrs
- 0 days/yr
Risk factors via First Street. Map © Google.
Why this score? — see what drove the C grade
The composite is a weighted blend of 9 inputs, each scored 0–100. Each bar is that input's sub-score; the figure is the points it added to the 100-point composite (weight × sub-score).
- Cash flow +22.5/30.0
- ARV discount +7.5/15.0
- DSCR +7.2/10.0
- 1% rule +5.9/10.0
- Appreciation +5.0/10.0
- Rent growth +2.5/5.0
- Livability +2.5/5.0
- Condition / age +2.2/5.0
- Schools +1.5/10.0
$125,000
🖨 Deal sheet 📄 Offer letter ✓ Due diligence
Listing remarks MLS
Come one come all to View this well kept family home nestled in the historic community of Akron. This property features 4 bedroom and 3 full baths. Laundry and sun room. It sits on . 5 acre of land. Storage house is included. Pictures could not be uploaded to MLS, but they are available thru text or email. I apologize for the inconvenience.
Key facts
- Historic community
- Storage house
- Sun room
Tags
Neighborhood map
What this means for you Summary
Snapshot
- This is a 4-bed/3.0-bath single-family listed at $125k. Condition is rated fair.
Deal economics
- At list price, monthly cash flow is $85 ($1k/yr) — positive.
- The deal already cash-flows at list — no discount required.
- Meets the 1% rule at list price ($1k rent vs $125k).
- Recommended offer: $110k (12.0% below list) — sets the bar for market timing.
Location & tenants
- Location reads 49/100 on livability (#535 in AL) — a working-class tenant base; expect higher turnover. Strengths: cost of living A+; Watch: health & safety D, schools F, crime F.
- Hale County (rural): math 6% / reading 31% proficiency, ranked #109 of 129 in AL (top 84%) — low school quality limits family demand, transient renter base, plan for 1-2y turnover; 68% free/reduced lunch — lower-income household profile, screen leases tightly.
- Market conditions: 16 active listings in the ZIP; 11 units permitted in Hale County in 2024 (0 in 5+ unit buildings).
Forward outlook
- In year one you build about $5k of equity ($864 loan paydown + $4k appreciation (3.0% local appreciation)).
- Hale County population projected at -27% by 2050 — secular population decline; favor cash flow + early exit over multi-decade hold.
- At projected returns (3.0% appreciation + 3.0% rent growth), your $35k cash investment doubles in ~6 years — after that, you're playing with house money.
- By year 8, paydown + projected appreciation supports a ~$34k cash-out refi (75% LTV) — recoverable capital for the next deal without selling this one.
Negotiation context
- It's been on market 273 days — a 12% lower offer ($110k) is reasonable based on typical stale-listing flexibility.
Risks & watch-outs
- Watch-outs: flood insurance adds $125/mo; built in 1925 — expect roof / HVAC / electrical / plumbing capex.
- Climate carrying-cost: in FEMA flood zone A (mandatory federal flood insurance); major wind risk, 68% chance of damaging wind over 30y; extreme-heat days projected 7→20/yr by 2055 (HVAC capex compounding) — expect insurance premiums to compound above CPI over the hold.
Questions for the listing agent
- It's been on market 273 days. Have you received any prior offers? Is the seller open to a 12% concession, seller financing, or rate buy-down credit?
- Have any recent inspections been done? Can we get a copy of the seller's disclosures and any deferred-maintenance estimates?
- Built in 1925 — when were the roof, HVAC, electrical panel, plumbing, and water heater last replaced?
- What's the actual annual flood-insurance premium (NFIP or private), and is the property in a SFHA with mandatory coverage?
- Why hasn't it sold? Are there any deal-killer items the seller is aware of (foundation, flood, title, zoning, code violations)?
- Is there a deadline driving the sale (1031 exchange, divorce, estate, relocation)? That informs how much negotiation room exists.
- Schools are F-rated, which usually means shorter tenancies and higher turnover. Who's the typical renter profile here, and what's been the actual vacancy rate?
- Crime grade is F in this area — have there been break-ins, vandalism, or insurance claims at this property in the last 3 years? What carrier currently insures it and at what premium?
- What's the average days-on-market for RENTAL listings here right now (not sales)? A rising rental-DOM trend means longer vacancies and softer asking-rent achievability than the comps imply.
- What's the recent tenant-quality profile in this submarket — average credit score on applications, eviction rate, late-payment / NSF rate, and stable-employment percentage? A property-management company in the area should have these aggregated.
- How much new for-sale + rental construction is in the pipeline within 1–3 miles? Heavy new supply typically softens prices + rents 12–24 months out; constrained supply supports both.
Investment metrics
- 1% rule
- 1.09% ✓
- Cap rate
- 8.31%
- Cash-on-cash
- 7.22%
- DSCR
- 1.32
- GRM
- 7.7
CMA / ARV
- ARV (median comp)
- $323,287
- List price
- $125,000
- Delta
- -61.33%
- Verdict
- UNDERPRICED
- Comps
- 2 within 2.0 mi
Projected returns pro-forma
3.0% appreciation · 3.0% rent growth · sell at horizon
- IRR
- 10.3%
- Equity multiple
- 1.59×
- Total profit
- $20,594
- Equity at exit
- $56,205
- IRR
- 12.6%
- Equity multiple
- 2.88×
- Total profit
- $65,844
- Equity at exit
- $86,619
Cash invested: $35,000 (down + closing). Projections, not guarantees.
Landlord ↔ Tenant lean methodology
- Overall (STATE)
- 90 Strongly Landlord-Friendly
- State Alabama
- 90 Strongly Landlord-Friendly · R+15
- County
- — inherits STATE
- City
- — inherits STATE
ZIP-level market 35441
- Active inventory
- 16
- Price-to-rent
- 7.7×
Monthly cashflow live
- Estimated rent
- $1,360 medium interval (Pro) →
- Mortgage (P&I)
- −$656
- Tax est. 1.5%
- −$156 /mo · $1,875/yr
- Insurance
- −$52
- Flood insurance flood zone
- −$125 /mo · $1,502/yr
- HOA
- −$0
- Vacancy / Maint / Mgmt
- −$286
- Net cashflow
- $85
Break-even live
UW: 25.0% down · 7.5% · 30yr · 1.5% tax · 5.0% vac · 8.0% maint · 8.0% mgmt
Financing live
Cash to close
- Down payment
- $31,250
- Closing costs
- $3,750
- Reserves months
- —
- Total cash needed
- —
Loan-product check · same deal, 3 products live
Conventional
25% down · 7.5% · 30yr
- Down + closing
- —
- Monthly P&I
- —
- Monthly cashflow
- —
- DSCR
- —
- Eligible?
- —
Personal DTI + credit; lowest rate.
DSCR
20% down · 8.5% · 30yr
- Down + closing
- —
- Monthly P&I
- —
- Monthly cashflow
- —
- DSCR
- —
- Eligible?
- —
No personal income docs; deal must DSCR.
Hard money
10% down · 12.0% · 12mo
- Down + closing
- —
- Monthly P&I
- —
- Monthly cashflow
- —
- DSCR
- —
- Eligible?
- —
Short-term bridge; refi at stabilization.
Listing history 17 events
-
2026-06-19days on market $125,000 Active 273 DOM
-
2026-06-18days on market $125,000 Active 272 DOM
-
2026-06-17days on market $125,000 Active 271 DOM
-
2026-06-16days on market $125,000 Active 270 DOM
-
2026-06-15days on market $125,000 Active 269 DOM
-
2026-06-14days on market $125,000 Active 267 DOM
-
2026-06-12days on market $125,000 Active 266 DOM
-
2026-06-09days on market $125,000 Active 263 DOM
-
2026-06-08days on market $125,000 Active 262 DOM
-
2026-06-07days on market $125,000 Active 261 DOM
-
2026-06-07days on market $125,000 Active 260 DOM
-
2026-06-04days on market $125,000 Active 257 DOM
-
2026-06-02days on market $125,000 Active 256 DOM
-
2026-06-01days on market $125,000 Active 255 DOM
-
2026-05-31days on market $125,000 Active 254 DOM
-
2026-05-31days on market $125,000 Active 253 DOM
-
2025-08-14$125,000 Active 342-char remark
Show marketing remark (342 chars)
Come one come all to View this well kept family home nestled in the historic community of Akron. This property features 4 bedroom and 3 full baths. Laundry and sun room. It sits on . 5 acre of land. Storage house is included. Pictures could not be uploaded to MLS, but they are available thru text or email. I apologize for the inconvenience.
ⓘ Source: listings_history table (triggers on properties + properties_extension) + one-shot
backfill from property_details.listing_events for pre-trigger history.
Climate risk First Street
- Flood 1/10 Low FEMA zone A · 0% chance over 30 yrs
- Wildfire 3/10 Moderate
- Heat 7/10 Severe 7 d/yr ≥108°F today · 20 d/yr by 30 yrs out
- Wind 6/10 Major 68% chance of damaging wind over 30 yrs
- Air quality 1/10 Low 0 unhealthy d/yr today · 0 by 30 yrs out
Nearby sold comps map
Loading sold comps map…
Walkable amenities ~0.75 mi
Loading nearby amenities…
Taxation est. · year 1
- Rental income
- $16,321
- − Mortgage interest
- −$7,002
- − Property taxes
- −$1,875
- − Insurance
- −$2,128
- − Repairs & maintenance
- −$1,306
- − Management
- −$1,306
- − Depreciation
- −$3,636
- Taxable loss
- −$932
- Est. tax savings @ 24.0%
- +$224
- After-tax cash flow
- $1,248/yr
For passive investors: Depreciation is non-cash, so a rental often shows a tax loss while cash-flowing — sheltering income. Rental losses are passive: they offset passive income freely, and up to $25,000/yr can offset ordinary (W-2) income if you actively participate and your MAGI is under $100k (phasing out to $0 by $150k); unused losses carry forward. On sale, claimed depreciation is recaptured at up to 25%, and gains may owe capital-gains tax (a 1031 exchange can defer both). Figures are a year-1 estimate at your 24.0% rate — not tax advice; consult a CPA.
Condition & rehab AI · 13 photos
The home is in fair condition with some minor repairs and maintenance needed. Painting the exterior siding and trimming the landscaping and fencing can significantly increase its resale and rental value.
Repairs flagged
- Minor Landscaping and fencing — The landscaping and fencing are overgrown and in need of trimming.
Value-add opportunities
- Resale Painting the exterior siding — Painting the exterior siding can improve the curb appeal and increase the home's resale value.
- Rental Trimming the landscaping and fencing — Trimming the landscaping and fencing can improve the home's curb appeal and increase its rental value.
Renovation cost estimate screening
| Repair item | Severity | Est. cost |
|---|---|---|
| Landscaping and fencing · The landscaping and fencing are overgrown and in need of trimming. | Minor | $500–3,000 |
| Total estimated repair cost · 1 items | $500–3,000 |
Value-add ROI direction
- Resale Painting the exterior siding — Painting the exterior siding can improve the curb appeal and increase the home's resale value. ↑
- Rental Trimming the landscaping and fencing — Trimming the landscaping and fencing can improve the home's curb appeal and increase its rental value. ↑
ⓘ Cost ranges are severity-bucket heuristics (US national rule-of-thumb). Get contractor quotes + a written scope before underwriting a rehab budget.
Schools (NCES district)
- District
- Hale County
- NCES district ID
- 0101710
- Math proficiency
- 6% ▼ -26.00%
- Reading proficiency
- 31% ▼ -3.00%
- Median HH income
- $31,076
- Composite
- 14.76/100
- National rank
- #9391
- State rank
- #109 of 129 in AL
Livability — Akron
- Score
- 49/100
- State rank
- #535
- US rank
- #25893
Category grades
Schools grade is shown separately in the Schools card above.
Census & demographics
- Census place
- Akron, AL
- Population (ZIP)
- 881
Population outlook (Hale County) Hauer SSP2
- Today (2025)
- 13,830 people
- By 2030
- 13,032 · -5.8%
- By 2040
- 11,487 · -16.9%
- By 2050
- 10,091 · -27.0%
- By 2075
- 7,930 · -42.7%
- By 2100
- 6,595 · -52.3%
Race, ethnicity, and origin ACS 2023
- Neighborhood character
- Majority Black (53%)
- Race & ethnicity
- Black 53% White 43% Two or more races 5%
- Common ancestry
- Slovak 1% Serbian 1%
- Languages at home
- 99% English-only · Spanish 1%
Political lean MEDSL · Hale
- 2024 margin
- Lean D (+6.8) · D 53.1% · R 46.2%
- 2008→2024 swing
- -14.8pp toward R · 2008: 21.7pp · 2024: 6.8pp
- All cycles
- 2024: D+6.8 2020: D+18.9 2016: D+20.0 2012: D+25.4 2008: D+21.7
Not yet ingested
- Civics
- —
Market trends
- HPI YoY
- —
- Current HPI
- —
- Rent YoY
- —
- Metro
- —
- State GDP YoY
- ▲ 2.94%
- F500 in state
- 4
Industry mix (Fortune 500 HQ in AL)
| Industry | F500 HQs | Revenue |
|---|---|---|
| Financial Services | 1 | $8B |
|
||
| Healthcare | 1 | $5B |
|
||
Price history
1 event — show timeline
- 2025-08-14 Listed $125,000 Greater Alabama MLS
Cash-flow waterfall
monthlySold comps — $/sqft
last 12 mo · ≤1 miLoading sold comps…