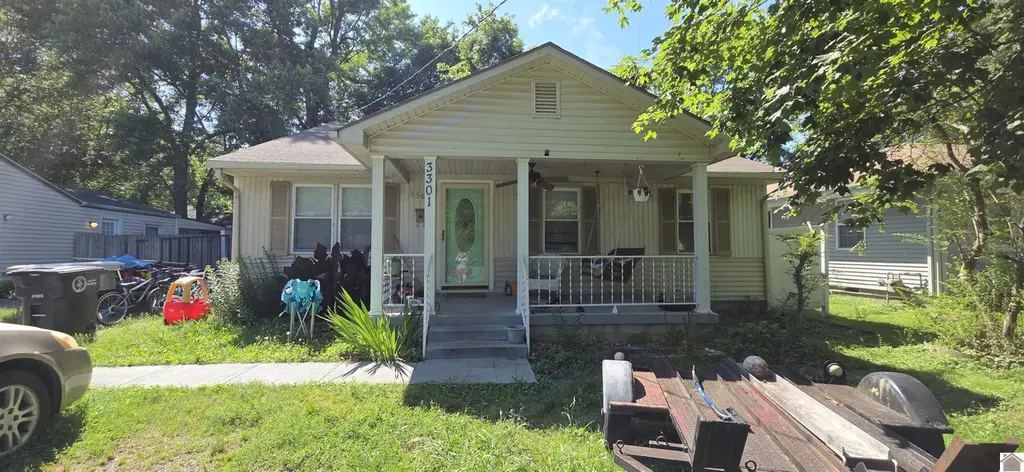
3301 Schneidman Rd · Paducah, KY
Flood risk 1/10 · Minimal
- FEMA flood zone
- X (unshaded)
- Chance of flooding over 30 yrs
- 0.0%
- Est. flood insurance / yr
- $507 – $1,088
Fire risk 3/10 · Minor
- Est. fire insurance / yr
- $839 – $1,559
Heat risk 6/10 · Moderate
- Hot days now (above 108°F)
- 7 days/yr
- Hot days in 30 yrs
- 20 days/yr
Wind risk 3/10 · Minor
- Chance of severe wind over 30 yrs
- 7.0%
Air-quality risk 3/10 · Minor
- Unhealthy air days now
- 1 days/yr
- Unhealthy air days in 30 yrs
- 4 days/yr
Risk factors via First Street. Map © Google.
Why this score? — see what drove the D+ grade
The composite is a weighted blend of 9 inputs, each scored 0–100. Each bar is that input's sub-score; the figure is the points it added to the 100-point composite (weight × sub-score).
- Cash flow +22.6/30.0
- DSCR +7.3/10.0
- 1% rule +4.5/10.0
- Livability +3.4/5.0
- Rent growth +2.5/5.0
- Condition / age +2.5/5.0
- Schools +2.3/10.0
- ARV discount +1.4/15.0
- Appreciation +0.0/10.0
$150,000
🖨 Deal sheet 📄 Offer letter ✓ Due diligence
Listing remarks MLS
Cute home in Paducah's city limits. 4 bedroom, 2 bath with 1486 square feet living space. Home has been remodeled in the last couple of months. Gas log fireplace in family room. Nice covered front porch. Fenced back yard.
Key facts
- Spacious yard
- Front porch
- Year old appliances
Tags
Property features AI
Exterior
- Security: Smoke detectors
- Utilities: Public water; Public sewer; Natural gas available
- Home design: Single family residence; Single-story
- Exterior features: Storm doors; Fenced yard; Shingle roof
Interior
- Kitchen: Dishwasher; Refrigerator; Cooktop
- Flooring: Carpet; Tile
- Bathrooms: 2 full bathrooms
- Heating & cooling: Natural gas heating; Central air conditioning
- Interior features: Fireplace in the family room; Crawl space basement
- Laundry & utility: Gas water heater
Neighborhood map
What this means for you Summary
Snapshot
- This is a 4-bed/2.0-bath single-family listed at $150k.
Deal economics
- At list price, monthly cash flow is $257 ($3k/yr) — positive.
- The deal already cash-flows at list — no discount required.
- To meet the 1% rule (rent ≥ 1% of price), the offer needs to be $143k (4.5% below list).
- Recommended offer: $143k (4.5% below list) — sets the bar for 1% rule.
- Cap rate 8.3% vs local median 4.5% in Paducah — top-decile yield for the area; either an underpriced asset or a hidden risk that comps aren't pricing in. Stress-test before assuming the spread holds.
Location & tenants
- Location reads 68/100 on livability (#197 in KY) — a middle-class / working-renter tenant base. Strengths: cost of living A+, housing A+, health & safety A+; Watch: crime C-, employment D, amenities F.
- Paducah Independent (town): math 22% / reading 36% proficiency, ranked #122 of 165 in KY (top 74%) — low school quality limits family demand, transient renter base, plan for 1-2y turnover; 69% free/reduced lunch — lower-income household profile, screen leases tightly.
- Zoned schools: Morgan Elementary School (math 17% / reading 22%, grade F, #572 of 676 statewide, top 88%, 380 students, 89% FRL); Paducah Middle School (math 19% / reading 36%, grade F, #168 of 217 statewide, top 78%, 652 students, 69% FRL); Paducah Tilghman High School (math 22% / reading 42%, grade F, #97 of 254 statewide, top 46%, 878 students, 64% FRL) — zoned schools at 74% FRL track the district average.
- Market conditions: 268 active listings in the ZIP; 187 units permitted in McCracken County in 2024 (104 in 5+ unit buildings).
Forward outlook
- Local home prices are declining (-3.0%/yr); year-one equity from $1k of loan paydown is wiped out by about $4k of value loss. Plan a longer hold.
- McCracken County population projected to shrink 9% by 2050 — rents likely to lag national; underwrite the cash flow, not the appreciation.
Negotiation context
- It's been on market 19 days — a 2% lower offer ($148k) is reasonable based on typical stale-listing flexibility.
- 3 sale attempts since 12y ago with the ask held roughly flat each time — persistent listings suggest the price (not the market) is what's stuck; bring a comps-based counter.
Risks & watch-outs
- Climate carrying-cost: extreme-heat days projected 7→20/yr by 2055 (HVAC capex compounding) — expect insurance premiums to compound above CPI over the hold.
Questions for the listing agent
- Is there a deadline driving the sale (1031 exchange, divorce, estate, relocation)? That informs how much negotiation room exists.
- Schools are D-rated, which usually means shorter tenancies and higher turnover. Who's the typical renter profile here, and what's been the actual vacancy rate?
- The area grade is low — what's the realistic commute time and amenity access for the typical tenant pool here? Any planned neighborhood developments (good or bad) we should know about?
- What's the average days-on-market for RENTAL listings here right now (not sales)? A rising rental-DOM trend means longer vacancies and softer asking-rent achievability than the comps imply.
- What's the recent tenant-quality profile in this submarket — average credit score on applications, eviction rate, late-payment / NSF rate, and stable-employment percentage? A property-management company in the area should have these aggregated.
- How much new for-sale + rental construction is in the pipeline within 1–3 miles? Heavy new supply typically softens prices + rents 12–24 months out; constrained supply supports both.
Investment metrics
- 1% rule
- 0.95% ✗
- Cap rate
- 8.35%
- Cash-on-cash
- 7.33%
- DSCR
- 1.33
- GRM
- 8.7
CMA / ARV
- ARV (on-the-fly)
- $131,987
- Comps found
- 12
Show comp detail 12 sales within ~0.75 mi
| Address | Dist | Beds/Ba | Sqft | Sold | Price | $/sf | Match |
|---|---|---|---|---|---|---|---|
| 109 Beiderman St | 0.18mi | 3/1.0 (-1) | 1,454 (-2%) | 3mo | $25,000 | $17 | 77 |
| 2915 Mayfield Rd | 0.25mi | 3/2.0 (-1) | 1,500 (+1%) | 8mo | $199,000 | $133 | 75 |
| 3039 Old Mayfield Rd | 0.17mi | 3/1.0 (-1) | 1,540 (+4%) | 7mo | $159,500 | $104 | 71 |
| 2306 Beiderman St | 0.30mi | 3/2.0 (-1) | 1,507 (+2%) | 16mo | $98,000 | $65 | 65 |
| 520 Holly Dr | 0.59mi | 3/1.5 (-1) | 1,485 (+0%) | 7mo | $190,000 | $128 | 60 |
| 2600 Mississippi St | 0.58mi | 3/2.0 (-1) | 1,488 (+0%) | 13mo | $104,500 | $70 | 57 |
| 2018 S 29th St | 0.31mi | 3/1.0 (-1) | 1,350 (-9%) | 6mo | $120,000 | $89 | 57 |
| 200 Lions Den Ln | 0.44mi | 3/2.0 (-1) | 1,560 (+5%) | 12mo | $208,000 | $133 | 56 |
| 2500 Alabama St | 0.65mi | 3/2.0 (-1) | 1,408 (-5%) | 11mo | $105,000 | $75 | 48 |
| 2310 S 28th St | 0.51mi | 3/2.0 (-1) | 1,616 (+9%) | 11mo | $80,000 | $50 | 48 |
| 1106 Bell Ave | 0.19mi | 3/1.0 (-1) | 1,680 (+13%) | 16mo | $144,900 | $86 | 46 |
| 720 Berger Rd | 0.63mi | 3/2.0 (-1) | 1,663 (+12%) | 12mo | $199,500 | $120 | 35 |
Match score weights: distance 35% · size 25% · config 20% · recency 20%. Top-matched comps best support the ARV.
Projected returns pro-forma
-3.0% appreciation · 3.0% rent growth · sell at horizon
- IRR
- -5.1%
- Equity multiple
- 0.81×
- Total profit
- $-8,047
- Equity at exit
- $22,365
- IRR
- 4.5%
- Equity multiple
- 1.33×
- Total profit
- $13,715
- Equity at exit
- $12,969
Cash invested: $42,000 (down + closing). Projections, not guarantees.
Landlord ↔ Tenant lean methodology
- Overall (STATE)
- 83 Strongly Landlord-Friendly
- State Kentucky
- 83 Strongly Landlord-Friendly · R+16
- County
- — inherits STATE
- City
- — inherits STATE
ZIP-level market 42003
- Home prices YoY
- -19.8%
- Active inventory
- 268
- Price-to-rent
- 8.7×
Monthly cashflow live
- Estimated rent
- $1,432 medium interval (Pro) →
- Mortgage (P&I)
- −$787
- Tax from tax record
- −$26 /mo · $310/yr
- Insurance
- −$62
- HOA
- −$0
- Vacancy / Maint / Mgmt
- −$301
- Net cashflow
- $257
Break-even live
UW: 25.0% down · 7.5% · 30yr · 1.5% tax · 5.0% vac · 8.0% maint · 8.0% mgmt
Financing live
Cash to close
- Down payment
- $37,500
- Closing costs
- $4,500
- Reserves months
- —
- Total cash needed
- —
Loan-product check · same deal, 3 products live
Conventional
25% down · 7.5% · 30yr
- Down + closing
- —
- Monthly P&I
- —
- Monthly cashflow
- —
- DSCR
- —
- Eligible?
- —
Personal DTI + credit; lowest rate.
DSCR
20% down · 8.5% · 30yr
- Down + closing
- —
- Monthly P&I
- —
- Monthly cashflow
- —
- DSCR
- —
- Eligible?
- —
No personal income docs; deal must DSCR.
Hard money
10% down · 12.0% · 12mo
- Down + closing
- —
- Monthly P&I
- —
- Monthly cashflow
- —
- DSCR
- —
- Eligible?
- —
Short-term bridge; refi at stabilization.
Listing history 14 events
-
2026-06-19days on market $150,000 Active 19 DOM
-
2026-06-18days on market $150,000 Active 18 DOM
-
2026-06-17days on market $150,000 Active 17 DOM
-
2026-06-16pricedays on market $150,000 Active 16 DOM
-
2026-06-15days on market $157,000 Active 15 DOM
-
2026-06-14days on market $157,000 Active 13 DOM
-
2026-06-12days on market $157,000 Active 12 DOM
-
2026-06-09days on market $157,000 Active 9 DOM
-
2026-06-08days on market $157,000 Active 8 DOM
-
2026-06-07days on market $157,000 Active 7 DOM
-
2026-06-03days on market $157,000 Active 3 DOM
-
2026-06-02days on market $157,000 Active 2 DOM
-
2026-05-31remarks 364-char remark
-
2026-05-31$157,000 Active 1 DOM
ⓘ Source: listings_history table (triggers on properties + properties_extension) + one-shot
backfill from property_details.listing_events for pre-trigger history.
Tax reassessment forecast KY · Resets to sale price
- Current annual tax
- $310 · $26/mo
- Projected year-2 tax
- $1,290 · $108/mo
- Expected delta
- +$980/yr (+$82/mo · 316.6%)
ⓘ Screening estimate from a state-policy table — verify with the county assessor before closing.
Climate risk First Street
- Flood 1/10 Low FEMA zone X (unshaded) · 0% chance over 30 yrs
- Wildfire 3/10 Moderate
- Heat 6/10 Major 7 d/yr ≥108°F today · 20 d/yr by 30 yrs out
- Wind 3/10 Moderate 7% chance of damaging wind over 30 yrs
- Air quality 3/10 Moderate 1 unhealthy d/yr today · 4 by 30 yrs out
Nearby sold comps map
Loading sold comps map…
Walkable amenities ~0.75 mi
Loading nearby amenities…
Taxation est. · year 1
- Rental income
- $17,186
- − Mortgage interest
- −$8,402
- − Property taxes
- −$310
- − Insurance
- −$750
- − Repairs & maintenance
- −$1,375
- − Management
- −$1,375
- − Depreciation
- −$4,364
- Taxable income
- $611
- Est. tax owed @ 24.0%
- −$147
- After-tax cash flow
- $2,932/yr
For passive investors: Depreciation is non-cash, so a rental often shows a tax loss while cash-flowing — sheltering income. Rental losses are passive: they offset passive income freely, and up to $25,000/yr can offset ordinary (W-2) income if you actively participate and your MAGI is under $100k (phasing out to $0 by $150k); unused losses carry forward. On sale, claimed depreciation is recaptured at up to 25%, and gains may owe capital-gains tax (a 1031 exchange can defer both). Figures are a year-1 estimate at your 24.0% rate — not tax advice; consult a CPA.
Schools (NCES district)
- District
- Paducah Independent
- NCES district ID
- 2104650
- Math proficiency
- 22% ▼ -14.00%
- Reading proficiency
- 36% ▼ -17.00%
- Median HH income
- $30,067
- Composite
- 23.41/100
- National rank
- #7896
- State rank
- #122 of 165 in KY
Livability — Paducah
- Score
- 68/100
- State rank
- #197
- US rank
- #9780
Category grades
Schools grade is shown separately in the Schools card above.
Census & demographics
- Census place
- Paducah, KY
- City population
- 30,856
- Population (ZIP)
- 29,384
Population outlook (McCracken County) Hauer SSP2
- Today (2025)
- 64,237 people
- By 2030
- 63,468 · -1.2%
- By 2040
- 61,221 · -4.7%
- By 2050
- 58,432 · -9.0%
- By 2075
- 52,668 · -18.0%
- By 2100
- 44,517 · -30.7%
Race, ethnicity, and origin ACS 2023
- Neighborhood character
- Predominantly White (83%)
- Race & ethnicity
- White 83% Black 9% Two or more races 5% Hispanic / Latino 4%
- Common ancestry
- Slovak 2% Lithuanian 1% Serbian 1%
- Foreign-born
- 2% · Canada
- Languages at home
- 97% English-only · Spanish 1% Other Asian/Pacific 1%
Political lean MEDSL · McCracken
- 2024 margin
- Solid R (+34.9) · D 31.9% · R 66.8% · Other 1.2%
- 2008→2024 swing
- -9.7pp toward R · 2008: -25.2pp · 2024: -34.9pp
- All cycles
- 2024: R+34.9 2020: R+31.7 2016: R+37.2 2012: R+32.5 2008: R+25.2
Not yet ingested
- Civics
- —
Market trends
- HPI YoY
- ▼ -58.31%
- Current HPI
- 236.3013
- Rent YoY
- —
- Metro
- —
- State GDP YoY
- ▲ 1.81%
- F500 in state
- 4
Industry mix (Fortune 500 HQ in KY)
| Industry | F500 HQs | Revenue |
|---|---|---|
| Healthcare | 1 | $118B |
|
||
| Food / Beverage | 1 | $7B |
|
||
Price history
+125.9% since first listed10 events — show timeline
- 2026-05-30 Listed $157,000 WKRMLS
- 2025-01-16 Sold (Public Records) $132,000 Public Records
- 2025-01-14 Sold (MLS) $132,000 WKRMLS
- 2024-12-12 Pending — WKRMLS
- 2024-11-04 Price Changed $135,000 WKRMLS
- 2024-10-25 Price Changed $144,900 WKRMLS
- 2024-09-13 Listed $159,900 WKRMLS
- 2015-10-23 Sold (MLS) $63,000 WKRMLS
- 2014-11-21 Listed $65,000 WKRMLS
- 2008-08-27 Sold (Public Records) $69,500 Public Records
Property tax history
-13.4%/yrLatest (2025): $310 · -0.8% YoY. Source: county tax records.
Cash-flow waterfall
monthlySold comps — $/sqft
last 12 mo · ≤1 miLoading sold comps…