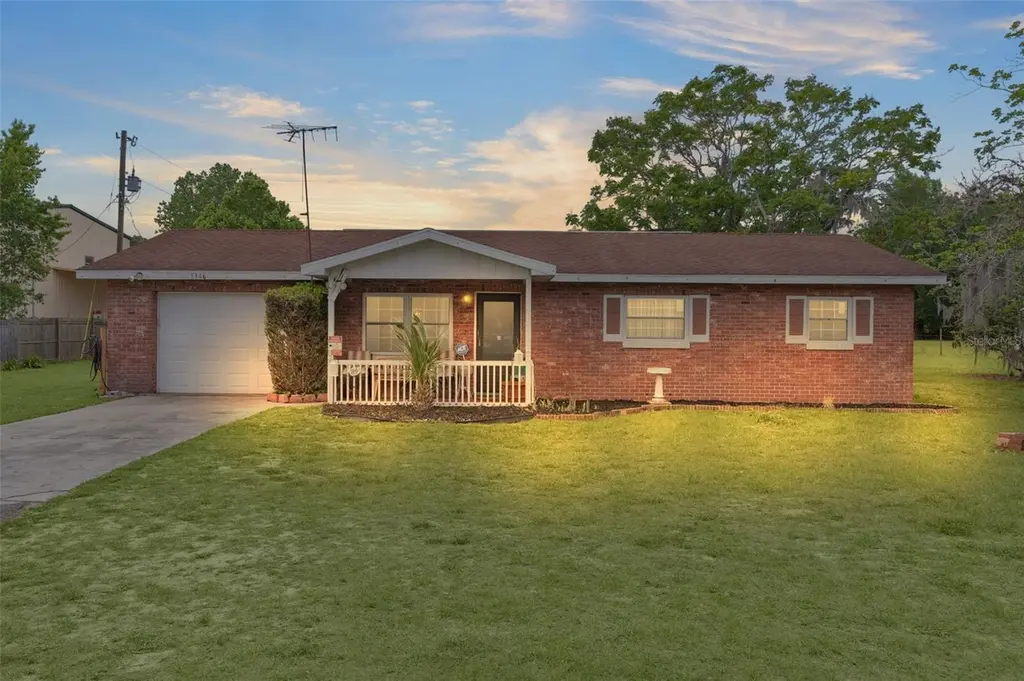
5946 SR 471 · Wildwood, FL
Flood risk 1/10 · Minimal
- FEMA flood zone
- X (unshaded)
- Chance of flooding over 30 yrs
- 0.0%
- Est. flood insurance / yr
- $507 – $1,088
Fire risk 6/10 · Moderate
- Est. fire insurance / yr
- $947 – $1,759
Heat risk 8/10 · Major
- Hot days now (above 108°F)
- 6 days/yr
- Hot days in 30 yrs
- 19 days/yr
Wind risk 9/10 · Severe
- Chance of severe wind over 30 yrs
- 99.0%
Air-quality risk 1/10 · Minimal
- Unhealthy air days now
- 0 days/yr
- Unhealthy air days in 30 yrs
- 0 days/yr
Risk factors via First Street. Map © Google.
Why this score? — see what drove the C grade
The composite is a weighted blend of 9 inputs, each scored 0–100. Each bar is that input's sub-score; the figure is the points it added to the 100-point composite (weight × sub-score).
- ARV discount +15.0/15.0
- Cash flow +13.3/30.0
- Appreciation +10.0/10.0
- Schools +5.2/10.0
- DSCR +4.0/10.0
- Livability +3.5/5.0
- 1% rule +2.5/10.0
- Rent growth +2.5/5.0
- Condition / age +2.5/5.0
$245,900
🖨 Deal sheet 📄 Offer letter ✓ Due diligence
Listing remarks
MEMORIES ARE WAITING TO BE MADE! This 3 bedroom, 2 bath home is situated on ONE ACRE! It is adorned in the back yard with several fruit bearing Pear Trees! This home offers 1148 Sq Ft of Living plus a One Car garage, a full bath off the Garage and a bonus room. The kitchen has a breakfast bar, a utility closet and a newer refrigerator. Storage is not an issue, with an included storage shed in the backyard. With booming growth in the area, this is an investment property worth strong consideration! Roof-2009, HWH-2026, HVAC 2008
Key facts
- Storage shed
- Utility closet
- Breakfast bar
Tags
Property features AI
Finance
- Other: Homestead exempt; Zoning: RR1; Contains one well and one septic; Living area (public records): 1,148 sq ft; Total building area: 1,612 sq ft
- HOA & community: No HOA/association indicated
Exterior
- Parking: Attached garage (1 car)
- Utilities: Electricity connected; Water connected; Septic tank; Water source: None listed
- Home design: Single family residence; Residential property; One story; Faces east
- Construction: Block construction; Shingle roof; Slab foundation; Built on a 1-acre lot
- Exterior features: Shed(s); Fruit trees; Paved road access; In county location
Interior
- Kitchen: Range; Refrigerator
- Bedrooms: 3 bedrooms
- Flooring: Carpet; Ceramic tile
- Bathrooms: 2 full bathrooms
- Heating & cooling: Central heating; Central air conditioning
- Interior features: Ceiling fans
- Laundry & utility: Laundry closet
Neighborhood map
What this means for you Summary
Snapshot
- This is a 3-bed/2.0-bath single-family listed at $246k.
Deal economics
- At list price, monthly cash flow is $1 ($8/yr) — positive.
- The deal already cash-flows at list — no discount required.
- To meet the 1% rule (rent ≥ 1% of price), the offer needs to be $184k (25.3% below list).
- Recommended offer: $184k (25.3% below list) — sets the bar for 1% rule.
- Cap rate 6.3% vs local median 3.9% in Wildwood — top-decile yield for the area; either an underpriced asset or a hidden risk that comps aren't pricing in. Stress-test before assuming the spread holds.
Location & tenants
- Location reads 69/100 on livability (#471 in FL) — a middle-class / working-renter tenant base. Strengths: health & safety A+, cost of living A, crime A-; Watch: schools C-, amenities F, commute F.
- Sumter (rural): math 61% / reading 61% proficiency, ranked #11 of 73 in FL (top 15%) — acceptable for families but not a draw, mixed tenant base, ~2y average lease.
- Market conditions: 97 active listings in the ZIP; 3,961 units permitted in Sumter County in 2024 (248 in 5+ unit buildings).
Forward outlook
- In year one you build about $26k of equity ($2k loan paydown + $25k appreciation (10.0% local appreciation)).
- Sumter County population projected at +45% by 2050 — long-run rental-demand tailwind backs the buy-and-hold thesis.
- At projected returns (10.0% appreciation + 3.0% rent growth), your $69k cash investment doubles in ~3 years — after that, you're playing with house money.
- By year 2, paydown + projected appreciation supports a ~$42k cash-out refi (75% LTV) — recoverable capital for the next deal without selling this one.
Negotiation context
- It's been on market 56 days — a 3% lower offer ($239k) is reasonable based on typical stale-listing flexibility.
Risks & watch-outs
- Climate carrying-cost: severe wind risk, 99% chance of damaging wind over 30y; major wildfire risk; extreme-heat days projected 6→19/yr by 2055 (HVAC capex compounding) — expect insurance premiums to compound above CPI over the hold.
Questions for the listing agent
- It's been on market 56 days. Have you received any prior offers? Is the seller open to a 25% concession, seller financing, or rate buy-down credit?
- Built in 1978 — when were the roof, HVAC, electrical panel, plumbing, and water heater last replaced?
- Is there a deadline driving the sale (1031 exchange, divorce, estate, relocation)? That informs how much negotiation room exists.
- What's the average days-on-market for RENTAL listings here right now (not sales)? A rising rental-DOM trend means longer vacancies and softer asking-rent achievability than the comps imply.
- What's the recent tenant-quality profile in this submarket — average credit score on applications, eviction rate, late-payment / NSF rate, and stable-employment percentage? A property-management company in the area should have these aggregated.
- How much new for-sale + rental construction is in the pipeline within 1–3 miles? Heavy new supply typically softens prices + rents 12–24 months out; constrained supply supports both.
Investment metrics
- 1% rule
- 0.75% ✗
- Cap rate
- 6.30%
- Cash-on-cash
- 0.01%
- DSCR
- 1.00
- GRM
- 11.2
CMA / ARV
- ARV (on-the-fly)
- $312,256
- Comps found
- 1
Show comp detail 1 sale within ~0.75 mi
| Address | Dist | Beds/Ba | Sqft | Sold | Price | $/sf | Match |
|---|---|---|---|---|---|---|---|
| 6075 SE 26th St | 0.36mi | 2/1.0 (-1) | 1,196 (+4%) | 23mo | $325,000 | $272 | 48 |
Match score weights: distance 35% · size 25% · config 20% · recency 20%. Top-matched comps best support the ARV.
Projected returns pro-forma
10.0% appreciation · 3.0% rent growth · sell at horizon
- IRR
- 24.3%
- Equity multiple
- 2.94×
- Total profit
- $133,843
- Equity at exit
- $221,526
- IRR
- 21.5%
- Equity multiple
- 6.72×
- Total profit
- $393,861
- Equity at exit
- $477,730
Cash invested: $68,852 (down + closing). Projections, not guarantees.
Landlord ↔ Tenant lean methodology
- Overall (STATE)
- 87 Strongly Landlord-Friendly
- State Florida
- 87 Strongly Landlord-Friendly · R+3
- County
- — inherits STATE
- City
- — inherits STATE
ZIP-level market 33513
- Home prices YoY
- 12.8%
- Active inventory
- 97
- Price-to-rent
- 11.2×
Monthly cashflow live
- Estimated rent
- $1,837 medium interval (Pro) →
- Mortgage (P&I)
- −$1,290
- Tax from tax record
- −$58 /mo · $698/yr
- Insurance
- −$102
- HOA
- −$0
- Vacancy / Maint / Mgmt
- −$386
- Net cashflow
- $1
Break-even live
UW: 25.0% down · 7.5% · 30yr · 1.5% tax · 5.0% vac · 8.0% maint · 8.0% mgmt
Financing live
Cash to close
- Down payment
- $61,475
- Closing costs
- $7,377
- Reserves months
- —
- Total cash needed
- —
Loan-product check · same deal, 3 products live
Conventional
25% down · 7.5% · 30yr
- Down + closing
- —
- Monthly P&I
- —
- Monthly cashflow
- —
- DSCR
- —
- Eligible?
- —
Personal DTI + credit; lowest rate.
DSCR
20% down · 8.5% · 30yr
- Down + closing
- —
- Monthly P&I
- —
- Monthly cashflow
- —
- DSCR
- —
- Eligible?
- —
No personal income docs; deal must DSCR.
Hard money
10% down · 12.0% · 12mo
- Down + closing
- —
- Monthly P&I
- —
- Monthly cashflow
- —
- DSCR
- —
- Eligible?
- —
Short-term bridge; refi at stabilization.
Listing history 17 events
-
2026-06-19days on market $245,900 Active 56 DOM
-
2026-06-18days on market $245,900 Active 55 DOM
-
2026-06-17price $245,900 Active 54 DOM
-
2026-06-17days on market $250,000 Active 54 DOM
-
2026-06-16days on market $250,000 Active 53 DOM
-
2026-06-15days on market $250,000 Active 52 DOM
-
2026-06-14days on market $250,000 Active 50 DOM
-
2026-06-13days on market $250,000 Active 49 DOM
-
2026-06-10days on market $250,000 Active 47 DOM
-
2026-06-09days on market $250,000 Active 46 DOM
-
2026-06-08days on market $250,000 Active 45 DOM
-
2026-06-07days on market $250,000 Active 44 DOM
-
2026-06-02days on market $250,000 Active 39 DOM
-
2026-06-01days on market $250,000 Active 38 DOM
-
2026-05-31days on market $250,000 Active 37 DOM
-
2026-05-30days on market $250,000 Active 36 DOM
-
2026-04-24$250,000 Active
ⓘ Source: listings_history table (triggers on properties + properties_extension) + one-shot
backfill from property_details.listing_events for pre-trigger history.
Tax reassessment forecast FL · Resets to sale price
- Current annual tax
- $698 · $58/mo
- Projected year-2 tax
- $2,041 · $170/mo
- Expected delta
- +$1,343/yr (+$112/mo · 192.4%)
ⓘ Screening estimate from a state-policy table — verify with the county assessor before closing.
Climate risk First Street
- Flood 1/10 Low FEMA zone X (unshaded) · 0% chance over 30 yrs
- Wildfire 6/10 Major
- Heat 8/10 Severe 6 d/yr ≥108°F today · 19 d/yr by 30 yrs out
- Wind 9/10 Extreme 99% chance of damaging wind over 30 yrs
- Air quality 1/10 Low 0 unhealthy d/yr today · 0 by 30 yrs out
Nearby sold comps map
Loading sold comps map…
Walkable amenities ~0.75 mi
Loading nearby amenities…
Taxation est. · year 1
- Rental income
- $22,038
- − Mortgage interest
- −$13,774
- − Property taxes
- −$698
- − Insurance
- −$1,230
- − Repairs & maintenance
- −$1,763
- − Management
- −$1,763
- − Depreciation
- −$7,153
- Taxable loss
- −$4,343
- Est. tax savings @ 24.0%
- +$1,042
- After-tax cash flow
- $1,051/yr
For passive investors: Depreciation is non-cash, so a rental often shows a tax loss while cash-flowing — sheltering income. Rental losses are passive: they offset passive income freely, and up to $25,000/yr can offset ordinary (W-2) income if you actively participate and your MAGI is under $100k (phasing out to $0 by $150k); unused losses carry forward. On sale, claimed depreciation is recaptured at up to 25%, and gains may owe capital-gains tax (a 1031 exchange can defer both). Figures are a year-1 estimate at your 24.0% rate — not tax advice; consult a CPA.
Schools (NCES district)
- District
- Sumter
- NCES district ID
- 1201800
- Math proficiency
- 61% ▼ -4.00%
- Reading proficiency
- 61% ▼ -2.00%
- Median HH income
- $48,240
- Composite
- 51.74/100
- National rank
- #1682
- State rank
- #11 of 73 in FL
Livability — Wildwood
- Score
- 69/100
- State rank
- #471
- US rank
- #8500
Category grades
Schools grade is shown separately in the Schools card above.
Census & demographics
- City population
- 21,568
- Population (ZIP)
- 13,647
Population outlook (Sumter County) Hauer SSP2
- Today (2025)
- 161,172 people
- By 2030
- 180,083 · +11.7%
- By 2040
- 209,892 · +30.2%
- By 2050
- 234,186 · +45.3%
- By 2075
- 284,602 · +76.6%
- By 2100
- 317,039 · +96.7%
Race, ethnicity, and origin ACS 2023
- Neighborhood character
- Predominantly White (74%)
- Race & ethnicity
- White 74% Black 11% Hispanic / Latino 10% Two or more races 4% Asian 1%
- Hispanic origin (detail)
- Mexican 4% Puerto Rican 3%
- Common ancestry
- Lithuanian 3% Serbian 3% Iranian 1%
- Foreign-born
- 2% · Canada, China
- Languages at home
- 92% English-only · Spanish 6% Chinese 1%
Political lean MEDSL · Sumter
- 2024 margin
- Solid R (+37.6) · D 30.9% · R 68.6%
- 2008→2024 swing
- -10.6pp toward R · 2008: -27.0pp · 2024: -37.6pp
- All cycles
- 2024: R+37.6 2020: R+36.1 2016: R+39.2 2012: R+34.9 2008: R+27.0
Not yet ingested
- Civics
- —
Market trends
- HPI YoY
- ▲ 40.29%
- Current HPI
- 354.5531
- Rent YoY
- —
- Metro
- —
- State GDP YoY
- ▲ 3.28%
- F500 in state
- 36
Industry mix (Fortune 500 HQ in FL)
| Industry | F500 HQs | Revenue |
|---|---|---|
| Industrial Technology | 2 | $29B |
|
||
| Insurance | 2 | $17B |
|
||
| Retail | 1 | $60B |
|
||
| Technology Distribution | 1 | $58B |
|
||
| Homebuilding | 1 | $35B |
|
||
| Technology Manufacturing | 1 | $35B |
|
||
Price history
1 event — show timeline
- 2026-04-24 Listed $250,000 Stellar MLS as Distributed by MLS Grid
Property tax history
+3.7%/yrLatest (2025): $698 · +2.6% YoY. Source: county tax records.
Cash-flow waterfall
monthlySold comps — $/sqft
last 12 mo · ≤1 miLoading sold comps…