 Multi-family
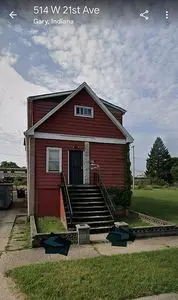
571 W 21st Ave · Gary, IN
Flood risk 1/10 · Minimal
- FEMA flood zone
- X (unshaded)
- Chance of flooding over 30 yrs
- 0.0%
- Est. flood insurance / yr
- $507 – $1,088
Fire risk 1/10 · Minimal
- Est. fire insurance / yr
- $717 – $1,331
Heat risk 3/10 · Minor
- Hot days now (above 102°F)
- 7 days/yr
- Hot days in 30 yrs
- 15 days/yr
Wind risk 2/10 · Minimal
- Chance of severe wind over 30 yrs
- 1.0%
Air-quality risk 4/10 · Minor
- Unhealthy air days now
- 6 days/yr
- Unhealthy air days in 30 yrs
- 7 days/yr
Risk factors via First Street. Map © Google.
Why this score? — see what drove the D+ grade
The composite is a weighted blend of 9 inputs, each scored 0–100. Each bar is that input's sub-score; the figure is the points it added to the 100-point composite (weight × sub-score).
- Cash flow +15.0/30.0
- ARV discount +7.5/15.0
- Appreciation +5.5/10.0
- 1% rule +5.0/10.0
- DSCR +5.0/10.0
- Livability +3.7/5.0
- Rent growth +2.5/5.0
- Condition / age +2.5/5.0
- Schools +0.5/10.0
$58,000
🖨 Deal sheet 📄 Offer letter ✓ Due diligence
Multi-family units
County records classify this as Multi-Family (2-4 Unit). Listing-text estimate: 1 unit. estimate disagrees with records
Listing remarks
& quot; & quot; This is an apartment building with 4 units. There are 3 three bedroom ad 1 two bedroom unit. this is a walkthrough on youtube of the exterior and inside as well https://youtube.com/shorts/afqrOhwdpuw?si=BqIgw-gPbVlqSD_u https://youtu. be/EkCXMIZEQDU?si=R-3BXXQWj_LlcraO & quot; & quot; & quot; & quot; & quot; & quot;
Key facts
- Built 1965
- Listed 37 days
Neighborhood map
What this means for you Summary
Snapshot
- This is a 6-bed/3.0-bath multifamily listed at $58k.
Deal economics
- At list price, monthly cash flow is $3k ($38k/yr) — positive.
- The deal already cash-flows at list — no discount required.
- Meets the 1% rule at list price ($5k rent vs $58k).
- Recommended offer: $56k (3.0% below list) — sets the bar for market timing.
- Cap rate 72.3% vs local median 9.1% in Gary — top-decile yield for the area; either an underpriced asset or a hidden risk that comps aren't pricing in. Stress-test before assuming the spread holds.
Location & tenants
- Location reads 73/100 on livability (#105 in IN) — a middle-class / working-renter tenant base. Strengths: commute A+, cost of living A+, housing A+; Watch: schools F, crime F, employment F.
- Gary Community School Corporation (urban): math 3% / reading 11% proficiency, ranked #299 of 301 in IN (top 99%) — low school quality limits family demand, transient renter base, plan for 1-2y turnover; 80% free/reduced lunch — lower-income household profile, screen leases tightly.
- Market conditions: 121 active listings in the ZIP; lower-income renter base — watch delinquency; 1,642 units permitted in Lake County in 2024 (14 in 5+ unit buildings).
- At $4,668/mo this rent would consume 196% of the median local household income ($29k/yr) (locally 392% of renters already pay >50% of income on rent) — very limited rent-growth headroom before tenants either downsize or default.
Forward outlook
- In year one you build about $969 of equity ($401 loan paydown + $568 appreciation (1.0% local appreciation)).
- Lake County population projected to shrink 7% by 2050 — rents likely to lag national; underwrite the cash flow, not the appreciation.
- At projected returns (1.0% appreciation + 3.0% rent growth), your $16k cash investment doubles in ~1 year — after that, you're playing with house money.
Negotiation context
- It's been on market 37 days — a 3% lower offer ($56k) is reasonable based on typical stale-listing flexibility.
Risks & watch-outs
- Watch-outs: property tax is 3.5% of price.
Questions for the listing agent
- It's been on market 37 days. Have you received any prior offers? Is the seller open to a 3% concession, seller financing, or rate buy-down credit?
- Built in 1965 — when were the roof, HVAC, electrical panel, plumbing, and water heater last replaced?
- Property tax is high relative to price — has the assessment been appealed recently, and will the sale trigger a re-assessment?
- Is there a deadline driving the sale (1031 exchange, divorce, estate, relocation)? That informs how much negotiation room exists.
- Schools are F-rated, which usually means shorter tenancies and higher turnover. Who's the typical renter profile here, and what's been the actual vacancy rate?
- Crime grade is F in this area — have there been break-ins, vandalism, or insurance claims at this property in the last 3 years? What carrier currently insures it and at what premium?
- The area grade is low — what's the realistic commute time and amenity access for the typical tenant pool here? Any planned neighborhood developments (good or bad) we should know about?
- What's the average days-on-market for RENTAL listings here right now (not sales)? A rising rental-DOM trend means longer vacancies and softer asking-rent achievability than the comps imply.
- What's the recent tenant-quality profile in this submarket — average credit score on applications, eviction rate, late-payment / NSF rate, and stable-employment percentage? A property-management company in the area should have these aggregated.
- How much new apartment / multifamily construction is in the pipeline within 1–3 miles? Heavy new supply (>2% of stock underway) typically softens rents 12–24 months out; light construction supports rent growth.
Investment metrics
- 1% rule
- 8.05% ✓
- Cap rate
- 72.32%
- Cash-on-cash
- 235.81%
- DSCR
- 11.49
- GRM
- 1.0
CMA / ARV
- ARV (on-the-fly)
- $213,616
- Comps found
- 1
Show comp detail 1 sale within ~0.75 mi
| Address | Dist | Beds/Ba | Sqft | Sold | Price | $/sf | Match |
|---|---|---|---|---|---|---|---|
| 1981 Massachusetts St | 0.44mi | 7/4.0 (+1) | 3,564 (-13%) | 20mo | $185,000 | $52 | 32 |
Match score weights: distance 35% · size 25% · config 20% · recency 20%. Top-matched comps best support the ARV.
Projected returns pro-forma
0.98% appreciation · 3.0% rent growth · sell at horizon
- IRR
- —
- Equity multiple
- 13.59×
- Total profit
- $204,414
- Equity at exit
- $19,739
- IRR
- —
- Equity multiple
- 28.78×
- Total profit
- $451,073
- Equity at exit
- $26,184
Cash invested: $16,240 (down + closing). Projections, not guarantees.
Landlord ↔ Tenant lean methodology
- Overall (STATE)
- 90 Strongly Landlord-Friendly
- State Indiana
- 90 Strongly Landlord-Friendly · R+11
- County
- — inherits STATE
- City
- — inherits STATE
ZIP-level market 46407
- Home prices YoY
- 0.4%
- Active inventory
- 121
- Price-to-rent
- 4.1×
Monthly cashflow live
- Estimated rent
- $4,668 high interval (Pro) →
- Mortgage (P&I)
- −$304
- Tax from tax record
- −$168 /mo · $2,017/yr
- Insurance
- −$24
- HOA
- −$0
- Vacancy / Maint / Mgmt
- −$980
- Net cashflow
- $3,191
Break-even live
4-unit breakdown (identical units grouped — click to expand)
| Units | Beds | Baths | Est. rent |
|---|---|---|---|
| 3× units | 3 | 1 | $3,561 |
| #1 | 3 | 1 | $1,187 |
| #2 | 3 | 1 | $1,187 |
| #3 | 3 | 1 | $1,187 |
| 1× unit | 2 | 1 | $1,106 |
| Total (4 units) | $4,668 | ||
UW: 25.0% down · 7.5% · 30yr · 1.5% tax · 5.0% vac · 8.0% maint · 8.0% mgmt
Financing live
Cash to close
- Down payment
- $14,500
- Closing costs
- $1,740
- Reserves months
- —
- Total cash needed
- —
Loan-product check · same deal, 3 products live
Conventional
25% down · 7.5% · 30yr
- Down + closing
- —
- Monthly P&I
- —
- Monthly cashflow
- —
- DSCR
- —
- Eligible?
- —
Personal DTI + credit; lowest rate.
DSCR
20% down · 8.5% · 30yr
- Down + closing
- —
- Monthly P&I
- —
- Monthly cashflow
- —
- DSCR
- —
- Eligible?
- —
No personal income docs; deal must DSCR.
Hard money
10% down · 12.0% · 12mo
- Down + closing
- —
- Monthly P&I
- —
- Monthly cashflow
- —
- DSCR
- —
- Eligible?
- —
Short-term bridge; refi at stabilization.
Listing history 15 events
-
2026-06-18days on market $58,000 Active 37 DOM
-
2026-06-17days on market $58,000 Active 36 DOM
-
2026-06-16days on market $58,000 Active 35 DOM
-
2026-06-15days on market $58,000 Active 34 DOM
-
2026-06-13days on market $58,000 Active 32 DOM
-
2026-06-13days on market $58,000 Active 31 DOM
-
2026-06-09days on market $58,000 Active 28 DOM
-
2026-06-08days on market $58,000 Active 27 DOM
-
2026-06-07days on market $58,000 Active 26 DOM
-
2026-06-04days on market $58,000 Active 23 DOM
-
2026-06-03days on market $58,000 Active 22 DOM
-
2026-06-02days on market $58,000 Active 21 DOM
-
2026-06-01days on market $58,000 Active 20 DOM
-
2026-05-31days on market $58,000 Active 19 DOM
-
2026-05-12$58,000 Active 323-char remark
ⓘ Source: listings_history table (triggers on properties + properties_extension) + one-shot
backfill from property_details.listing_events for pre-trigger history.
Tax reassessment forecast IN · Partial reset (capped growth)
- Current annual tax
- $2,017 · $168/mo
- Projected year-2 tax
- $2,017 · $168/mo
- Expected delta
- $0/yr ($0/mo · 0.0%)
ⓘ Screening estimate from a state-policy table — verify with the county assessor before closing.
Climate risk First Street
- Flood 1/10 Low FEMA zone X (unshaded) · 0% chance over 30 yrs
- Wildfire 1/10 Low
- Heat 3/10 Moderate 7 d/yr ≥102°F today · 15 d/yr by 30 yrs out
- Wind 2/10 Low 100% chance of damaging wind over 30 yrs
- Air quality 4/10 Moderate 6 unhealthy d/yr today · 7 by 30 yrs out
Nearby sold comps map
Loading sold comps map…
Walkable amenities ~0.75 mi
Loading nearby amenities…
Taxation est. · year 1
- Rental income
- $56,016
- − Mortgage interest
- −$3,249
- − Property taxes
- −$2,017
- − Insurance
- −$290
- − Repairs & maintenance
- −$4,481
- − Management
- −$4,481
- − Depreciation
- −$1,687
- Taxable income
- $39,811
- Est. tax owed @ 24.0%
- −$9,555
- After-tax cash flow
- $28,742/yr
For passive investors: Depreciation is non-cash, so a rental often shows a tax loss while cash-flowing — sheltering income. Rental losses are passive: they offset passive income freely, and up to $25,000/yr can offset ordinary (W-2) income if you actively participate and your MAGI is under $100k (phasing out to $0 by $150k); unused losses carry forward. On sale, claimed depreciation is recaptured at up to 25%, and gains may owe capital-gains tax (a 1031 exchange can defer both). Figures are a year-1 estimate at your 24.0% rate — not tax advice; consult a CPA.
Schools (NCES district)
- District
- Gary Community School Corporation
- NCES district ID
- 1803870
- Math proficiency
- 3% ▼ -10.00%
- Reading proficiency
- 11% ▼ -6.00%
- Median HH income
- $27,739
- Composite
- 4.98/100
- National rank
- #10039
- State rank
- #299 of 301 in IN
Livability — Gary
- Score
- 73/100
- State rank
- #105
- US rank
- #5592
Category grades
Schools grade is shown separately in the Schools card above.
Census & demographics
- Census place
- Gary, IN
- County
- Lake County · 422,878 people
- City population
- 63,701
- Metro
- Chicago-Naperville-Elgin, IL-IN-WI
- Population (ZIP)
- 8,577
- Household income
- $28,526
- Rent vs Own
- Severe rent burden
- 392.0
Population outlook (Lake County) Hauer SSP2
- Today (2025)
- 484,026 people
- By 2030
- 478,091 · -1.2%
- By 2040
- 462,974 · -4.3%
- By 2050
- 449,894 · -7.1%
- By 2075
- 436,169 · -9.9%
- By 2100
- 426,607 · -11.9%
Race, ethnicity, and origin ACS 2023
- Neighborhood character
- Predominantly Black (91%)
- Race & ethnicity
- Black 91% Hispanic / Latino 3% White 2% Two or more races 1%
- Common ancestry
- Romanian 1%
- Foreign-born
- 1% · Canada
- Languages at home
- 97% English-only · Spanish 1% Russian/Polish/Slavic 1% French/Haitian/Cajun 1%
Political lean MEDSL · Lake
- 2024 margin
- Lean D (+5.6) · D 52.1% · R 46.5% · Other 1.5%
- 2008→2024 swing
- -28.6pp toward R · 2008: 34.3pp · 2024: 5.6pp
- All cycles
- 2024: D+5.6 2020: D+15.1 2016: D+20.6 2012: D+31.0 2008: D+34.3
Not yet ingested
- Civics
- —
Market trends
- HPI YoY
- ▲ 0.98%
- Current HPI
- 253.2856
- Rent YoY
- —
- Metro
- Chicago-Naperville-Elgin, IL-IN-WI
- State GDP YoY
- ▲ 2.90%
- F500 in state
- 18
Industry mix (Fortune 500 HQ in IN)
| Industry | F500 HQs | Revenue |
|---|---|---|
| Industrial Machinery | 2 | $37B |
|
||
| Healthcare | 1 | $177B |
|
||
| Pharmaceuticals | 1 | $45B |
|
||
| Metals / Steel | 1 | $18B |
|
||
| Agriculture | 1 | $17B |
|
||
| Packaging | 1 | $12B |
|
||
Price history
1 event — show timeline
- 2026-05-12 Listed $58,000 FSBO.com
Property tax history
-7.6%/yrLatest (2024): $2,017 · +45.4% YoY. Source: county tax records.
Cash-flow waterfall
monthlySold comps — $/sqft
last 12 mo · ≤1 miLoading sold comps…