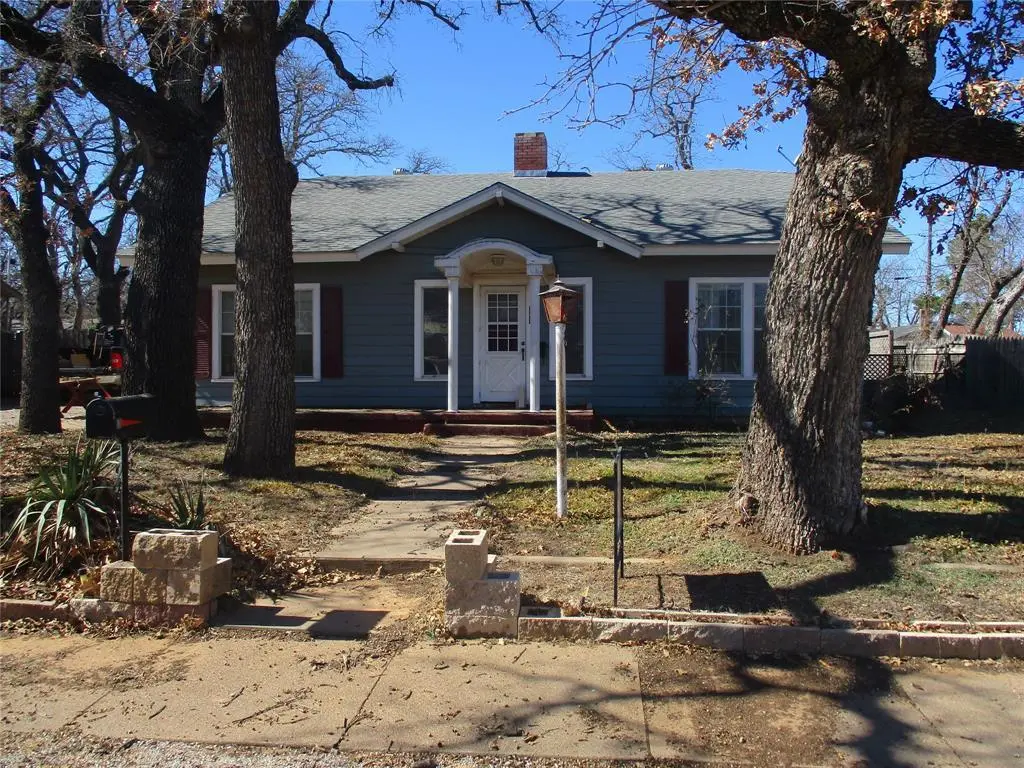
205 S Oaklawn · Eastland, TX
Flood risk 1/10 · Minimal
- FEMA flood zone
- X
- Chance of flooding over 30 yrs
- 0.0%
- Est. flood insurance / yr
- $507 – $1,088
Fire risk 5/10 · Moderate
- Est. fire insurance / yr
- $1,222 – $2,270
Heat risk 7/10 · Major
- Hot days now (above 106°F)
- 7 days/yr
- Hot days in 30 yrs
- 22 days/yr
Wind risk 4/10 · Minor
- Chance of severe wind over 30 yrs
- 19.0%
Air-quality risk 1/10 · Minimal
- Unhealthy air days now
- 0 days/yr
- Unhealthy air days in 30 yrs
- 0 days/yr
Risk factors via First Street. Map © Google.
Why this score? — see what drove the C grade
The composite is a weighted blend of 9 inputs, each scored 0–100. Each bar is that input's sub-score; the figure is the points it added to the 100-point composite (weight × sub-score).
- Cash flow +17.2/30.0
- ARV discount +15.0/15.0
- 1% rule +5.6/10.0
- DSCR +5.3/10.0
- Livability +3.8/5.0
- Schools +3.6/10.0
- Rent growth +2.5/5.0
- Condition / age +2.5/5.0
- Appreciation +0.0/10.0
$139,500
🖨 Deal sheet 📄 Offer letter ✓ Due diligence
Listing remarks MLS
Great Location for this Frame Home. Living Room with Fireplace, Large Kitchen that has Pantry, Utility Closet, Island. Den has Good View of Back Yard. 3 Bedrooms, Closets and Fans, Full Bath and Shower Bath. Detached Double Garage with Storage Room. Privacy Fenced!
Key facts
- Den has good view
- Large kitchen
- Utility closet
Tags
Neighborhood map
What this means for you Summary
Snapshot
- This is a 3-bed/1.0-bath single-family listed at $140k.
Deal economics
- At list price, monthly cash flow is $98 ($1k/yr) — positive.
- The deal already cash-flows at list — no discount required.
- Meets the 1% rule at list price ($1k rent vs $140k).
- Recommended offer: $123k (12.0% below list) — sets the bar for market timing.
- Cap rate 7.1% vs local median 3.1% in Eastland — top-decile yield for the area; either an underpriced asset or a hidden risk that comps aren't pricing in. Stress-test before assuming the spread holds.
Location & tenants
- Location reads 76/100 on livability (#104 in TX, #3,483 nationally) — a middle-class / working-renter tenant base. Strengths: cost of living A+, housing A+, health & safety A+; Watch: schools D, amenities F, commute F.
- Eastland ISD (town): math 45% / reading 41% proficiency, ranked #349 of 826 in TX (top 42%) — families likely to look elsewhere, expect single-tenant / working-renter base with shorter leases.
- Market conditions: 84 active listings in the ZIP; 10 units permitted in Eastland County in 2024 (0 in 5+ unit buildings).
Forward outlook
- Local home prices are declining (-3.0%/yr); year-one equity from $964 of loan paydown is wiped out by about $4k of value loss. Plan a longer hold.
- Eastland County population projected at -14% by 2050 — secular population decline; favor cash flow + early exit over multi-decade hold.
Negotiation context
- It's been on market 133 days — a 12% lower offer ($123k) is reasonable based on typical stale-listing flexibility.
Risks & watch-outs
- Watch-outs: built in 1937 — expect roof / HVAC / electrical / plumbing capex.
- Climate carrying-cost: moderate wildfire risk; extreme-heat days projected 7→22/yr by 2055 (HVAC capex compounding) — expect insurance premiums to compound above CPI over the hold.
Questions for the listing agent
- It's been on market 133 days. Have you received any prior offers? Is the seller open to a 12% concession, seller financing, or rate buy-down credit?
- Built in 1937 — when were the roof, HVAC, electrical panel, plumbing, and water heater last replaced?
- Why hasn't it sold? Are there any deal-killer items the seller is aware of (foundation, flood, title, zoning, code violations)?
- Is there a deadline driving the sale (1031 exchange, divorce, estate, relocation)? That informs how much negotiation room exists.
- Schools are D-rated, which usually means shorter tenancies and higher turnover. Who's the typical renter profile here, and what's been the actual vacancy rate?
- What's the average days-on-market for RENTAL listings here right now (not sales)? A rising rental-DOM trend means longer vacancies and softer asking-rent achievability than the comps imply.
- What's the recent tenant-quality profile in this submarket — average credit score on applications, eviction rate, late-payment / NSF rate, and stable-employment percentage? A property-management company in the area should have these aggregated.
- How much new for-sale + rental construction is in the pipeline within 1–3 miles? Heavy new supply typically softens prices + rents 12–24 months out; constrained supply supports both.
Investment metrics
- 1% rule
- 1.06% ✓
- Cap rate
- 7.14%
- Cash-on-cash
- 3.02%
- DSCR
- 1.13
- GRM
- 7.9
CMA / ARV
- ARV (median comp)
- $234,810
- List price
- $139,500
- Delta
- -40.59%
- Verdict
- UNDERPRICED
- Comps
- 20 within 1.0 mi
Show comp detail 9 sales within ~0.75 mi
| Address | Dist | Beds/Ba | Sqft | Sold | Price | $/sf | Match |
|---|---|---|---|---|---|---|---|
| 401 S Hillcrest Ave | 0.11mi | 3/2.0 | 1,906 (-2%) | 1mo | $257,000 | $135 | 88 |
| 302 S Hillcrest Ave | 0.05mi | 3/2.0 | 1,876 (-3%) | 8mo | $235,000 | $125 | 82 |
| 201 S Hillcrest Ave | 0.07mi | 2/1.5 (-1) | 1,825 (-6%) | 2mo | $110,000 | $60 | 78 |
| 408 Crestwood Dr | 0.16mi | 3/2.0 | 2,077 (+7%) | 18mo | $260,000 | $125 | 62 |
| 209 S Virginia Ave | 0.07mi | 4/3.0 (+1) | 2,025 (+4%) | 19mo | $182,000 | $90 | 60 |
| 606 S College Ave | 0.59mi | 3/2.0 | 1,942 (+0%) | 11mo | $175,000 | $90 | 59 |
| 520 Crestwood Dr | 0.36mi | 3/2.0 | 1,730 (-11%) | 5mo | $280,725 | $162 | 58 |
| 514 S Hillcrest Ave | 0.23mi | 3/2.0 | 2,169 (+12%) | 19mo | $200,000 | $92 | 50 |
| 600 S College Ave | 0.56mi | 3/2.0 | 1,694 (-13%) | 1mo | $175,000 | $103 | 48 |
Match score weights: distance 35% · size 25% · config 20% · recency 20%. Top-matched comps best support the ARV.
Projected returns pro-forma
-3.0% appreciation · 3.0% rent growth · sell at horizon
- IRR
- -11.5%
- Equity multiple
- 0.58×
- Total profit
- $-16,253
- Equity at exit
- $20,800
- IRR
- -2.2%
- Equity multiple
- 0.85×
- Total profit
- $-5,735
- Equity at exit
- $12,061
Cash invested: $39,060 (down + closing). Projections, not guarantees.
Landlord ↔ Tenant lean methodology
- Overall (STATE)
- 87 Strongly Landlord-Friendly
- State Texas
- 87 Strongly Landlord-Friendly · R+5
- County
- — inherits STATE
- City
- — inherits STATE
ZIP-level market 76448
- Home prices YoY
- -21.7%
- Active inventory
- 84
- Price-to-rent
- 7.9×
Monthly cashflow live
- Estimated rent
- $1,476 medium interval (Pro) →
- Mortgage (P&I)
- −$732
- Tax from tax record
- −$278 /mo · $3,339/yr
- Insurance
- −$58
- HOA
- −$0
- Vacancy / Maint / Mgmt
- −$310
- Net cashflow
- $98
Break-even live
UW: 25.0% down · 7.5% · 30yr · 1.5% tax · 5.0% vac · 8.0% maint · 8.0% mgmt
Financing live
Cash to close
- Down payment
- $34,875
- Closing costs
- $4,185
- Reserves months
- —
- Total cash needed
- —
Loan-product check · same deal, 3 products live
Conventional
25% down · 7.5% · 30yr
- Down + closing
- —
- Monthly P&I
- —
- Monthly cashflow
- —
- DSCR
- —
- Eligible?
- —
Personal DTI + credit; lowest rate.
DSCR
20% down · 8.5% · 30yr
- Down + closing
- —
- Monthly P&I
- —
- Monthly cashflow
- —
- DSCR
- —
- Eligible?
- —
No personal income docs; deal must DSCR.
Hard money
10% down · 12.0% · 12mo
- Down + closing
- —
- Monthly P&I
- —
- Monthly cashflow
- —
- DSCR
- —
- Eligible?
- —
Short-term bridge; refi at stabilization.
Listing history 18 events
-
2026-06-18days on market $139,500 Active 133 DOM
-
2026-06-17days on market $139,500 Active 132 DOM
-
2026-06-16days on market $139,500 Active 131 DOM
-
2026-06-15days on market $139,500 Active 130 DOM
-
2026-06-13days on market $139,500 Active 128 DOM
-
2026-06-12days on market $139,500 Active 127 DOM
-
2026-06-09days on market $139,500 Active 124 DOM
-
2026-06-08days on market $139,500 Active 123 DOM
-
2026-06-08days on market $139,500 Active 122 DOM
-
2026-06-07days on market $139,500 Active 121 DOM
-
2026-06-03days on market $139,500 Active 118 DOM
-
2026-06-02days on market $139,500 Active 117 DOM
-
2026-06-01days on market $139,500 Active 116 DOM
-
2026-05-31days on market $139,500 Active 115 DOM
-
2026-04-10price $139,500 265-char remark
Show marketing remark (265 chars)
Great Location for this Frame Home. Living Room with Fireplace, Large Kitchen that has Pantry, Utility Closet, Island. Den has Good View of Back Yard. 3 Bedrooms, Closets and Fans, Full Bath and Shower Bath. Detached Double Garage with Storage Room. Privacy Fenced!
-
2026-02-05$154,900 Active 265-char remark
Show marketing remark (265 chars)
Great Location for this Frame Home. Living Room with Fireplace, Large Kitchen that has Pantry, Utility Closet, Island. Den has Good View of Back Yard. 3 Bedrooms, Closets and Fans, Full Bath and Shower Bath. Detached Double Garage with Storage Room. Privacy Fenced!
-
2020-09-02soldstatus
-
2018-04-18soldstatus
ⓘ Source: listings_history table (triggers on properties + properties_extension) + one-shot
backfill from property_details.listing_events for pre-trigger history.
Tax reassessment forecast TX · Resets to sale price
- Current annual tax
- $3,339 · $278/mo
- Projected year-2 tax
- $3,339 · $278/mo
- Expected delta
- $0/yr ($0/mo · -0.0%)
ⓘ Screening estimate from a state-policy table — verify with the county assessor before closing.
Climate risk First Street
- Flood 1/10 Low FEMA zone X · 0% chance over 30 yrs
- Wildfire 5/10 Major
- Heat 7/10 Severe 7 d/yr ≥106°F today · 22 d/yr by 30 yrs out
- Wind 4/10 Moderate 19% chance of damaging wind over 30 yrs
- Air quality 1/10 Low 0 unhealthy d/yr today · 0 by 30 yrs out
Nearby sold comps map
Loading sold comps map…
Walkable amenities ~0.75 mi
Loading nearby amenities…
Taxation est. · year 1
- Rental income
- $17,716
- − Mortgage interest
- −$7,814
- − Property taxes
- −$3,339
- − Insurance
- −$698
- − Repairs & maintenance
- −$1,417
- − Management
- −$1,417
- − Depreciation
- −$4,058
- Taxable loss
- −$1,027
- Est. tax savings @ 24.0%
- +$247
- After-tax cash flow
- $1,427/yr
For passive investors: Depreciation is non-cash, so a rental often shows a tax loss while cash-flowing — sheltering income. Rental losses are passive: they offset passive income freely, and up to $25,000/yr can offset ordinary (W-2) income if you actively participate and your MAGI is under $100k (phasing out to $0 by $150k); unused losses carry forward. On sale, claimed depreciation is recaptured at up to 25%, and gains may owe capital-gains tax (a 1031 exchange can defer both). Figures are a year-1 estimate at your 24.0% rate — not tax advice; consult a CPA.
Schools (NCES district)
- District
- Eastland ISD
- NCES district ID
- 4817960
- Math proficiency
- 45% ▼ -5.00%
- Reading proficiency
- 41% ▼ -8.00%
- Median HH income
- $35,347
- Composite
- 35.61/100
- National rank
- #4894
- State rank
- #349 of 826 in TX
Livability — Eastland
- Score
- 76/100
- State rank
- #104
- US rank
- #3483
Category grades
Schools grade is shown separately in the Schools card above.
Census & demographics
- Census place
- Eastland, TX
- Population (ZIP)
- 4,920
Population outlook (Eastland County) Hauer SSP2
- Today (2025)
- 17,433 people
- By 2030
- 16,908 · -3.0%
- By 2040
- 15,855 · -9.1%
- By 2050
- 14,906 · -14.5%
- By 2075
- 12,843 · -26.3%
- By 2100
- 10,344 · -40.7%
Race, ethnicity, and origin ACS 2023
- Neighborhood character
- Predominantly White (85%)
- Race & ethnicity
- White 85% Two or more races 11% Hispanic / Latino 10% Black 3% Native American 1%
- Hispanic origin (detail)
- Mexican 8%
- Common ancestry
- Italian 21% Slovak 2% Serbian 1%
- Foreign-born
- 5% · Canada
- Languages at home
- 92% English-only · Spanish 8%
Political lean MEDSL · Eastland
- 2024 margin
- Solid R (+77.5) · D 11.0% · R 88.5%
- 2008→2024 swing
- -17.6pp toward R · 2008: -59.8pp · 2024: -77.5pp
- All cycles
- 2024: R+77.5 2020: R+75.4 2016: R+75.4 2012: R+68.9 2008: R+59.8
Not yet ingested
- Civics
- —
Market trends
- HPI YoY
- ▼ -52.60%
- Current HPI
- 190.0993
- Rent YoY
- —
- Metro
- —
- State GDP YoY
- ▲ 3.95%
- F500 in state
- 110
Industry mix (Fortune 500 HQ in TX)
| Industry | F500 HQs | Revenue |
|---|---|---|
| Energy | 16 | $1,198B |
|
||
| Technology | 5 | $198B |
|
||
| Engineering / Construction | 4 | $72B |
|
||
| Energy Services | 3 | $60B |
|
||
| Utilities | 3 | $41B |
|
||
| Healthcare | 2 | $330B |
|
||
Price history
-9.9% since first listed4 events — show timeline
- 2026-04-10 Price Changed $139,500 NTREIS
- 2026-02-05 Listed $154,900 NTREIS
- 2020-09-02 Sold (Public Records) — Public Records
- 2018-04-18 Sold (Public Records) — Public Records
Property tax history
+5.3%/yrLatest (2025): $3,339 · -1.9% YoY. Source: county tax records.
Cash-flow waterfall
monthlySold comps — $/sqft
last 12 mo · ≤1 miLoading sold comps…