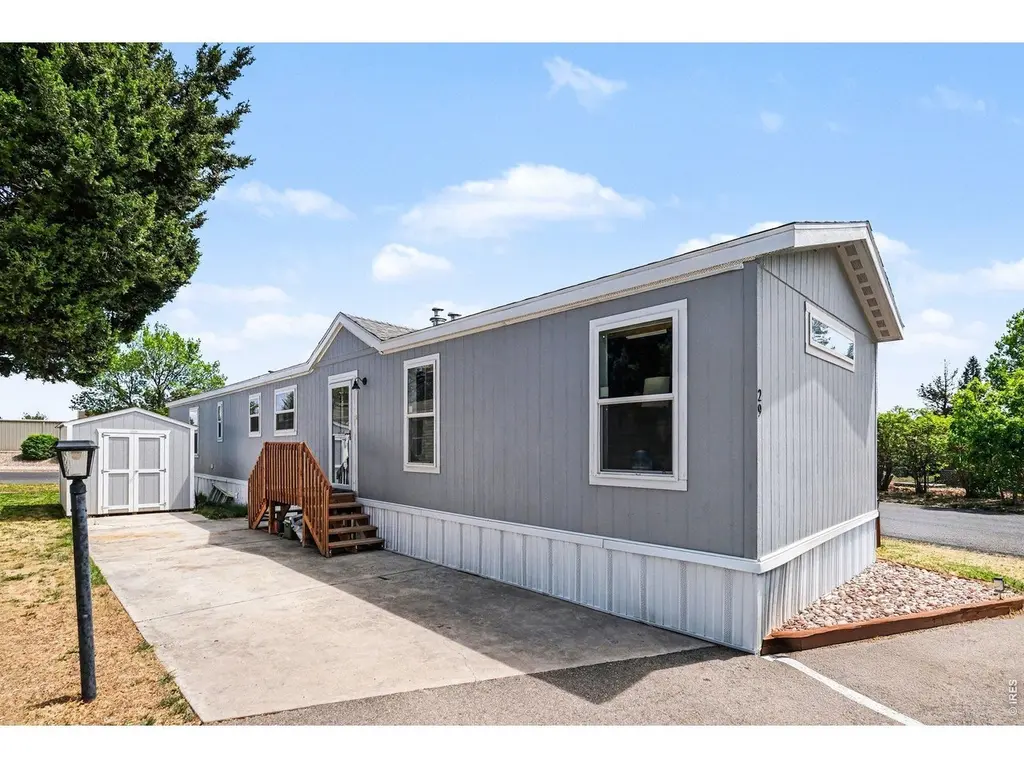
3109 E Mulberry St #29 · Fort Collins, CO
Flood risk 1/10 · Minimal
- FEMA flood zone
- X (unshaded)
- Chance of flooding over 30 yrs
- 0.0%
- Est. flood insurance / yr
- $507 – $1,088
Fire risk 5/10 · Moderate
- Est. fire insurance / yr
- $939 – $1,743
Heat risk 3/10 · Minor
- Hot days now (above 91°F)
- 7 days/yr
- Hot days in 30 yrs
- 18 days/yr
Wind risk 1/10 · Minimal
- Chance of severe wind over 30 yrs
- —
Air-quality risk 6/10 · Moderate
- Unhealthy air days now
- 13 days/yr
- Unhealthy air days in 30 yrs
- 13 days/yr
Risk factors via First Street. Map © Google.
Why this score? — see what drove the B+ grade
The composite is a weighted blend of 9 inputs, each scored 0–100. Each bar is that input's sub-score; the figure is the points it added to the 100-point composite (weight × sub-score).
- Cash flow +30.0/30.0
- ARV discount +13.1/15.0
- 1% rule +10.0/10.0
- DSCR +10.0/10.0
- Schools +4.5/10.0
- Livability +4.0/5.0
- Condition / age +4.0/5.0
- Rent growth +3.5/5.0
- Appreciation +0.0/10.0
$115,000
🖨 Deal sheet 📄 Offer letter ✓ Due diligence
Listing remarks
Welcome to this beautifully crafted 2022 home. Nestled in the back corner of a quiet, well-maintained community just outside of city limits! Designed with comfort and style in mind, this home showcases impressive attention to detail, including tape and textured walls, elegant crown molding, custom window cornices, and refined baseboards throughout. The thoughtfully designed open floor plan creates a seamless flow between the kitchen and living areas, filled with abundant natural light for a bright, airy atmosphere. With large bedrooms on either side of the home, you don't want to miss this one!The kitchen features a cleverly tucked-away laundry and pantry area, which maximizes both function
Key facts
- Built 2022
- Listed 51 days
Property features AI
Finance
- HOA & community: No association fees; No association transfer fee; No association reserves
Exterior
- Parking: No garage; No designated parking features
- Utilities: District water with meter installed; No water rights; Public sewer; Natural gas available (Xcel); Electricity available; Cable available; Satellite available; High-speed internet available; Park trash service (Waste Management)
- Home design: Manufactured in park (mobile home); House faces west; Corner lot; Level lot; Unincorporated location; Paved access; Private road to county standards; Fire hydrant within 500 feet; Minimal flood or C rating
- Construction: Composition construction; Composition roof
- Exterior features: Patio; Deck; Land lease; Storage
Interior
- Kitchen: Gas range; Dishwasher; Refrigerator
- Bedrooms: 3 bedrooms
- Bathrooms: 2 full bathrooms
- Heating & cooling: Forced air heating; Central air; Ceiling fan(s)
- Interior features: Eat-in kitchen; Open floorplan; Pantry; Walk-in closet(s); Window coverings; Fire alarm
Neighborhood map
What this means for you Summary
Snapshot
- This is a 2-bed/1.0-bath manufactured listed at $115k. Condition is rated good.
Deal economics
- At list price, monthly cash flow is $765 ($9k/yr) — positive.
- The deal already cash-flows at list — no discount required.
- Meets the 1% rule at list price ($2k rent vs $115k).
- Recommended offer: $112k (3.0% below list) — sets the bar for market timing.
- Cap rate 14.3% vs local median 2.6% in Fort Collins — top-decile yield for the area; either an underpriced asset or a hidden risk that comps aren't pricing in. Stress-test before assuming the spread holds.
Location & tenants
- Location reads 80/100 on livability (#11 in CO, #1,750 nationally) — a professional / high-income tenant draw. Strengths: amenities A+, commute A+, health & safety A+; Watch: cost of living F.
- Poudre School District R-1 (urban): math 45% / reading 60% proficiency, ranked #10 of 86 in CO (top 12%) — acceptable for families but not a draw, mixed tenant base, ~2y average lease.
- Zoned schools: Riffenburgh Elementary School (math 37% / reading 62%, grade D, #207 of 966 statewide, top 24%, 479 students, 23% FRL) — zoned schools at 23% FRL track the district average.
- Market conditions: Rents rising fast (+4.1%/yr); 422 active listings in the ZIP; 3 comparable units currently listed for rent nearby; rentals at typical pace (median 24d on market — plan ~3-4 weeks tenant-placement turnaround); solid renter incomes; 1,786 units permitted in Larimer County in 2024 (402 in 5+ unit buildings).
Forward outlook
- Local home prices are declining (-3.0%/yr); year-one equity from $795 of loan paydown is wiped out by about $3k of value loss. Plan a longer hold.
- Larimer County population projected at +51% by 2050 — long-run rental-demand tailwind backs the buy-and-hold thesis.
- At projected returns (-3.0% appreciation + 4.1% rent growth), your $32k cash investment doubles in ~5 years — after that, you're playing with house money.
Negotiation context
- It's been on market 51 days — a 3% lower offer ($112k) is reasonable based on typical stale-listing flexibility.
- 7 sale attempts since 10y ago with the ask held roughly flat each time — persistent listings suggest the price (not the market) is what's stuck; bring a comps-based counter.
Risks & watch-outs
- Climate carrying-cost: moderate wildfire risk — expect insurance premiums to compound above CPI over the hold.
Questions for the listing agent
- It's been on market 51 days. Have you received any prior offers? Is the seller open to a 3% concession, seller financing, or rate buy-down credit?
- Is there a deadline driving the sale (1031 exchange, divorce, estate, relocation)? That informs how much negotiation room exists.
- Schools are B-rated — typically a magnet for longer-tenancy family renters. What's the average tenant stay here, and is there a school-zone premium baked into asking?
- What's the average days-on-market for RENTAL listings here right now (not sales)? A rising rental-DOM trend means longer vacancies and softer asking-rent achievability than the comps imply.
- What's the recent tenant-quality profile in this submarket — average credit score on applications, eviction rate, late-payment / NSF rate, and stable-employment percentage? A property-management company in the area should have these aggregated.
- How much new for-sale + rental construction is in the pipeline within 1–3 miles? Heavy new supply typically softens prices + rents 12–24 months out; constrained supply supports both.
Investment metrics
- 1% rule
- 1.62% ✓
- Cap rate
- 14.28%
- Cash-on-cash
- 28.53%
- DSCR
- 2.27
- GRM
- 5.2
CMA / ARV
- ARV (on-the-fly)
- $131,328
- Comps found
- 6
Show comp detail 6 sales within ~0.75 mi
| Address | Dist | Beds/Ba | Sqft | Sold | Price | $/sf | Match |
|---|---|---|---|---|---|---|---|
| 3109 E Mulberry St #5 | 0.00mi | 3/2.0 (+1) | 1,216 (0%) | 16mo | $134,900 | $111 | 78 |
| 3109 E Mulberry St #30 | 0.00mi | 3/2.0 (+1) | 1,216 (0%) | 20mo | $120,000 | $99 | 74 |
| 3109 E Mulberry St #1 | 0.00mi | 3/2.0 (+1) | 1,088 (-10%) | 1mo | $107,000 | $98 | 73 |
| 3109 E Mullberry St | 0.00mi | 3/2.0 (+1) | 1,088 (-10%) | 1mo | $117,000 | $108 | 72 |
| 3109 E Mulberry St #24 | 0.02mi | 3/2.0 (+1) | 1,088 (-10%) | 1mo | $117,000 | $108 | 71 |
| 3109 E Mulberry St #10 | 0.01mi | 3/2.0 (+1) | 1,088 (-10%) | 13mo | $110,000 | $101 | 62 |
Match score weights: distance 35% · size 25% · config 20% · recency 20%. Top-matched comps best support the ARV.
Projected returns pro-forma
-3.0% appreciation · 4.13% rent growth · sell at horizon
- IRR
- 24.0%
- Equity multiple
- 2.00×
- Total profit
- $32,225
- Equity at exit
- $17,147
- IRR
- 32.5%
- Equity multiple
- 4.10×
- Total profit
- $99,696
- Equity at exit
- $9,943
Cash invested: $32,200 (down + closing). Projections, not guarantees.
Landlord ↔ Tenant lean methodology
- Overall (STATE)
- 38 Tenant-Leaning
- State Colorado
- 38 Tenant-Leaning · D+4
- County
- — inherits STATE
- City
- — inherits STATE
ZIP-level market 80524
- Rents YoY
- 4.1%
- Active inventory
- 422
- Price-to-rent
- 5.2×
Monthly cashflow live
- Estimated rent
- $1,859 medium interval (Pro) →
- Mortgage (P&I)
- −$603
- Tax from tax record
- −$52 /mo · $627/yr
- Insurance
- −$48
- HOA
- −$0
- Vacancy / Maint / Mgmt
- −$390
- Net cashflow
- $765
Break-even live
UW: 25.0% down · 7.5% · 30yr · 1.5% tax · 5.0% vac · 8.0% maint · 8.0% mgmt
Financing live
Cash to close
- Down payment
- $28,750
- Closing costs
- $3,450
- Reserves months
- —
- Total cash needed
- —
Loan-product check · same deal, 3 products live
Conventional
25% down · 7.5% · 30yr
- Down + closing
- —
- Monthly P&I
- —
- Monthly cashflow
- —
- DSCR
- —
- Eligible?
- —
Personal DTI + credit; lowest rate.
DSCR
20% down · 8.5% · 30yr
- Down + closing
- —
- Monthly P&I
- —
- Monthly cashflow
- —
- DSCR
- —
- Eligible?
- —
No personal income docs; deal must DSCR.
Hard money
10% down · 12.0% · 12mo
- Down + closing
- —
- Monthly P&I
- —
- Monthly cashflow
- —
- DSCR
- —
- Eligible?
- —
Short-term bridge; refi at stabilization.
Rent comps 3 comps
| Address | Beds | Baths | Sqft | Rent | $/sqft | DOM | Units | Dist |
|---|---|---|---|---|---|---|---|---|
| 739 Riverbend Dr Unit Shop Fort Collins, CO | 1.0 | 1.0 | 1200 | $1,525 | $1.27 | 23d | 1 | 0.25mi |
| 3210 Sykes Dr Fort Collins, CO | 3.0 | 2.5 | 1485 | $2,700 | $1.82 | 13d | 1 | 0.82mi |
| 802 Waterglen Dr Fort Collins, CO | 3.0 | 2.5 | 1285 | $2,075 | $1.61 | 23d | 2 | 1.39mi |
Listing history 37 events
-
2026-06-18days on market $115,000 Active 51 DOM
-
2026-06-17days on market $115,000 Active 50 DOM
-
2026-06-16days on market $115,000 Active 49 DOM
-
2026-06-15days on market $115,000 Active 48 DOM
-
2026-06-14days on market $115,000 Active 46 DOM
-
2026-06-10days on market $115,000 Active 43 DOM
-
2026-06-09days on market $115,000 Active 42 DOM
-
2026-06-08days on market $115,000 Active 41 DOM
-
2026-06-07days on market $115,000 Active 40 DOM
-
2026-06-03days on market $115,000 Active 36 DOM
-
2026-06-02days on market $115,000 Active 35 DOM
-
2026-06-01days on market $115,000 Active 34 DOM
-
2026-05-31days on market $115,000 Active 33 DOM
-
2026-05-30days on market $115,000 Active 32 DOM
-
2026-04-27$115,000 Active
-
2026-04-23historical
-
2026-04-01price $129,900
-
2026-03-21price $139,900
-
2026-03-09price $144,500
-
2025-10-02$145,000 Active
-
2025-10-01historical
-
2025-09-26historical
-
2025-03-28$145,000 Active
-
2024-12-09soldstatus $145,000 Sold
-
2024-11-09status Pending
-
2024-10-04$145,000 Active
-
2024-10-04$145,000 Active
-
2024-10-04historical
-
2022-09-02soldstatus $145,000 Sold
-
2022-09-01historical
-
2022-08-29status Pending
-
2022-06-27price $154,900
-
2022-05-23price $149,900
-
2022-05-13price $162,500
-
2022-05-09$150,000 Active
-
2016-12-22soldstatus $12,000 Sold
-
2016-10-24$29,000 Active
ⓘ Source: listings_history table (triggers on properties + properties_extension) + one-shot
backfill from property_details.listing_events for pre-trigger history.
Tax reassessment forecast CO · Resets to sale price
- Current annual tax
- $627 · $52/mo
- Projected year-2 tax
- $632 · $53/mo
- Expected delta
- +$5/yr ($0/mo · 0.9%)
ⓘ Screening estimate from a state-policy table — verify with the county assessor before closing.
Climate risk First Street
- Flood 1/10 Low FEMA zone X (unshaded) · 0% chance over 30 yrs
- Wildfire 5/10 Major
- Heat 3/10 Moderate 7 d/yr ≥91°F today · 18 d/yr by 30 yrs out
- Wind 1/10 Low
- Air quality 6/10 Major 13 unhealthy d/yr today · 13 by 30 yrs out
Nearby sold comps map
Loading sold comps map…
Walkable amenities ~0.75 mi
Loading nearby amenities…
Taxation est. · year 1
- Rental income
- $22,309
- − Mortgage interest
- −$6,442
- − Property taxes
- −$627
- − Insurance
- −$575
- − Repairs & maintenance
- −$1,785
- − Management
- −$1,785
- − Depreciation
- −$3,345
- Taxable income
- $7,750
- Est. tax owed @ 24.0%
- −$1,860
- After-tax cash flow
- $7,325/yr
For passive investors: Depreciation is non-cash, so a rental often shows a tax loss while cash-flowing — sheltering income. Rental losses are passive: they offset passive income freely, and up to $25,000/yr can offset ordinary (W-2) income if you actively participate and your MAGI is under $100k (phasing out to $0 by $150k); unused losses carry forward. On sale, claimed depreciation is recaptured at up to 25%, and gains may owe capital-gains tax (a 1031 exchange can defer both). Figures are a year-1 estimate at your 24.0% rate — not tax advice; consult a CPA.
Condition & rehab AI · 12 photos
This 2022 manufactured home is in excellent condition with a good condition score of 80. It features modern appliances, marble countertops, hardwood floors, and fresh paint. The home is move-in ready with minimal repairs and maintenance needed.
Value-add opportunities
- Both Painting exterior and interior walls — Fresh paint can enhance curb appeal and interior aesthetics
- Both Landscaping and curb appeal improvements — A well-maintained yard and landscaping can increase both resale and rental value
Renovation cost estimate screening
Value-add ROI direction
- Both Painting exterior and interior walls — Fresh paint can enhance curb appeal and interior aesthetics ↑
- Both Landscaping and curb appeal improvements — A well-maintained yard and landscaping can increase both resale and rental value ↑
ⓘ Cost ranges are severity-bucket heuristics (US national rule-of-thumb). Get contractor quotes + a written scope before underwriting a rehab budget.
Schools (NCES district)
- District
- Poudre School District R-1
- NCES district ID
- 0803990
- Math proficiency
- 45% ▼ -7.00%
- Reading proficiency
- 60% ▼ -2.00%
- Median HH income
- $57,281
- Composite
- 45.5/100
- National rank
- #2610
- State rank
- #10 of 86 in CO
Livability — Fort Collins
- Score
- 80/100
- State rank
- #11
- US rank
- #1750
Category grades
Schools grade is shown separately in the Schools card above.
Census & demographics
- County
- Larimer County · 338,255 people
- City population
- 202,303
- Metro
- Fort Collins, CO
- Population (ZIP)
- 40,030
- Household income
- $85,035
- Rent vs Own
- Severe rent burden
- 1860.0
Population outlook (Larimer County) Hauer SSP2
- Today (2025)
- 415,361 people
- By 2030
- 457,762 · +10.2%
- By 2040
- 542,310 · +30.6%
- By 2050
- 627,048 · +51.0%
- By 2075
- 833,722 · +100.7%
- By 2100
- 952,590 · +129.3%
Race, ethnicity, and origin ACS 2023
- Neighborhood character
- Predominantly White (77%)
- Race & ethnicity
- White 77% Hispanic / Latino 17% Two or more races 11% Asian 1% Native American 1%
- Hispanic origin (detail)
- Mexican 13%
- Common ancestry
- Slovak 3% Portuguese 3% Italian 3%
- Foreign-born
- 8% · Canada
- Languages at home
- 88% English-only · Spanish 10% German/W. Germanic 1%
Political lean MEDSL · Larimer
- 2024 margin
- D (+17.6) · D 57.4% · R 39.8% · Other 2.9%
- 2008→2024 swing
- +7.9pp toward D · 2008: 9.7pp · 2024: 17.6pp
- All cycles
- 2024: D+17.6 2020: D+15.4 2016: D+4.9 2012: D+5.2 2008: D+9.7
Not yet ingested
- Civics
- —
Market trends
- HPI YoY
- ▼ -581.67%
- Current HPI
- 274.4026
- Rent YoY
- ▲ 4.13%
- Metro
- Fort Collins, CO
- State GDP YoY
- ▲ 1.95%
- F500 in state
- 14
Industry mix (Fortune 500 HQ in CO)
| Industry | F500 HQs | Revenue |
|---|---|---|
| Technology Distribution | 1 | $31B |
|
||
| Food / Agriculture | 1 | $18B |
|
||
| Packaging | 1 | $14B |
|
||
| Healthcare | 1 | $13B |
|
||
| Energy | 1 | $10B |
|
||
| Technology | 1 | $4B |
|
||
Price history
+296.6% since first listed23 events — show timeline
- 2026-04-27 Listed $115,000 IRES
- 2026-04-23 Listing Removed — IRES
- 2026-04-01 Price Changed $129,900 IRES
- 2026-03-21 Price Changed $139,900 IRES
- 2026-03-09 Price Changed $144,500 IRES
- 2025-10-02 Listed $145,000 IRES
- 2025-10-01 Coming Soon — IRES
- 2025-09-26 Listing Removed — IRES
- 2025-03-28 Listed $145,000 IRES
- 2024-12-09 Sold (MLS) $145,000 IRES
- 2024-11-09 Pending — IRES
- 2024-10-04 Listing Removed — IRES
- 2024-10-04 Listed $145,000 IRES
- 2024-10-04 Listed $145,000 IRES
- 2022-09-02 Sold (MLS) $145,000 IRES
- 2022-09-01 Listing Removed — IRES
- 2022-08-29 Pending — IRES
- 2022-06-27 Price Changed $154,900 IRES
- 2022-05-23 Price Changed $149,900 IRES
- 2022-05-13 Price Changed $162,500 IRES
- 2022-05-09 Listed $150,000 IRES
- 2016-12-22 Sold (MLS) $12,000 IRES
- 2016-10-24 Listed $29,000 IRES
Property tax history
+160.3%/yrLatest (2025): $627 · +484.9% YoY. Source: county tax records.
Cash-flow waterfall
monthlySold comps — $/sqft
last 12 mo · ≤1 miLoading sold comps…