 🏗️ New Construction
27243 Wheat Falls Ln · Houston, TX
Flood risk No data
- FEMA flood zone
- —
- Chance of flooding over 30 yrs
- —
- Est. flood insurance / yr
- —
Fire risk No data
- Est. fire insurance / yr
- —
Heat risk No data
- Hot days now (above threshold)
- —
- Hot days in 30 yrs
- —
Wind risk No data
- Chance of severe wind over 30 yrs
- —
Air-quality risk No data
- Unhealthy air days now
- —
- Unhealthy air days in 30 yrs
- —
Risk factors via First Street. Map © Google.
Why this score? — see what drove the F grade
The composite is a weighted blend of 9 inputs, each scored 0–100. Each bar is that input's sub-score; the figure is the points it added to the 100-point composite (weight × sub-score).
- ARV discount +7.5/15.0
- Cash flow +6.9/30.0
- Condition / age +5.0/5.0
- Livability +3.7/5.0
- Schools +2.9/10.0
- 1% rule +2.2/10.0
- Rent growth +2.1/5.0
- DSCR +1.1/10.0
- Appreciation +0.0/10.0
$272,240
🖨 Deal sheet (PDF) 📄 Offer letter ✓ Due diligence
Listing remarks
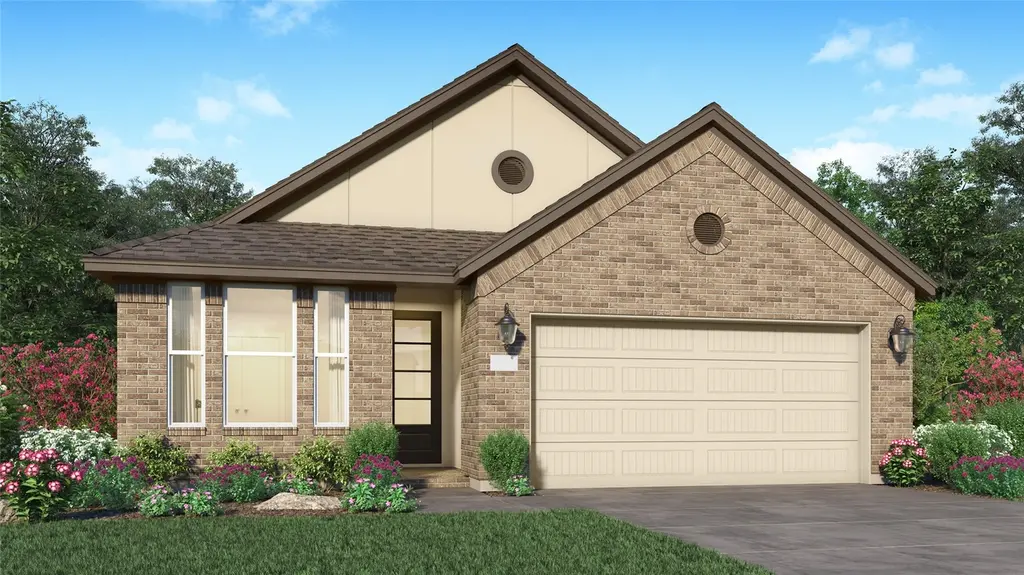
The Beckham Floor Plan - This single-story home has everything growing families need with three bedrooms in total and an open concept living area. Two bedrooms share a hall bathroom at the front of the home, while down the hall is the family room, kitchen and dining room with access to the back porch. Tucked into the back corner is the owner’s suite, which has a private bathroom and walk-in closet. The completion date, prices and features may vary and are subject to change. Please verify with Lennar directly. Photos are for illustrative purposes only.
Key facts
- Walk-in closet
- Back porch
- Private bathroom
Tags
Property features AI
Finance
- HOA & community: CCMC community; Annual association fee of $1,200; Community amenities include playground, park, pool, and trails
Exterior
- Parking: Attached garage with 2 spaces
- Utilities: Public water; Public sewer
- Home design: Residential property; Under construction (new construction); Slab foundation
- Construction: Built in 2026; Brick and stucco construction; Composition roof
- Exterior features: Back yard fence; Subdivision lot with pond on lot; Association pool
Interior
- Kitchen: Dishwasher; Electric oven; Electric range; Gas oven; Gas range
- Bedrooms: Primary bedroom on first floor (approx. 15 x 14); Additional bedrooms on first floor (approx. 11 x 10; 9 x 11)
- Flooring: Carpet; Vinyl
- Bathrooms: 2 full bathrooms
- Heating & cooling: Central heating (electric and gas); Central air conditioning (electric and gas)
- Interior features: Breakfast bar; Double vanity; Kitchen open to family room; Separate shower; Tub/shower combo
- Laundry & utility: Washer hookup; Electric dryer hookup; Gas dryer hookup
Neighborhood map
What this means for you Summary
Snapshot
- This is a 3-bed/2.0-bath single-family listed at $272k. Condition is rated excellent.
Deal economics
- At list price, monthly cash flow is $-479 ($-6k/yr) — negative.
- To cash-flow at today's rent, offer at most $243k (10.6% below list).
- To meet the 1% rule (rent ≥ 1% of price), the offer needs to be $226k (17.2% below list).
- Recommended offer: $226k (17.2% below list) — sets the bar for 1% rule.
- Cap rate 4.5% vs local median 3.2% in Houston — top-decile yield for the area; either an underpriced asset or a hidden risk that comps aren't pricing in. Stress-test before assuming the spread holds.
Location & tenants
- Location reads 74/100 on livability (#184 in TX, #4,771 nationally) — a middle-class / working-renter tenant base. Strengths: amenities A+, cost of living A+, housing A+; Watch: crime F.
- Waller ISD (rural): math 30% / reading 35% proficiency, ranked #532 of 826 in TX (top 64%) — families likely to look elsewhere, expect single-tenant / working-renter base with shorter leases.
- Zoned schools: I T Holleman El (math 33% / reading 31%, grade F, #2,268 of 4,322 statewide, top 55%, 688 students, 70% FRL); Waller J H (math 21% / reading 28%, grade F, #1,279 of 1,662 statewide, top 78%, 899 students, 69% FRL); Waller H S (math 25% / reading 40%, grade F, #1,029 of 1,632 statewide, top 64%, 2,639 students, 62% FRL).
- Market conditions: Rents soft (-1.6%/yr); 1791 active listings in the ZIP; 3 comparable units currently listed for rent nearby; rentals lingering (median 46d on market — plan ~5-8 weeks vacancy on turnover, expect pricing pressure); 67% of comp listings sitting > 30 days — soft ceiling on asking rent; high-income renter base; 29,883 units permitted in Harris County in 2024 (8,621 in 5+ unit buildings).
Forward outlook
- Local home prices are declining (-3.0%/yr); year-one equity from $2k of loan paydown is wiped out by about $9k of value loss. Plan a longer hold.
- Harris County population projected at +47% by 2050 — long-run rental-demand tailwind backs the buy-and-hold thesis.
Negotiation context
- It's been on market 22 days — a 2% lower offer ($268k) is reasonable based on typical stale-listing flexibility.
Questions for the listing agent
- What do current leases actually rent for vs. the listed asking? Can we see a recent rent roll and the last 12 months of T-12 income?
- What does the HOA fee cover, when was the last increase, and are there any pending special assessments or reserve-fund shortfalls?
- Is there a deadline driving the sale (1031 exchange, divorce, estate, relocation)? That informs how much negotiation room exists.
- Schools are D-rated, which usually means shorter tenancies and higher turnover. Who's the typical renter profile here, and what's been the actual vacancy rate?
- Crime grade is F in this area — have there been break-ins, vandalism, or insurance claims at this property in the last 3 years? What carrier currently insures it and at what premium?
- The area grade is low — what's the realistic commute time and amenity access for the typical tenant pool here? Any planned neighborhood developments (good or bad) we should know about?
- What's the average days-on-market for RENTAL listings here right now (not sales)? A rising rental-DOM trend means longer vacancies and softer asking-rent achievability than the comps imply.
- What's the recent tenant-quality profile in this submarket — average credit score on applications, eviction rate, late-payment / NSF rate, and stable-employment percentage? A property-management company in the area should have these aggregated.
- How much new for-sale + rental construction is in the pipeline within 1–3 miles? Heavy new supply typically softens prices + rents 12–24 months out; constrained supply supports both.
Investment metrics
- 1% rule
- 0.72% ✗
- Cap rate
- 4.46%
- Cash-on-cash
- -6.56%
- DSCR
- 0.71
- GRM
- 11.6
CMA / ARV
- ARV (median comp)
- $312,607
- List price
- $272,240
- Delta
- -12.91%
- Verdict
- UNDERPRICED
- Comps
- 20 within 1.0 mi
Show comp detail 12 sales within ~0.75 mi
| Address | Dist | Beds/Ba | Sqft | Sold | Price | $/sf | Match |
|---|---|---|---|---|---|---|---|
| 27242 Wheat Falls Ln | 0.01mi | 3/2.0 | 1,908 (+6%) | 0mo | $281,640 | $148 | 89 |
| 28911 Rustic Robin Ln | 0.32mi | 3/2.0 | 1,880 (+5%) | 0mo | $298,990 | $159 | 77 |
| 28803 Golden Wheat Ct | 0.37mi | 4/2.0 (+1) | 1,776 (-1%) | 1mo | $275,440 | $155 | 76 |
| 16122 Domestic Dove Way | 0.47mi | 4/2.0 (+1) | 1,776 (-1%) | 0mo | $250,990 | $141 | 72 |
| 16311 Golden Corral Dr | 0.51mi | 3/2.5 | 1,749 (-2%) | 1mo | $326,990 | $187 | 69 |
| 16850 Old Wagon Way | 0.34mi | 4/2.0 (+1) | 1,670 (-7%) | 1mo | $286,990 | $172 | 67 |
| 28518 Golden Hay Dr | 0.34mi | 4/2.0 (+1) | 1,670 (-7%) | 1mo | $241,140 | $144 | 67 |
| 28538 Golden Hay Dr | 0.33mi | 4/2.0 (+1) | 1,644 (-8%) | 1mo | $291,990 | $178 | 65 |
| 28807 Golden Wheat Ct | 0.37mi | 4/2.0 (+1) | 1,924 (+7%) | 1mo | $259,990 | $135 | 65 |
| 28514 Golden Hay Dr | 0.34mi | 4/2.0 (+1) | 1,644 (-8%) | 1mo | $282,990 | $172 | 64 |
| 16303 Golden Corral Ln | 0.52mi | 4/2.0 (+1) | 1,655 (-8%) | 1mo | $332,990 | $201 | 57 |
| 16307 Golden Corral Ln | 0.52mi | 3/2.0 | 1,572 (-12%) | 1mo | $303,990 | $193 | 55 |
Match score weights: distance 35% · size 25% · config 20% · recency 20%. Top-matched comps best support the ARV.
Projected returns pro-forma
-3.0% appreciation · 0.0% rent growth · sell at horizon
- IRR
- -31.2%
- Equity multiple
- -0.00×
- Total profit
- $-87,649
- Equity at exit
- $46,611
- IRR
- -56.3%
- Equity multiple
- -0.61×
- Total profit
- $-140,726
- Equity at exit
- $27,029
Cash invested: $87,530 (down + closing). Projections, not guarantees.
Landlord ↔ Tenant lean methodology
- Overall (STATE)
- 87 Strongly Landlord-Friendly
- State Texas
- 87 Strongly Landlord-Friendly · R+5
- County
- — inherits STATE
- City
- — inherits STATE
ZIP-level market 77447
- Home prices YoY
- -31.1%
- Rents YoY
- -1.6%
- Active inventory
- 1791
- Price-to-rent
- 10.1×
Monthly cashflow live
- Estimated rent
- $2,255 medium interval (Pro) →
- Mortgage (P&I)
- −$1,639
- Tax est. 1.5%
- −$391 /mo · $4,689/yr
- Insurance
- −$130
- HOA
- −$100
- Vacancy / Maint / Mgmt
- −$474
- Net cashflow
- $-479
Break-even live
Sensitivity live
| Price | -10% $-263 | -5% $-371 | +0% $-479 | +5% $-587 | +10% $-695 |
|---|---|---|---|---|---|
| Rent | -10% $-657 | -5% $-568 | +0% $-479 | +5% $-389 | +10% $-300 |
| Rate | -1.0pp $-321 | -0.5pp $-399 | base $-479 | +0.5pp $-560 | +1.0pp $-642 |
UW: 25.0% down · 7.5% · 30yr · 1.5% tax · 5.0% vac · 8.0% maint · 8.0% mgmt
Financing live
Cash to close
- Down payment
- $78,152
- Closing costs
- $9,378
- Reserves months
- —
- Total cash needed
- —
Loan-product check · same deal, 3 products live
Conventional
25% down · 7.5% · 30yr
- Down + closing
- —
- Monthly P&I
- —
- Monthly cashflow
- —
- DSCR
- —
- Eligible?
- —
Personal DTI + credit; lowest rate.
DSCR
20% down · 8.5% · 30yr
- Down + closing
- —
- Monthly P&I
- —
- Monthly cashflow
- —
- DSCR
- —
- Eligible?
- —
No personal income docs; deal must DSCR.
Hard money
10% down · 12.0% · 12mo
- Down + closing
- —
- Monthly P&I
- —
- Monthly cashflow
- —
- DSCR
- —
- Eligible?
- —
Short-term bridge; refi at stabilization.
Rent comps 3 comps
| Address | Beds | Baths | Sqft | Rent | $/sqft | DOM | Units | Dist |
|---|---|---|---|---|---|---|---|---|
| 16722 Old Wagon Way Hockley, TX | 4.0 | 2.0 | 1880 | $1,790 | $0.95 | 45d | 1 | 0.23mi |
| 16315 Mesquite Field Dr Hockley, TX | 4.0 | 2.0 | 1500 | $2,600 | $1.73 | 45d | 1 | 0.36mi |
| 29023 Pearl Barley Way Unit 3656 Hockley, TX | 4.0 | 2.5 | 2395 | $2,300 | $0.96 | 26d | 1 | 0.37mi |
HOA detail
- Monthly dues
- $100 · $1,200/yr
Listing history 9 events
-
2026-05-19price $276,890 563-char remark
-
2026-05-15price $278,390 376-char remark
-
2026-05-14price $278,390 563-char remark
-
2026-05-12price $282,990 376-char remark
-
2026-05-12price $282,990 563-char remark
-
2026-05-09price $288,290 376-char remark
-
2026-05-08price $288,290 563-char remark
-
2026-05-06$292,840 Active 563-char remark
-
2026-04-27$292,840 Active 376-char remark
ⓘ Source: listings_history table (triggers on properties + properties_extension) + one-shot
backfill from property_details.listing_events for pre-trigger history.
Nearby sold comps map
Loading sold comps map…
Walkable amenities ~0.75 mi
Loading nearby amenities…
Taxation est. · year 1
- Rental income
- $27,066
- − Mortgage interest
- −$17,511
- − Property taxes
- −$4,689
- − Insurance
- −$1,563
- − Repairs & maintenance
- −$2,165
- − Management
- −$2,165
- − HOA
- −$1,200
- − Depreciation
- −$9,094
- Taxable loss
- −$11,322
- Est. tax savings @ 24.0%
- +$2,717
- After-tax cash flow
- $-3,025/yr
For passive investors: Depreciation is non-cash, so a rental often shows a tax loss while cash-flowing — sheltering income. Rental losses are passive: they offset passive income freely, and up to $25,000/yr can offset ordinary (W-2) income if you actively participate and your MAGI is under $100k (phasing out to $0 by $150k); unused losses carry forward. On sale, claimed depreciation is recaptured at up to 25%, and gains may owe capital-gains tax (a 1031 exchange can defer both). Figures are a year-1 estimate at your 24.0% rate — not tax advice; consult a CPA.
Condition & rehab AI · 1 photo
This single-story home is in excellent condition with no visible repairs needed. It offers a good investment opportunity with potential for minor updates to enhance its resale and rental value.
Value-add opportunities
- Both Painting the exterior and interior — Fresh paint can enhance curb appeal and interior aesthetics.
- Both Landscaping improvements — Enhanced landscaping can improve curb appeal and attract more potential buyers/tenants.
- Both Kitchen and bathroom updates — Modernizing these spaces can increase the home's appeal and value.
- Both HVAC maintenance — A clean and efficient HVAC system can improve comfort and reduce energy costs.
- Both Interior lighting upgrades — Upgrading lighting can make the home more inviting and energy-efficient.
Renovation cost estimate screening
Value-add ROI direction
- Both Painting the exterior and interior — Fresh paint can enhance curb appeal and interior aesthetics. ↑
- Both Landscaping improvements — Enhanced landscaping can improve curb appeal and attract more potential buyers/tenants. ↑
- Both Kitchen and bathroom updates — Modernizing these spaces can increase the home's appeal and value. ↑
- Both HVAC maintenance — A clean and efficient HVAC system can improve comfort and reduce energy costs. ↑
- Both Interior lighting upgrades — Upgrading lighting can make the home more inviting and energy-efficient. ↑
ⓘ Cost ranges are severity-bucket heuristics (US national rule-of-thumb). Get contractor quotes + a written scope before underwriting a rehab budget.
Schools (NCES district)
- District
- Waller ISD
- NCES district ID
- 4844430
- Math proficiency
- 30% ▼ -23.00%
- Reading proficiency
- 35% ▼ -11.00%
- Median HH income
- $58,911
- Composite
- 29.12/100
- National rank
- #6593
- State rank
- #532 of 826 in TX
Livability — Houston
- Score
- 74/100
- State rank
- #184
- US rank
- #4771
Category grades
Schools grade is shown separately in the Schools card above.
Census & demographics
- County
- Harris County · 4,702,590 people
- City population
- 3,226,434
- Metro
- Houston-The Woodlands-Sugar Land, TX
- Population (ZIP)
- 25,231
- Household income
- $116,925
- Rent vs Own
- Severe rent burden
- 265.0
Population outlook (Harris County) Hauer SSP2
- Today (2025)
- 5,571,493 people
- By 2030
- 6,089,821 · +9.3%
- By 2040
- 7,142,806 · +28.2%
- By 2050
- 8,185,864 · +46.9%
- By 2075
- 10,574,329 · +89.8%
- By 2100
- 12,109,958 · +117.4%
Race, ethnicity, and origin ACS 2023
- Neighborhood character
- Diverse neighborhood (Simpson 0.63)
- Race & ethnicity
- White 44% Hispanic / Latino 41% Two or more races 16% Black 9% Asian 1%
- Hispanic origin (detail)
- Mexican 27%
- Common ancestry
- Lithuanian 3% Slovak 1% Romanian 1%
- Foreign-born
- 15% · Canada, Jamaica, Dominican Republic
- Languages at home
- 69% English-only · Spanish 28% Other Indo-European 1% Vietnamese 1%
Political lean MEDSL · Harris
- 2024 margin
- Lean D (+5.5) · D 52.0% · R 46.4% · Other 1.6%
- 2008→2024 swing
- +3.9pp toward D · 2008: 1.6pp · 2024: 5.5pp
- All cycles
- 2024: D+5.5 2020: D+13.3 2016: D+12.4 2012: D+0.1 2008: D+1.6
Not yet ingested
- Civics
- —
Market trends
- HPI YoY
- ▼ -112.73%
- Current HPI
- 249.6969
- Rent YoY
- ▼ -1.58%
- Metro
- Houston-The Woodlands-Sugar Land, TX
- State GDP YoY
- ▲ 3.95%
- F500 in state
- 110
Industry mix (Fortune 500 HQ in TX)
| Industry | F500 HQs | Revenue |
|---|---|---|
| Energy | 16 | $1,198B |
|
||
| Technology | 5 | $198B |
|
||
| Engineering / Construction | 4 | $72B |
|
||
| Energy Services | 3 | $60B |
|
||
| Utilities | 3 | $41B |
|
||
| Healthcare | 2 | $330B |
|
||
Price history
-7.0% since first listed7 events — show timeline
- 2026-05-28 Pending — HARMLS
- 2026-05-22 Price Changed $272,240 HARMLS
- 2026-05-19 Price Changed $276,890 HARMLS
- 2026-05-14 Price Changed $278,390 HARMLS
- 2026-05-12 Price Changed $282,990 HARMLS
- 2026-05-08 Price Changed $288,290 HARMLS
- 2026-05-06 Listed $292,840 HARMLS
Cash-flow waterfall
monthlySold comps — $/sqft
last 12 mo · ≤1 miLoading sold comps…