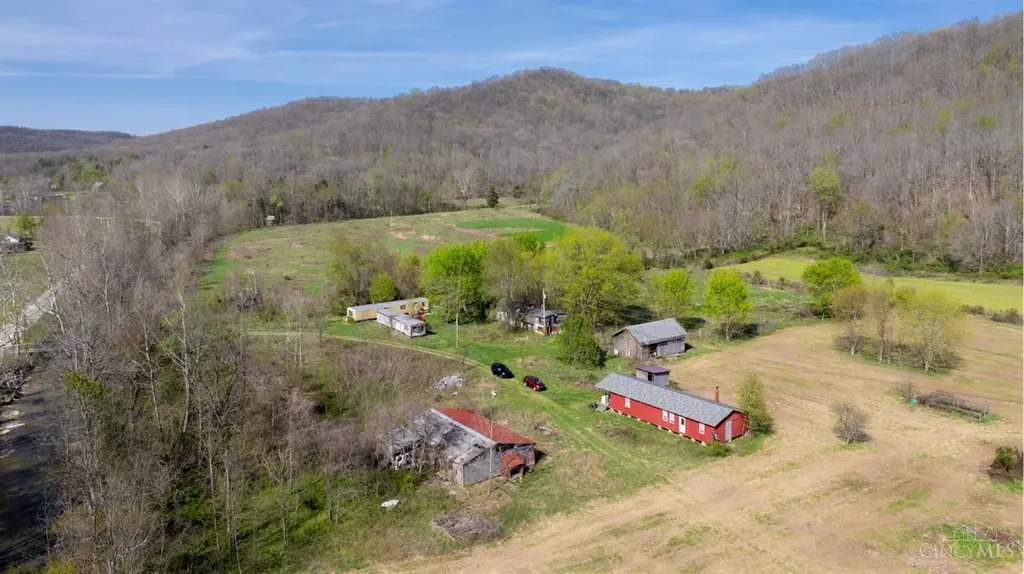
5946 Churn Creek Rd · Rome (Stout), OH
Flood risk 1/10 · Minimal
- FEMA flood zone
- X (unshaded)
- Chance of flooding over 30 yrs
- 0.0%
- Est. flood insurance / yr
- $507 – $1,088
Fire risk 4/10 · Minor
- Est. fire insurance / yr
- $713 – $1,323
Heat risk 3/10 · Minor
- Hot days now (above 100°F)
- 7 days/yr
- Hot days in 30 yrs
- 19 days/yr
Wind risk 2/10 · Minimal
- Chance of severe wind over 30 yrs
- 1.0%
Air-quality risk 2/10 · Minimal
- Unhealthy air days now
- 0 days/yr
- Unhealthy air days in 30 yrs
- 1 days/yr
Risk factors via First Street. Map © Google.
Why this score? — see what drove the C- grade
The composite is a weighted blend of 9 inputs, each scored 0–100. Each bar is that input's sub-score; the figure is the points it added to the 100-point composite (weight × sub-score).
- Cash flow +17.9/30.0
- ARV discount +7.5/15.0
- Appreciation +6.8/10.0
- DSCR +5.6/10.0
- 1% rule +4.8/10.0
- Schools +4.1/10.0
- Rent growth +2.5/5.0
- Livability +2.5/5.0
- Condition / age +1.0/5.0
$129,900
🖨 Deal sheet 📄 Offer letter ✓ Due diligence
Listing remarks
Tucked into the hills of Adams County, this 1.4-acre property offers something that's getting harder to find a foothold in one of southern Ohio's most sought-after areas for outdoor recreation and deer hunting. This is an opportunity to own a piece of Adams County at a low price, but with a bit of elbow grease. The property includes two livable structures: a 3-bedroom, 1-bath home and a 2-bedroom, 1-bath single-wide trailer. Additional outbuildings are on site. The land itself is the draw private, and well-positioned in a region known for exceptional whitetail hunting and wildlife. This one needs work. There is cleanup and renovation required, and the price reflects that reality. For the
Key facts
- 1.49 acre lot
- Built 2012
- Listed 69 days
Property features AI
Finance
- HOA & community: No HOA
Exterior
- Utilities: Public water; Septic tank sewer; Propane gas
- Home design: Single family home; One level; Accessory dwelling unit (ADU) present; Other architectural style
- Construction: Wood siding; Other foundation
- Exterior features: Metal roof; Vinyl windows
Interior
- Kitchen: Kitchen (15 x 10)
- Bedrooms: Three bedrooms total; Primary bedroom on level 1 (15 x 10); Bedroom 2 on level 1 (9 x 9); Bedroom 3 on level 1 (9 x 9)
- Bathrooms: One full bathroom on level 1
- Heating & cooling: Gas heating; Wood heating; Window air conditioning unit; Electric water heating
- Interior features: Five total rooms
Neighborhood map
What this means for you Summary
Snapshot
- This is a 3-bed/1.0-bath single-family listed at $130k. Condition is rated poor.
Deal economics
- At list price, monthly cash flow is $109 ($1k/yr) — positive.
- The deal already cash-flows at list — no discount required.
- To meet the 1% rule (rent ≥ 1% of price), the offer needs to be $127k (1.9% below list).
- Recommended offer: $122k (6.0% below list) — sets the bar for market timing.
Location & tenants
- Location reads: area grade C — affects rentability + tenant quality, not the cash-flow math above.
- Adams County Ohio Valley Local (rural): math 48% / reading 51% proficiency, ranked #463 of 656 in OH (top 71%) — families likely to look elsewhere, expect single-tenant / working-renter base with shorter leases.
- Market conditions: 3 active listings in the ZIP; 42 units permitted in Adams County in 2024 (0 in 5+ unit buildings).
Forward outlook
- In year one you build about $6k of equity ($898 loan paydown + $5k appreciation (3.6% local appreciation)).
- Adams County population projected at -23% by 2050 — secular population decline; favor cash flow + early exit over multi-decade hold.
- At projected returns (3.6% appreciation + 3.0% rent growth), your $36k cash investment doubles in ~5 years — after that, you're playing with house money.
- By year 7, paydown + projected appreciation supports a ~$35k cash-out refi (75% LTV) — recoverable capital for the next deal without selling this one.
Negotiation context
- It's been on market 69 days — a 6% lower offer ($122k) is reasonable based on typical stale-listing flexibility.
Questions for the listing agent
- It's been on market 69 days. Have you received any prior offers? Is the seller open to a 6% concession, seller financing, or rate buy-down credit?
- Have any recent inspections been done? Can we get a copy of the seller's disclosures and any deferred-maintenance estimates?
- Why hasn't it sold? Are there any deal-killer items the seller is aware of (foundation, flood, title, zoning, code violations)?
- Is there a deadline driving the sale (1031 exchange, divorce, estate, relocation)? That informs how much negotiation room exists.
- What's the average days-on-market for RENTAL listings here right now (not sales)? A rising rental-DOM trend means longer vacancies and softer asking-rent achievability than the comps imply.
- What's the recent tenant-quality profile in this submarket — average credit score on applications, eviction rate, late-payment / NSF rate, and stable-employment percentage? A property-management company in the area should have these aggregated.
- How much new for-sale + rental construction is in the pipeline within 1–3 miles? Heavy new supply typically softens prices + rents 12–24 months out; constrained supply supports both.
Investment metrics
- 1% rule
- 0.98% ✗
- Cap rate
- 7.30%
- Cash-on-cash
- 3.61%
- DSCR
- 1.16
- GRM
- 8.5
CMA / ARV
- ARV (on-the-fly)
- $900,000
- Comps found
- 1
Show comp detail 1 sale within ~0.75 mi
| Address | Dist | Beds/Ba | Sqft | Sold | Price | $/sf | Match |
|---|---|---|---|---|---|---|---|
| 7583 Blue Creek Rd | 0.69mi | 3/2.0 | 1,320 (-8%) | 2mo | $825,000 | $625 | 49 |
Match score weights: distance 35% · size 25% · config 20% · recency 20%. Top-matched comps best support the ARV.
Projected returns pro-forma
3.58% appreciation · 3.0% rent growth · sell at horizon
- IRR
- 12.4%
- Equity multiple
- 1.73×
- Total profit
- $26,638
- Equity at exit
- $62,661
- IRR
- 14.1%
- Equity multiple
- 3.21×
- Total profit
- $80,271
- Equity at exit
- $100,014
Cash invested: $36,372 (down + closing). Projections, not guarantees.
Landlord ↔ Tenant lean methodology
- Overall (STATE)
- 73 Landlord-Friendly
- State Ohio
- 73 Landlord-Friendly · R+6
- County
- — inherits STATE
- City
- — inherits STATE
ZIP-level market 45684
- Home prices YoY
- 1.9%
- Active inventory
- 3
- Price-to-rent
- 8.5×
Monthly cashflow live
- Estimated rent
- $1,275 medium interval (Pro) →
- Mortgage (P&I)
- −$681
- Tax est. 1.5%
- −$162 /mo · $1,948/yr
- Insurance
- −$54
- HOA
- −$0
- Vacancy / Maint / Mgmt
- −$268
- Net cashflow
- $109
Break-even live
UW: 25.0% down · 7.5% · 30yr · 1.5% tax · 5.0% vac · 8.0% maint · 8.0% mgmt
Financing live
Cash to close
- Down payment
- $32,475
- Closing costs
- $3,897
- Reserves months
- —
- Total cash needed
- —
Loan-product check · same deal, 3 products live
Conventional
25% down · 7.5% · 30yr
- Down + closing
- —
- Monthly P&I
- —
- Monthly cashflow
- —
- DSCR
- —
- Eligible?
- —
Personal DTI + credit; lowest rate.
DSCR
20% down · 8.5% · 30yr
- Down + closing
- —
- Monthly P&I
- —
- Monthly cashflow
- —
- DSCR
- —
- Eligible?
- —
No personal income docs; deal must DSCR.
Hard money
10% down · 12.0% · 12mo
- Down + closing
- —
- Monthly P&I
- —
- Monthly cashflow
- —
- DSCR
- —
- Eligible?
- —
Short-term bridge; refi at stabilization.
Listing history 15 events
-
2026-06-18days on market $129,900 Active 69 DOM
-
2026-06-17days on market $129,900 Active 68 DOM
-
2026-06-16days on market $129,900 Active 67 DOM
-
2026-06-15days on market $129,900 Active 66 DOM
-
2026-06-13days on market $129,900 Active 64 DOM
-
2026-06-12days on market $129,900 Active 63 DOM
-
2026-06-09days on market $129,900 Active 60 DOM
-
2026-06-08days on market $129,900 Active 59 DOM
-
2026-06-07days on market $129,900 Active 58 DOM
-
2026-06-05days on market $129,900 Active 56 DOM
-
2026-06-04days on market $129,900 Active 54 DOM
-
2026-06-02days on market $129,900 Active 53 DOM
-
2026-06-01days on market $129,900 Active 52 DOM
-
2026-05-31days on market $129,900 Active 51 DOM
-
2026-04-10$129,900 Active
ⓘ Source: listings_history table (triggers on properties + properties_extension) + one-shot
backfill from property_details.listing_events for pre-trigger history.
Climate risk First Street
- Flood 1/10 Low FEMA zone X (unshaded) · 0% chance over 30 yrs
- Wildfire 4/10 Moderate
- Heat 3/10 Moderate 7 d/yr ≥100°F today · 19 d/yr by 30 yrs out
- Wind 2/10 Low 100% chance of damaging wind over 30 yrs
- Air quality 2/10 Low 0 unhealthy d/yr today · 1 by 30 yrs out
Nearby sold comps map
Loading sold comps map…
Walkable amenities ~0.75 mi
Loading nearby amenities…
Taxation est. · year 1
- Rental income
- $15,299
- − Mortgage interest
- −$7,276
- − Property taxes
- −$1,948
- − Insurance
- −$650
- − Repairs & maintenance
- −$1,224
- − Management
- −$1,224
- − Depreciation
- −$3,779
- Taxable loss
- −$802
- Est. tax savings @ 24.0%
- +$193
- After-tax cash flow
- $1,506/yr
For passive investors: Depreciation is non-cash, so a rental often shows a tax loss while cash-flowing — sheltering income. Rental losses are passive: they offset passive income freely, and up to $25,000/yr can offset ordinary (W-2) income if you actively participate and your MAGI is under $100k (phasing out to $0 by $150k); unused losses carry forward. On sale, claimed depreciation is recaptured at up to 25%, and gains may owe capital-gains tax (a 1031 exchange can defer both). Figures are a year-1 estimate at your 24.0% rate — not tax advice; consult a CPA.
Condition & rehab AI · 13 photos
This property requires extensive renovation and maintenance to become move-in ready. Significant repairs and updates are needed to improve its condition and increase its value.
Repairs flagged
- Major kitchen appliances — need replacement
- Major bathroom fixtures — need replacement
- Major roof repair — visible damage
- Major exterior structures — dilapidated
- Major flooring — worn
- Major paint — peeling
- Major HVAC — outdated and likely inefficient
Value-add opportunities
- Both exterior renovation — enhances curb appeal and value
- Both interior renovation — updates the home's appearance and functionality
- Both HVAC upgrade — improves comfort and energy efficiency
- Both landscaping and curb appeal — enhances the property's visual appeal
Renovation cost estimate screening
| Repair item | Severity | Est. cost |
|---|---|---|
| kitchen appliances · need replacement | Major | $15,000–50,000 |
| bathroom fixtures · need replacement | Major | $15,000–50,000 |
| roof repair · visible damage | Major | $15,000–50,000 |
| exterior structures · dilapidated | Major | $15,000–50,000 |
| flooring · worn | Major | $15,000–50,000 |
| paint · peeling | Major | $15,000–50,000 |
| HVAC · outdated and likely inefficient | Major | $15,000–50,000 |
| Total estimated repair cost · 7 items | $105,000–350,000 |
Value-add ROI direction
- Both exterior renovation — enhances curb appeal and value ↑
- Both interior renovation — updates the home's appearance and functionality ↑
- Both HVAC upgrade — improves comfort and energy efficiency ↑
- Both landscaping and curb appeal — enhances the property's visual appeal ↑
ⓘ Cost ranges are severity-bucket heuristics (US national rule-of-thumb). Get contractor quotes + a written scope before underwriting a rehab budget.
Schools (NCES district)
- District
- Adams County Ohio Valley Local
- NCES district ID
- 3906190
- Math proficiency
- 48% ▼ -9.00%
- Reading proficiency
- 51% ▼ -7.00%
- Median HH income
- $35,314
- Composite
- 40.96/100
- National rank
- #3603
- State rank
- #463 of 656 in OH
Livability — Rome (Stout)
No livability data for this city. (Only ~50 U.S. cities are tracked.)
Census & demographics
- County
- Adams · 32,832 people
- Population (ZIP)
- 1,577
- Household income
- $52,000
- Rent vs Own
- Severe rent burden
- 1.1
Population outlook (Adams County) Hauer SSP2
- Today (2025)
- 26,467 people
- By 2030
- 25,354 · -4.2%
- By 2040
- 22,951 · -13.3%
- By 2050
- 20,394 · -22.9%
- By 2075
- 14,824 · -44.0%
- By 2100
- 9,909 · -62.6%
Race, ethnicity, and origin ACS 2023
- Neighborhood character
- Predominantly White (100%)
- Race & ethnicity
- White 100%
- Common ancestry
- Iranian 3% Lithuanian 2% Serbian 2%
Political lean MEDSL · Adams
- 2024 margin
- Solid R (+65.7) · D 16.9% · R 82.6%
- 2008→2024 swing
- -41.6pp toward R · 2008: -24.1pp · 2024: -65.7pp
- All cycles
- 2024: R+65.7 2020: R+63.5 2016: R+55.6 2012: R+26.3 2008: R+24.1
Not yet ingested
- Civics
- —
Market trends
- HPI YoY
- ▲ 3.58%
- Current HPI
- 190.4123
- Rent YoY
- —
- Metro
- —
- State GDP YoY
- ▲ 1.98%
- F500 in state
- 48
Industry mix (Fortune 500 HQ in OH)
| Industry | F500 HQs | Revenue |
|---|---|---|
| Insurance | 3 | $145B |
|
||
| Industrial Machinery | 3 | $49B |
|
||
| Financial Services | 3 | $24B |
|
||
| Consumer Goods | 2 | $93B |
|
||
| Aerospace / Defense | 2 | $47B |
|
||
| Utilities | 2 | $33B |
|
||
Price history
1 event — show timeline
- 2026-04-10 Listed $129,900 Cincy MLS
Cash-flow waterfall
monthlySold comps — $/sqft
last 12 mo · ≤1 miLoading sold comps…