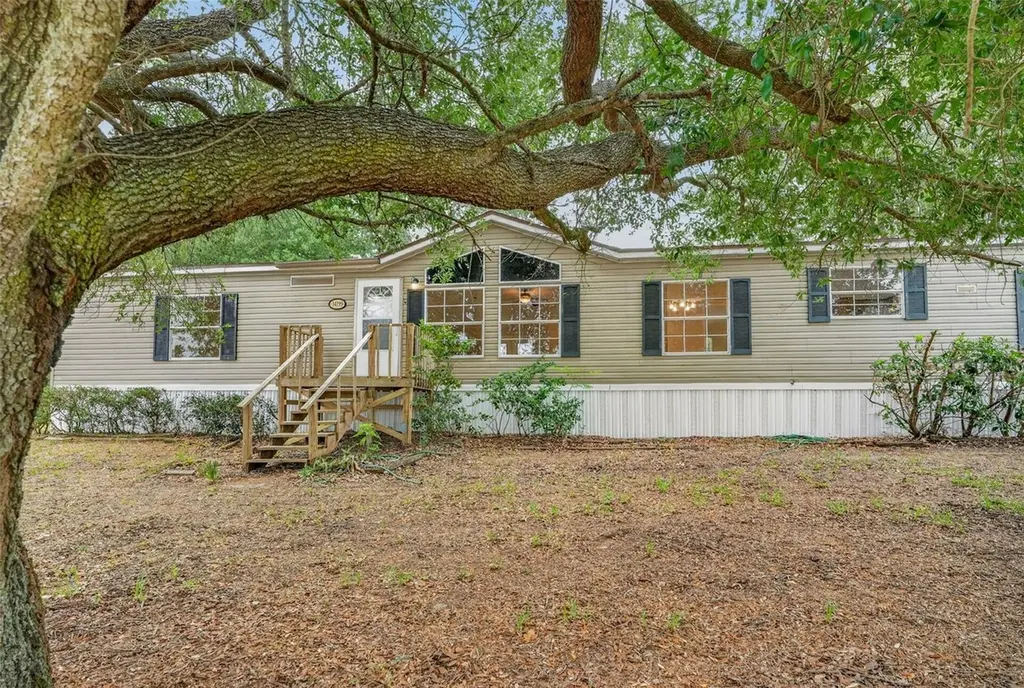
14199 SE 59th Ct · Belleview, FL
Flood risk 1/10 · Minimal
- FEMA flood zone
- X (unshaded)
- Chance of flooding over 30 yrs
- 0.0%
- Est. flood insurance / yr
- $507 – $1,088
Fire risk 5/10 · Moderate
- Est. fire insurance / yr
- $947 – $1,759
Heat risk 9/10 · Severe
- Hot days now (above 109°F)
- 7 days/yr
- Hot days in 30 yrs
- 22 days/yr
Wind risk 9/10 · Severe
- Chance of severe wind over 30 yrs
- 99.0%
Air-quality risk 3/10 · Minor
- Unhealthy air days now
- 3 days/yr
- Unhealthy air days in 30 yrs
- 4 days/yr
Risk factors via First Street. Map © Google.
Why this score? — see what drove the C grade
The composite is a weighted blend of 9 inputs, each scored 0–100. Each bar is that input's sub-score; the figure is the points it added to the 100-point composite (weight × sub-score).
- Cash flow +23.3/30.0
- ARV discount +7.8/15.0
- DSCR +7.5/10.0
- 1% rule +5.0/10.0
- Schools +3.6/10.0
- Livability +3.5/5.0
- Rent growth +2.5/5.0
- Condition / age +2.5/5.0
- Appreciation +0.0/10.0
$216,500
🖨 Deal sheet 📄 Offer letter ✓ Due diligence
Listing remarks MLS
LIKE NEW! LARGE HOME WITH LARGE ROOMS, HUGE KITCHEN WITH ISLAND AND BAR, DINING AREA AND FORMAL DINING ROOM, CHERRY WOOD CABINETS THRU-OUT, ALL WALK-IN CLOSETS, MASTER SUITE WITH OVERSIZED CLOSET, MASTER BATH WITH DOUBLE SINKS, LARGE TUB AND SHOWER, LARGE UTILITY ROOM, SKYVIEW WINDOWS AND SLIDING DOOR, DECK, FENCED NICE HIGH LOT. ALL APPLIANCES INCLUDED. OWNER/AGENT.
Key facts
- Breakfast nook
- Spacious lot
- 0.34 acre lot
Tags
Property features AI
Finance
- Other: Approximately 0.34 acre lot (about 1/4 to less than 1/2 acre)
- Financial info: No lease restrictions indicated; Taxes listed (amounts excluded per instructions)
- HOA & community: No homeowners association
Exterior
- Security: Fire alarm
- Utilities: Public water; Septic tank; Electricity connected
- Home design: Manufactured double-wide home; One level; Faces west
- Construction: Vinyl siding; Shingle roof; Pillar/post/pier foundation; Built in (year not provided)
- Exterior features: Deck; French doors; Paved road access; Publicly maintained road
Interior
- Kitchen: Dishwasher; Range; Range hood; Refrigerator; Eat-in kitchen; Solid wood cabinets
- Bedrooms: 3 bedrooms
- Bathrooms: 2 full bathrooms
- Heating & cooling: Central heating; Electric heating; Heat pump; Central air conditioning; Vaulted ceilings (affecting interior climate)
- Interior features: Built-in features; Ceiling fans; Eat-in kitchen; Solid wood cabinets; Split bedroom layout; Thermostat; Vaulted ceilings; Walk-in closets; Fire alarm
- Laundry & utility: Dedicated laundry room
Neighborhood map
What this means for you Summary
Snapshot
- This is a 3-bed/2.0-bath manufactured listed at $216k.
Deal economics
- At list price, monthly cash flow is $396 ($5k/yr) — positive.
- The deal already cash-flows at list — no discount required.
- To meet the 1% rule (rent ≥ 1% of price), the offer needs to be $216k (0.4% below list).
- Recommended offer: $210k (3.0% below list) — sets the bar for market timing.
- Cap rate 8.5% vs local median 4.5% in Belleview — top-decile yield for the area; either an underpriced asset or a hidden risk that comps aren't pricing in. Stress-test before assuming the spread holds.
Location & tenants
- Location reads 69/100 on livability (#458 in FL) — a middle-class / working-renter tenant base. Strengths: cost of living A+, housing A+, health & safety A+; Watch: crime F, amenities F, commute F.
- Marion (rural): math 42% / reading 43% proficiency, ranked #61 of 73 in FL (top 84%) — families likely to look elsewhere, expect single-tenant / working-renter base with shorter leases; 61% free/reduced lunch — lower-income household profile, screen leases tightly.
- Zoned schools: Harbour View Elementary School (math 41% / reading 38%, grade F, #1,513 of 2,144 statewide, top 73%, 819 students, 71% FRL); Belleview High School (math 31% / reading 46%, grade F, #321 of 667 statewide, top 49%, 1,783 students, 56% FRL) — zoned schools at 64% FRL track the district average.
- Market conditions: 705 active listings in the ZIP; 2 comparable units currently listed for rent nearby; 7,071 units permitted in Marion County in 2024 (534 in 5+ unit buildings).
- This rent runs 39% of the median local income ($67k/yr) — at the standard rent-burdened threshold; future hikes will face affordability resistance.
Forward outlook
- Local home prices are declining (-3.0%/yr); year-one equity from $1k of loan paydown is wiped out by about $6k of value loss. Plan a longer hold.
- Marion County population projected at +13% by 2050 — modest demand growth; plan on rents tracking national, not racing it.
Negotiation context
- It's been on market 35 days — a 3% lower offer ($210k) is reasonable based on typical stale-listing flexibility.
- 3 sale attempts since 21y ago with the ask held roughly flat each time — persistent listings suggest the price (not the market) is what's stuck; bring a comps-based counter.
- Current owner paid $75k; list at $216k implies a 189% gain — meaningful room to come down on a strong offer.
Risks & watch-outs
- Climate carrying-cost: severe wind risk, 99% chance of damaging wind over 30y; moderate wildfire risk; extreme-heat days projected 7→22/yr by 2055 (HVAC capex compounding) — expect insurance premiums to compound above CPI over the hold.
Questions for the listing agent
- It's been on market 35 days. Have you received any prior offers? Is the seller open to a 3% concession, seller financing, or rate buy-down credit?
- Is there a deadline driving the sale (1031 exchange, divorce, estate, relocation)? That informs how much negotiation room exists.
- Schools are D-rated, which usually means shorter tenancies and higher turnover. Who's the typical renter profile here, and what's been the actual vacancy rate?
- Crime grade is F in this area — have there been break-ins, vandalism, or insurance claims at this property in the last 3 years? What carrier currently insures it and at what premium?
- What's the average days-on-market for RENTAL listings here right now (not sales)? A rising rental-DOM trend means longer vacancies and softer asking-rent achievability than the comps imply.
- What's the recent tenant-quality profile in this submarket — average credit score on applications, eviction rate, late-payment / NSF rate, and stable-employment percentage? A property-management company in the area should have these aggregated.
- How much new for-sale + rental construction is in the pipeline within 1–3 miles? Heavy new supply typically softens prices + rents 12–24 months out; constrained supply supports both.
Investment metrics
- 1% rule
- 1.00% ✗
- Cap rate
- 8.49%
- Cash-on-cash
- 7.84%
- DSCR
- 1.35
- GRM
- 8.4
CMA / ARV
- ARV (median comp)
- $217,739
- List price
- $216,500
- Delta
- -0.57%
- Verdict
- FAIR
- Comps
- 4 within 1.0 mi
Show comp detail 3 sales within ~0.75 mi
| Address | Dist | Beds/Ba | Sqft | Sold | Price | $/sf | Match |
|---|---|---|---|---|---|---|---|
| 14093 SE 62nd Ct | 0.24mi | 4/3.0 (+1) | 1,856 (-2%) | 3mo | $207,700 | $112 | 74 |
| 14182 SE 62nd Ct | 0.19mi | 4/2.0 (+1) | 1,620 (-14%) | 1mo | $194,000 | $120 | 62 |
| 14219 SE 63rd Ave | 0.28mi | 3/2.0 | 2,092 (+11%) | 12mo | $245,000 | $117 | 59 |
Match score weights: distance 35% · size 25% · config 20% · recency 20%. Top-matched comps best support the ARV.
Projected returns pro-forma
-3.0% appreciation · 3.0% rent growth · sell at horizon
- IRR
- -4.4%
- Equity multiple
- 0.84×
- Total profit
- $-9,946
- Equity at exit
- $32,281
- IRR
- 5.3%
- Equity multiple
- 1.39×
- Total profit
- $23,475
- Equity at exit
- $18,719
Cash invested: $60,620 (down + closing). Projections, not guarantees.
Landlord ↔ Tenant lean methodology
- Overall (STATE)
- 87 Strongly Landlord-Friendly
- State Florida
- 87 Strongly Landlord-Friendly · R+3
- County
- — inherits STATE
- City
- — inherits STATE
ZIP-level market 34491
- Home prices YoY
- -35.0%
- Active inventory
- 705
- Price-to-rent
- 8.4×
Monthly cashflow live
- Estimated rent
- $2,157 medium interval (Pro) →
- Mortgage (P&I)
- −$1,135
- Tax from tax record
- −$83 /mo · $990/yr
- Insurance
- −$90
- HOA
- −$0
- Vacancy / Maint / Mgmt
- −$453
- Net cashflow
- $396
Break-even live
UW: 25.0% down · 7.5% · 30yr · 1.5% tax · 5.0% vac · 8.0% maint · 8.0% mgmt
Financing live
Cash to close
- Down payment
- $54,125
- Closing costs
- $6,495
- Reserves months
- —
- Total cash needed
- —
Loan-product check · same deal, 3 products live
Conventional
25% down · 7.5% · 30yr
- Down + closing
- —
- Monthly P&I
- —
- Monthly cashflow
- —
- DSCR
- —
- Eligible?
- —
Personal DTI + credit; lowest rate.
DSCR
20% down · 8.5% · 30yr
- Down + closing
- —
- Monthly P&I
- —
- Monthly cashflow
- —
- DSCR
- —
- Eligible?
- —
No personal income docs; deal must DSCR.
Hard money
10% down · 12.0% · 12mo
- Down + closing
- —
- Monthly P&I
- —
- Monthly cashflow
- —
- DSCR
- —
- Eligible?
- —
Short-term bridge; refi at stabilization.
Rent comps 2 comps
| Address | Beds | Baths | Sqft | Rent | $/sqft | DOM | Units | Dist |
|---|---|---|---|---|---|---|---|---|
| 13705 SE 54th Ct Summerfield, FL | 3.0 | 2.0 | 1416 | $1,895 | $1.34 | 21d | 1 | 0.69mi |
| 13609 SE 53rd Ave Summerfield, FL | 3.0 | 2.0 | 1270 | $1,940 | $1.53 | 21d | 1 | 0.84mi |
Listing history 22 events
-
2026-06-18days on market $216,500 Active 35 DOM
-
2026-06-17days on market $216,500 Active 34 DOM
-
2026-06-16days on market $216,500 Active 33 DOM
-
2026-06-15days on market $216,500 Active 32 DOM
-
2026-06-14days on market $216,500 Active 30 DOM
-
2026-06-13pricedays on market $216,500 Active 29 DOM
-
2026-06-10days on market $219,000 Active 27 DOM
-
2026-06-09days on market $219,000 Active 26 DOM
-
2026-06-08days on market $219,000 Active 25 DOM
-
2026-06-07days on market $219,000 Active 24 DOM
-
2026-06-03days on market $219,000 Active 20 DOM
-
2026-06-02days on market $219,000 Active 19 DOM
-
2026-06-01days on market $219,000 Active 18 DOM
-
2026-05-31days on market $219,000 Active 17 DOM
-
2026-05-30days on market $219,000 Active 16 DOM
-
2026-05-14$219,000 Active 1483-char remark
-
2013-10-08soldstatus $75,000
-
2006-06-02soldstatus $115,000
-
2006-05-25soldstatus $115,000 369-char remark
Show marketing remark (369 chars)
LIKE NEW! LARGE HOME WITH LARGE ROOMS, HUGE KITCHEN WITH ISLAND AND BAR, DINING AREA AND FORMAL DINING ROOM, CHERRY WOOD CABINETS THRU-OUT, ALL WALK-IN CLOSETS, MASTER SUITE WITH OVERSIZED CLOSET, MASTER BATH WITH DOUBLE SINKS, LARGE TUB AND SHOWER, LARGE UTILITY ROOM, SKYVIEW WINDOWS AND SLIDING DOOR, DECK, FENCED NICE HIGH LOT. ALL APPLIANCES INCLUDED. OWNER/AGENT.
-
2006-01-13$118,000 369-char remark
Show marketing remark (369 chars)
LIKE NEW! LARGE HOME WITH LARGE ROOMS, HUGE KITCHEN WITH ISLAND AND BAR, DINING AREA AND FORMAL DINING ROOM, CHERRY WOOD CABINETS THRU-OUT, ALL WALK-IN CLOSETS, MASTER SUITE WITH OVERSIZED CLOSET, MASTER BATH WITH DOUBLE SINKS, LARGE TUB AND SHOWER, LARGE UTILITY ROOM, SKYVIEW WINDOWS AND SLIDING DOOR, DECK, FENCED NICE HIGH LOT. ALL APPLIANCES INCLUDED. OWNER/AGENT.
-
2005-08-17$29,995
-
1997-10-13soldstatus $14,500
ⓘ Source: listings_history table (triggers on properties + properties_extension) + one-shot
backfill from property_details.listing_events for pre-trigger history.
Tax reassessment forecast FL · Resets to sale price
- Current annual tax
- $990 · $83/mo
- Projected year-2 tax
- $1,797 · $150/mo
- Expected delta
- +$807/yr (+$67/mo · 81.4%)
ⓘ Screening estimate from a state-policy table — verify with the county assessor before closing.
Climate risk First Street
- Flood 1/10 Low FEMA zone X (unshaded) · 0% chance over 30 yrs
- Wildfire 5/10 Major
- Heat 9/10 Extreme 7 d/yr ≥109°F today · 22 d/yr by 30 yrs out
- Wind 9/10 Extreme 99% chance of damaging wind over 30 yrs
- Air quality 3/10 Moderate 3 unhealthy d/yr today · 4 by 30 yrs out
Nearby sold comps map
Loading sold comps map…
Walkable amenities ~0.75 mi
Loading nearby amenities…
Taxation est. · year 1
- Rental income
- $25,884
- − Mortgage interest
- −$12,127
- − Property taxes
- −$990
- − Insurance
- −$1,082
- − Repairs & maintenance
- −$2,071
- − Management
- −$2,071
- − Depreciation
- −$6,298
- Taxable income
- $1,244
- Est. tax owed @ 24.0%
- −$299
- After-tax cash flow
- $4,453/yr
For passive investors: Depreciation is non-cash, so a rental often shows a tax loss while cash-flowing — sheltering income. Rental losses are passive: they offset passive income freely, and up to $25,000/yr can offset ordinary (W-2) income if you actively participate and your MAGI is under $100k (phasing out to $0 by $150k); unused losses carry forward. On sale, claimed depreciation is recaptured at up to 25%, and gains may owe capital-gains tax (a 1031 exchange can defer both). Figures are a year-1 estimate at your 24.0% rate — not tax advice; consult a CPA.
Schools (NCES district)
- District
- Marion
- NCES district ID
- 1201260
- Math proficiency
- 42% ▼ -7.00%
- Reading proficiency
- 43% ▼ -4.00%
- Median HH income
- $40,015
- Composite
- 35.61/100
- National rank
- #4890
- State rank
- #61 of 73 in FL
Livability — Belleview
- Score
- 69/100
- State rank
- #458
- US rank
- #8314
Category grades
Schools grade is shown separately in the Schools card above.
Census & demographics
- County
- Marion County · 315,796 people
- City population
- 19,167
- Metro
- Ocala, FL
- Population (ZIP)
- 33,318
- Household income
- $66,679
- Rent vs Own
- Severe rent burden
- 256.0
Population outlook (Marion County) Hauer SSP2
- Today (2025)
- 365,905 people
- By 2030
- 376,768 · +3.0%
- By 2040
- 396,555 · +8.4%
- By 2050
- 412,723 · +12.8%
- By 2075
- 446,090 · +21.9%
- By 2100
- 436,193 · +19.2%
Race, ethnicity, and origin ACS 2023
- Neighborhood character
- Predominantly White (77%)
- Race & ethnicity
- White 77% Hispanic / Latino 14% Two or more races 9% Black 4% Asian 2%
- Hispanic origin (detail)
- Mexican 3% Puerto Rican 6% Cuban 1%
- Common ancestry
- Lithuanian 3% Slovak 2% Romanian 2%
- Foreign-born
- 8% · Canada, Vietnam, Jamaica
- Languages at home
- 85% English-only · Spanish 11% Vietnamese 1% French/Haitian/Cajun 1%
Political lean MEDSL · Marion
- 2024 margin
- Solid R (+31.6) · D 33.8% · R 65.5%
- 2008→2024 swing
- -20.0pp toward R · 2008: -11.6pp · 2024: -31.6pp
- All cycles
- 2024: R+31.6 2020: R+25.9 2016: R+26.2 2012: R+16.2 2008: R+11.6
Not yet ingested
- Civics
- —
Market trends
- HPI YoY
- ▼ -107.67%
- Current HPI
- 200.0792
- Rent YoY
- —
- Metro
- Ocala, FL
- State GDP YoY
- ▲ 3.28%
- F500 in state
- 36
Industry mix (Fortune 500 HQ in FL)
| Industry | F500 HQs | Revenue |
|---|---|---|
| Industrial Technology | 2 | $29B |
|
||
| Insurance | 2 | $17B |
|
||
| Retail | 1 | $60B |
|
||
| Technology Distribution | 1 | $58B |
|
||
| Homebuilding | 1 | $35B |
|
||
| Technology Manufacturing | 1 | $35B |
|
||
Price history
+1393.1% since first listed8 events — show timeline
- 2026-06-12 Price Changed $216,500 Stellar MLS as Distributed by MLS Grid
- 2026-05-14 Listed $219,000 Stellar MLS as Distributed by MLS Grid
- 2013-10-08 Sold (Public Records) $75,000 Public Records
- 2006-06-02 Sold (Public Records) $115,000 Public Records
- 2006-05-25 Sold (MLS) $115,000 Stellar MLS as Distributed by MLS Grid
- 2006-01-13 Listed $118,000 Stellar MLS as Distributed by MLS Grid
- 2005-08-17 Listed $29,995 Stellar MLS as Distributed by MLS Grid
- 1997-10-13 Sold (Public Records) $14,500 Public Records
Property tax history
+3.6%/yrLatest (2025): $990 · +28.0% YoY. Source: county tax records.
Cash-flow waterfall
monthlySold comps — $/sqft
last 12 mo · ≤1 miLoading sold comps…