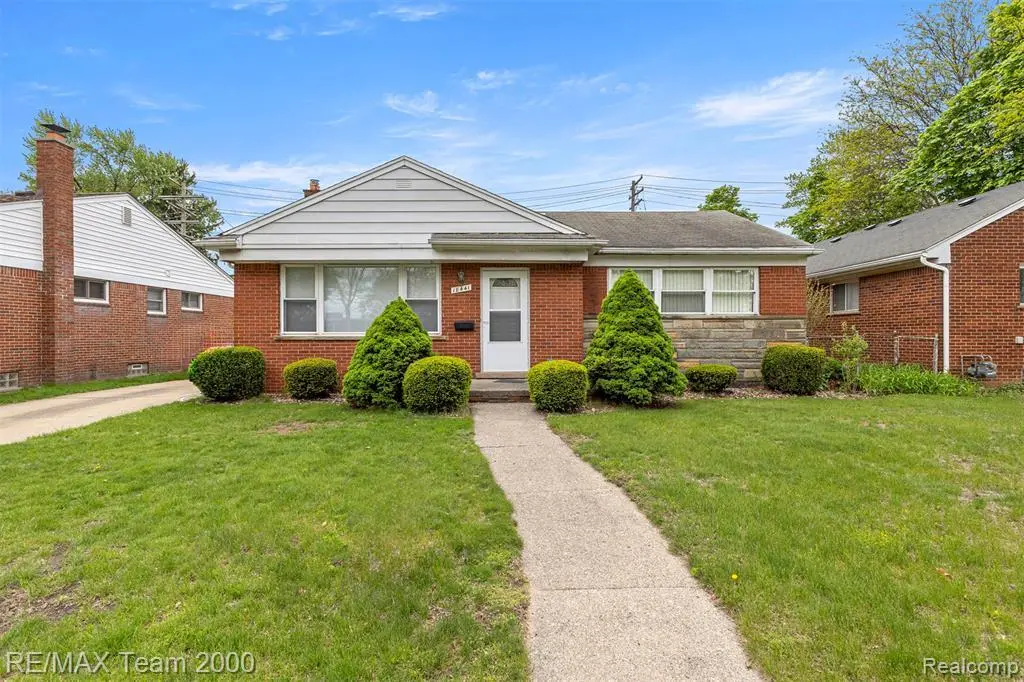
18441 Oakwood Blvd · Dearborn, MI
Flood risk 1/10 · Minimal
- FEMA flood zone
- X (unshaded)
- Chance of flooding over 30 yrs
- 0.0%
- Est. flood insurance / yr
- $473 – $860
Fire risk 1/10 · Minimal
- Est. fire insurance / yr
- $784 – $1,456
Heat risk 3/10 · Minor
- Hot days now (above 97°F)
- 7 days/yr
- Hot days in 30 yrs
- 15 days/yr
Wind risk 2/10 · Minimal
- Chance of severe wind over 30 yrs
- —
Air-quality risk 3/10 · Minor
- Unhealthy air days now
- 2 days/yr
- Unhealthy air days in 30 yrs
- 4 days/yr
Risk factors via First Street. Map © Google.
Why this score? — see what drove the F grade
The composite is a weighted blend of 9 inputs, each scored 0–100. Each bar is that input's sub-score; the figure is the points it added to the 100-point composite (weight × sub-score).
- Cash flow +13.1/30.0
- Livability +4.0/5.0
- DSCR +3.9/10.0
- Rent growth +3.4/5.0
- 1% rule +3.0/10.0
- Schools +2.8/10.0
- Condition / age +2.5/5.0
- ARV discount +0.5/15.0
- Appreciation +0.0/10.0
$244,900
🖨 Deal sheet 📄 Offer letter ✓ Due diligence
Listing remarks MLS
Check this 3 bedroom full brick Ranch! Popular layout ~ large living room dining room combo, spacious kitchen, hardwood floors, 2 baths, finished basement, thermal pane windows, new furnace & central air, copper plumbing & 2.5 car garage. Seller to provide city certs. This one won't last! Use LB for EZ showings.
Key facts
- 6,098 sq ft lot
- 2 garage spots
- Built 1954
Property features AI
Finance
- Other: Property type: Residential — Single Family Residence; Lot dimensions about 54 x 110 (approx. 0.14 acres)
Exterior
- Parking: Detached garage with garage door opener; Approximately 2.5 garage spaces; Driveway
- Security: Smoke detector(s)
- Utilities: Public water; Public sewer; Cable available
- Home design: Single-family residence; One level (entry at ground level); Brick exterior; Asphalt roof; Subdivision: OAKWOOD BLVD LAWN; Facing direction: not specified
- Construction: Brick construction; Asphalt roof; Finished basement
- Exterior features: Back yard with fencing; Paved road access
Interior
- Kitchen: Dishwasher; Disposal; Free-standing electric range; Microwave; Free-standing refrigerator
- Bedrooms: 5 total rooms (includes bedrooms and living spaces)
- Bathrooms: 2 full bathrooms
- Heating & cooling: Forced air heating (natural gas); Central air conditioning; Ceiling fans
- Interior features: Finished basement; Awning(s); Smoke detectors
- Laundry & utility: Washer; Dryer
Neighborhood map
What this means for you Summary
Snapshot
- This is a 3-bed/2.0-bath single-family listed at $245k.
Deal economics
- At list price, monthly cash flow is $-10 ($-121/yr) — negative.
- To cash-flow at today's rent, offer at most $243k (0.7% below list).
- To meet the 1% rule (rent ≥ 1% of price), the offer needs to be $196k (19.8% below list).
- Recommended offer: $196k (19.8% below list) — sets the bar for 1% rule.
- Cap rate 6.2% vs local median 4.3% in Dearborn — top-decile yield for the area; either an underpriced asset or a hidden risk that comps aren't pricing in. Stress-test before assuming the spread holds.
Location & tenants
- Location reads 80/100 on livability (#84 in MI, #1,904 nationally) — a professional / high-income tenant draw. Strengths: commute A+, cost of living A+, housing A+; Watch: amenities D, schools D-.
- Dearborn City School District (urban): math 26% / reading 39% proficiency, ranked #325 of 540 in MI (top 60%) — families likely to look elsewhere, expect single-tenant / working-renter base with shorter leases; 66% free/reduced lunch — lower-income household profile, screen leases tightly.
- Market conditions: Rents rising (+3.6%/yr); 148 active listings in the ZIP; 7 comparable units currently listed for rent nearby; rentals leasing fast (median 10d on market — plan ~1-2 weeks tenant-placement turnaround); solid renter incomes; 2,639 units permitted in Wayne County in 2024 (1,216 in 5+ unit buildings).
Forward outlook
- Local home prices are declining (-3.0%/yr); year-one equity from $2k of loan paydown is wiped out by about $7k of value loss. Plan a longer hold.
- Wayne County population projected at -17% by 2050 — secular population decline; favor cash flow + early exit over multi-decade hold.
Negotiation context
- Only 10 days on market — expect competitive offers; lowballing is unlikely to land.
- 2 sale attempts with the ask held roughly flat each time — persistent listings suggest the price (not the market) is what's stuck; bring a comps-based counter.
Risks & watch-outs
- Watch-outs: built in 1954 — expect roof / HVAC / electrical / plumbing capex.
Questions for the listing agent
- What do current leases actually rent for vs. the listed asking? Can we see a recent rent roll and the last 12 months of T-12 income?
- Built in 1954 — when were the roof, HVAC, electrical panel, plumbing, and water heater last replaced?
- Is there a deadline driving the sale (1031 exchange, divorce, estate, relocation)? That informs how much negotiation room exists.
- Schools are D-rated, which usually means shorter tenancies and higher turnover. Who's the typical renter profile here, and what's been the actual vacancy rate?
- The area grade is low — what's the realistic commute time and amenity access for the typical tenant pool here? Any planned neighborhood developments (good or bad) we should know about?
- What's the average days-on-market for RENTAL listings here right now (not sales)? A rising rental-DOM trend means longer vacancies and softer asking-rent achievability than the comps imply.
- What's the recent tenant-quality profile in this submarket — average credit score on applications, eviction rate, late-payment / NSF rate, and stable-employment percentage? A property-management company in the area should have these aggregated.
- How much new for-sale + rental construction is in the pipeline within 1–3 miles? Heavy new supply typically softens prices + rents 12–24 months out; constrained supply supports both.
Investment metrics
- 1% rule
- 0.80% ✗
- Cap rate
- 6.24%
- Cash-on-cash
- -0.18%
- DSCR
- 0.99
- GRM
- 10.4
CMA / ARV
- ARV (on-the-fly)
- $212,055
- Comps found
- 12
Show comp detail 12 sales within ~0.75 mi
| Address | Dist | Beds/Ba | Sqft | Sold | Price | $/sf | Match |
|---|---|---|---|---|---|---|---|
| 1421 Hollywood St | 0.07mi | 3/2.0 | 1,121 (+6%) | 3mo | $251,000 | $224 | 84 |
| 1453 Hollywood St | 0.10mi | 3/2.0 | 1,098 (+4%) | 15mo | $220,000 | $200 | 76 |
| 1300 Venice St | 0.04mi | 2/1.5 (-1) | 956 (-9%) | 4mo | $237,500 | $248 | 72 |
| 1600 Hollywood St | 0.18mi | 2/1.0 (-1) | 1,134 (+8%) | 5mo | $172,000 | $152 | 66 |
| 1826 Walnut St | 0.54mi | 3/1.5 | 1,016 (-4%) | 5mo | $220,000 | $217 | 63 |
| 1767 Venice St | 0.32mi | 3/1.0 | 1,147 (+9%) | 11mo | $240,000 | $209 | 58 |
| 3201 Croissant St | 0.65mi | 3/1.0 | 1,102 (+4%) | 3mo | $220,000 | $200 | 56 |
| 3157 Dallas St | 0.67mi | 2/1.0 (-1) | 1,125 (+7%) | 2mo | $187,000 | $166 | 47 |
| 2655 Willow St | 0.68mi | 3/2.0 | 1,196 (+13%) | 2mo | $259,000 | $217 | 44 |
| 2645 Willow St | 0.67mi | 3/1.0 | 1,158 (+10%) | 9mo | $222,000 | $192 | 40 |
| 2031 Pelham St | 0.75mi | 3/1.0 | 968 (-8%) | 13mo | $195,000 | $201 | 36 |
| 3139 Dallas St | 0.66mi | 2/1.0 (-1) | 1,170 (+11%) | 9mo | $220,000 | $188 | 35 |
Match score weights: distance 35% · size 25% · config 20% · recency 20%. Top-matched comps best support the ARV.
Projected returns pro-forma
-3.0% appreciation · 3.57% rent growth · sell at horizon
- IRR
- -16.0%
- Equity multiple
- 0.43×
- Total profit
- $-39,241
- Equity at exit
- $36,515
- IRR
- -6.8%
- Equity multiple
- 0.56×
- Total profit
- $-30,495
- Equity at exit
- $21,174
Cash invested: $68,572 (down + closing). Projections, not guarantees.
Landlord ↔ Tenant lean methodology
- Overall (STATE)
- 62 Landlord-Friendly
- State Michigan
- 62 Landlord-Friendly · EVEN
- County
- — inherits STATE
- City
- — inherits STATE
ZIP-level market 48124
- Rents YoY
- 3.6%
- Active inventory
- 148
- Price-to-rent
- 10.4×
Monthly cashflow live
- Estimated rent
- $1,965 high interval (Pro) →
- Mortgage (P&I)
- −$1,284
- Tax from tax record
- −$176 /mo · $2,111/yr
- Insurance
- −$102
- HOA
- −$0
- Vacancy / Maint / Mgmt
- −$413
- Net cashflow
- $-10
Break-even live
UW: 25.0% down · 7.5% · 30yr · 1.5% tax · 5.0% vac · 8.0% maint · 8.0% mgmt
Financing live
Cash to close
- Down payment
- $61,225
- Closing costs
- $7,347
- Reserves months
- —
- Total cash needed
- —
Loan-product check · same deal, 3 products live
Conventional
25% down · 7.5% · 30yr
- Down + closing
- —
- Monthly P&I
- —
- Monthly cashflow
- —
- DSCR
- —
- Eligible?
- —
Personal DTI + credit; lowest rate.
DSCR
20% down · 8.5% · 30yr
- Down + closing
- —
- Monthly P&I
- —
- Monthly cashflow
- —
- DSCR
- —
- Eligible?
- —
No personal income docs; deal must DSCR.
Hard money
10% down · 12.0% · 12mo
- Down + closing
- —
- Monthly P&I
- —
- Monthly cashflow
- —
- DSCR
- —
- Eligible?
- —
Short-term bridge; refi at stabilization.
Rent comps 7 comps
| Address | Beds | Baths | Sqft | Rent | $/sqft | DOM | Units | Dist |
|---|---|---|---|---|---|---|---|---|
| 2631 Woodside St Dearborn, MI | 3.0 | 1.0 | 894 | $1,650 | $1.85 | 2d | 1 | 0.73mi |
| 4565 Fleming St Dearborn Heights, MI | 3.0 | 1.0 | 1200 | $1,600 | $1.33 | 10d | 1 | 1.11mi |
| 4775 Willow Cove Blvd Allen Park, MI | 1.0–2.0 | 1.0 | 805 | $1,649 | $2.05 | 24d | 4 | 1.34mi |
| 212 Innovation Dr Dearborn, MI | 2.0 | 2.5 | 1360 | $2,850 | $2.10 | 44d | 1 | 1.37mi |
| 20728 Carlysle St Dearborn, MI | 3.0 | 1.0 | 1087 | $1,850 | $1.70 | 2d | 1 | 1.41mi |
| 4631 Ziegler St Dearborn Heights, MI | 3.0 | 1.0 | 1050 | $1,650 | $1.57 | 44d | 1 | 1.41mi |
| 16055 Knollwood Dr Dearborn, MI | 1.0–2.0 | 1.0–2.0 | 1200 | $1,829 | $1.52 | 2d | 4 | 1.41mi |
Listing history 6 events
-
2026-05-19status Pending 325-char remark
Show marketing remark (325 chars)
Check this 3 bedroom full brick Ranch! Popular layout ~ large living room dining room combo, spacious kitchen, hardwood floors, 2 baths, finished basement, thermal pane windows, new furnace & central air, copper plumbing & 2.5 car garage. Seller to provide city certs. This one won't last! Use LB for EZ showings.
-
2026-05-18status Pending
-
2026-05-10historical Accepting Backup Offers 325-char remark
Show marketing remark (325 chars)
Check this 3 bedroom full brick Ranch! Popular layout ~ large living room dining room combo, spacious kitchen, hardwood floors, 2 baths, finished basement, thermal pane windows, new furnace & central air, copper plumbing & 2.5 car garage. Seller to provide city certs. This one won't last! Use LB for EZ showings.
-
2026-05-10historical Active Under Contract
Show marketing remark (325 chars)
Check this 3 bedroom full brick Ranch! Popular layout ~ large living room dining room combo, spacious kitchen, hardwood floors, 2 baths, finished basement, thermal pane windows, new furnace & central air, copper plumbing & 2.5 car garage. Seller to provide city certs. This one won't last! Use LB for EZ showings.
-
2026-05-08$244,900 Active 325-char remark
Show marketing remark (325 chars)
Check this 3 bedroom full brick Ranch! Popular layout ~ large living room dining room combo, spacious kitchen, hardwood floors, 2 baths, finished basement, thermal pane windows, new furnace & central air, copper plumbing & 2.5 car garage. Seller to provide city certs. This one won't last! Use LB for EZ showings.
-
2026-05-08$244,900 Active
Show marketing remark (325 chars)
Check this 3 bedroom full brick Ranch! Popular layout ~ large living room dining room combo, spacious kitchen, hardwood floors, 2 baths, finished basement, thermal pane windows, new furnace & central air, copper plumbing & 2.5 car garage. Seller to provide city certs. This one won't last! Use LB for EZ showings.
ⓘ Source: listings_history table (triggers on properties + properties_extension) + one-shot
backfill from property_details.listing_events for pre-trigger history.
Tax reassessment forecast MI · Partial reset (capped growth)
- Current annual tax
- $2,111 · $176/mo
- Projected year-2 tax
- $2,941 · $245/mo
- Expected delta
- +$830/yr (+$69/mo · 39.3%)
ⓘ Screening estimate from a state-policy table — verify with the county assessor before closing.
Climate risk First Street
- Flood 1/10 Low FEMA zone X (unshaded) · 0% chance over 30 yrs
- Wildfire 1/10 Low
- Heat 3/10 Moderate 7 d/yr ≥97°F today · 15 d/yr by 30 yrs out
- Wind 2/10 Low
- Air quality 3/10 Moderate 2 unhealthy d/yr today · 4 by 30 yrs out
Nearby sold comps map
Loading sold comps map…
Walkable amenities ~0.75 mi
Loading nearby amenities…
Taxation est. · year 1
- Rental income
- $23,578
- − Mortgage interest
- −$13,718
- − Property taxes
- −$2,111
- − Insurance
- −$1,224
- − Repairs & maintenance
- −$1,886
- − Management
- −$1,886
- − Depreciation
- −$7,124
- Taxable loss
- −$4,373
- Est. tax savings @ 24.0%
- +$1,049
- After-tax cash flow
- $929/yr
For passive investors: Depreciation is non-cash, so a rental often shows a tax loss while cash-flowing — sheltering income. Rental losses are passive: they offset passive income freely, and up to $25,000/yr can offset ordinary (W-2) income if you actively participate and your MAGI is under $100k (phasing out to $0 by $150k); unused losses carry forward. On sale, claimed depreciation is recaptured at up to 25%, and gains may owe capital-gains tax (a 1031 exchange can defer both). Figures are a year-1 estimate at your 24.0% rate — not tax advice; consult a CPA.
Schools (NCES district)
- District
- Dearborn City School District
- NCES district ID
- 2611600
- Math proficiency
- 26% ▼ -14.00%
- Reading proficiency
- 39% ▼ -8.00%
- Median HH income
- $46,884
- Composite
- 27.93/100
- National rank
- #6864
- State rank
- #325 of 540 in MI
Livability — Dearborn
- Score
- 80/100
- State rank
- #84
- US rank
- #1904
Category grades
Schools grade is shown separately in the Schools card above.
Census & demographics
- Census place
- Dearborn, MI
- County
- Wayne County · 1,562,939 people
- City population
- 86,476
- Metro
- Detroit-Warren-Dearborn, MI
- Population (ZIP)
- 34,479
- Household income
- $81,796
- Rent vs Own
- Severe rent burden
- 444.0
Population outlook (Wayne County) Hauer SSP2
- Today (2025)
- 1,675,273 people
- By 2030
- 1,620,300 · -3.3%
- By 2040
- 1,502,341 · -10.3%
- By 2050
- 1,384,039 · -17.4%
- By 2075
- 1,124,592 · -32.9%
- By 2100
- 881,193 · -47.4%
Race, ethnicity, and origin ACS 2023
- Neighborhood character
- Predominantly White (84%)
- Race & ethnicity
- White 84% Two or more races 7% Hispanic / Latino 5% Black 4%
- Hispanic origin (detail)
- Mexican 3%
- Common ancestry
- Romanian 12% Lithuanian 4% Slovak 3%
- Foreign-born
- 10% · Canada
- Languages at home
- 82% English-only · Arabic 12% Spanish 2% Other Indo-European 2%
Political lean MEDSL · Wayne
- 2024 margin
- Strong D (+29.0) · D 62.7% · R 33.7% · Other 3.6%
- 2008→2024 swing
- -20.5pp toward R · 2008: 49.5pp · 2024: 29.0pp
- All cycles
- 2024: D+29.0 2020: D+38.1 2016: D+37.3 2012: D+46.9 2008: D+49.5
Not yet ingested
- Civics
- —
Market trends
- HPI YoY
- ▼ -278.39%
- Current HPI
- 204.5229
- Rent YoY
- ▲ 3.57%
- Metro
- Detroit-Warren-Dearborn, MI
- State GDP YoY
- ▲ 1.37%
- F500 in state
- 28
Industry mix (Fortune 500 HQ in MI)
| Industry | F500 HQs | Revenue |
|---|---|---|
| Automotive Parts | 3 | $48B |
|
||
| Automotive | 2 | $372B |
|
||
| Chemicals | 1 | $45B |
|
||
| Automotive Retail | 1 | $29B |
|
||
| Healthcare / Medical Devices | 1 | $23B |
|
||
| Automotive Technology | 1 | $20B |
|
||
Price history
+0.0% since first listed6 events — show timeline
- 2026-05-19 Pending — MiRealSource-MiMLS
- 2026-05-18 Pending — REALCOMP
- 2026-05-10 Contingent — MiRealSource-MiMLS
- 2026-05-10 Contingent — REALCOMP
- 2026-05-08 Listed $244,900 REALCOMP
- 2026-05-08 Listed $244,900 MiRealSource-MiMLS
Property tax history
-0.8%/yrLatest (2025): $2,111 · -13.5% YoY. Source: county tax records.
Cash-flow waterfall
monthlySold comps — $/sqft
last 12 mo · ≤1 miLoading sold comps…