1302 S Main St · Henderson, TX
Flood risk 1/10 · Minimal
- FEMA flood zone
- X (unshaded)
- Chance of flooding over 30 yrs
- 0.0%
- Est. flood insurance / yr
- $507 – $1,088
Fire risk 5/10 · Moderate
- Est. fire insurance / yr
- $1,222 – $2,270
Heat risk 8/10 · Major
- Hot days now (above 110°F)
- 7 days/yr
- Hot days in 30 yrs
- 25 days/yr
Wind risk 6/10 · Moderate
- Chance of severe wind over 30 yrs
- 68.0%
Air-quality risk 1/10 · Minimal
- Unhealthy air days now
- 0 days/yr
- Unhealthy air days in 30 yrs
- 0 days/yr
Risk factors via First Street. Map © Google.
Why this score? — see what drove the B+ grade
The composite is a weighted blend of 9 inputs, each scored 0–100. Each bar is that input's sub-score; the figure is the points it added to the 100-point composite (weight × sub-score).
- Cash flow +30.0/30.0
- 1% rule +10.0/10.0
- DSCR +10.0/10.0
- Appreciation +10.0/10.0
- ARV discount +8.4/15.0
- Livability +3.5/5.0
- Schools +2.8/10.0
- Rent growth +2.5/5.0
- Condition / age +2.5/5.0
$89,000
🖨 Deal sheet 📄 Offer letter ✓ Due diligence
Listing remarks MLS
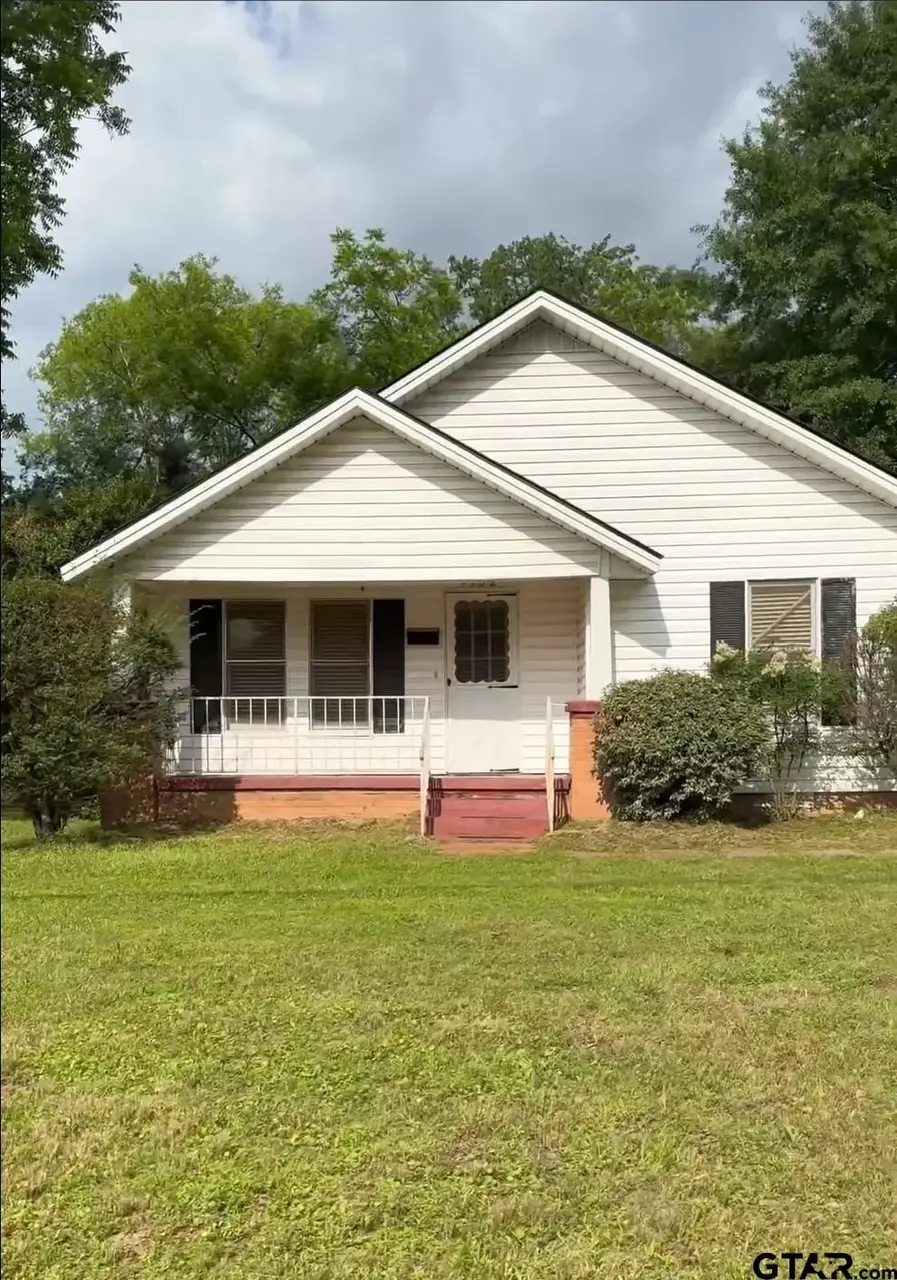
Step into the charm of yesteryear with this 1928-built 3-bedroom, 1-bath home, full of character and ready for your personal touch. The property is framed by mature landscaping that provides shade, privacy, and a welcoming curb appeal. Inside, you’ll find a traditional layout with generously sized rooms and plenty of natural light, offering a solid foundation for updates and improvements. This home does need some maintenance, making it an ideal opportunity for investors, renovators, or buyers looking to customize a home to their own style. Whether you’re envisioning a thoughtful restoration or a complete refresh, this property offers the potential to bring new life to a classic home—all within a convenient in-town location.
Key facts
- Natural light
- Traditional layout
- Mature landscaping
Tags
Property features AI
Exterior
- Parking: Detached garage (1 car); Carport; Paved parking; garage faces front
- Utilities: Public water; Public sewer; Natural gas available
- Home design: Single-family residence; One story
- Construction: Frame construction; Pillar/post/pier foundation; Composition roof
- Exterior features: Partial wood fencing; Level lot; Asphalt road frontage; Storage structure on property
Interior
- Kitchen: Electric range; Electric oven
- Bedrooms: 8 total rooms (includes bedrooms and other living spaces)
- Flooring: Hardwood; Vinyl; Carpet
- Bathrooms: 1 full bathroom
- Heating & cooling: Central heating (electric); Central air conditioning
- Interior features: Gas fireplace with gas log
- Laundry & utility: Gas water heater
Neighborhood map
What this means for you Summary
Snapshot
- This is a 3-bed/1.0-bath single-family listed at $89k.
Deal economics
- At list price, monthly cash flow is $408 ($5k/yr) — positive.
- The deal already cash-flows at list — no discount required.
- Meets the 1% rule at list price ($1k rent vs $89k).
- Recommended offer: $86k (3.0% below list) — sets the bar for market timing.
- Cap rate 11.8% vs local median 2.9% in Henderson — top-decile yield for the area; either an underpriced asset or a hidden risk that comps aren't pricing in. Stress-test before assuming the spread holds.
Location & tenants
- Location reads 69/100 on livability (#408 in TX) — a middle-class / working-renter tenant base. Strengths: cost of living A+, housing A+, health & safety A+; Watch: employment D+, schools D-, crime F.
- Henderson ISD (town): math 30% / reading 35% proficiency, ranked #573 of 826 in TX (top 69%) — families likely to look elsewhere, expect single-tenant / working-renter base with shorter leases.
- Market conditions: 177 active listings in the ZIP; 1 comparable units currently listed for rent nearby; 4 units permitted in Rusk County in 2024 (0 in 5+ unit buildings).
Forward outlook
- In year one you build about $10k of equity ($615 loan paydown + $9k appreciation (10.0% local appreciation)).
- Rusk County population projected to shrink 5% by 2050 — rents likely to lag national; underwrite the cash flow, not the appreciation.
- At projected returns (10.0% appreciation + 3.0% rent growth), your $25k cash investment doubles in ~2 years — after that, you're playing with house money.
- By year 4, paydown + projected appreciation supports a ~$34k cash-out refi (75% LTV) — recoverable capital for the next deal without selling this one.
Negotiation context
- It's been on market 38 days — a 3% lower offer ($86k) is reasonable based on typical stale-listing flexibility.
- 3 sale attempts since 13y ago with the ask held roughly flat each time — persistent listings suggest the price (not the market) is what's stuck; bring a comps-based counter.
Risks & watch-outs
- Watch-outs: built in 1928 — expect roof / HVAC / electrical / plumbing capex.
- Climate carrying-cost: major wind risk, 68% chance of damaging wind over 30y; moderate wildfire risk; extreme-heat days projected 7→25/yr by 2055 (HVAC capex compounding) — expect insurance premiums to compound above CPI over the hold.
Questions for the listing agent
- It's been on market 38 days. Have you received any prior offers? Is the seller open to a 3% concession, seller financing, or rate buy-down credit?
- Built in 1928 — when were the roof, HVAC, electrical panel, plumbing, and water heater last replaced?
- Is there a deadline driving the sale (1031 exchange, divorce, estate, relocation)? That informs how much negotiation room exists.
- Schools are D-rated, which usually means shorter tenancies and higher turnover. Who's the typical renter profile here, and what's been the actual vacancy rate?
- Crime grade is F in this area — have there been break-ins, vandalism, or insurance claims at this property in the last 3 years? What carrier currently insures it and at what premium?
- What's the average days-on-market for RENTAL listings here right now (not sales)? A rising rental-DOM trend means longer vacancies and softer asking-rent achievability than the comps imply.
- What's the recent tenant-quality profile in this submarket — average credit score on applications, eviction rate, late-payment / NSF rate, and stable-employment percentage? A property-management company in the area should have these aggregated.
- How much new for-sale + rental construction is in the pipeline within 1–3 miles? Heavy new supply typically softens prices + rents 12–24 months out; constrained supply supports both.
Investment metrics
- 1% rule
- 1.50% ✓
- Cap rate
- 11.80%
- Cash-on-cash
- 19.66%
- DSCR
- 1.87
- GRM
- 5.6
CMA / ARV
- ARV (median comp)
- $90,840
- List price
- $89,000
- Delta
- -2.03%
- Verdict
- FAIR
- Comps
- 2 within 1.0 mi
Projected returns pro-forma
10.0% appreciation · 3.0% rent growth · sell at horizon
- IRR
- 38.9%
- Equity multiple
- 3.99×
- Total profit
- $74,515
- Equity at exit
- $80,178
- IRR
- 33.6%
- Equity multiple
- 8.99×
- Total profit
- $199,065
- Equity at exit
- $172,907
Cash invested: $24,920 (down + closing). Projections, not guarantees.
Landlord ↔ Tenant lean methodology
- Overall (STATE)
- 87 Strongly Landlord-Friendly
- State Texas
- 87 Strongly Landlord-Friendly · R+5
- County
- — inherits STATE
- City
- — inherits STATE
ZIP-level market 75654
- Home prices YoY
- 7.8%
- Active inventory
- 177
- Price-to-rent
- 5.6×
Monthly cashflow live
- Estimated rent
- $1,336 medium interval (Pro) →
- Mortgage (P&I)
- −$467
- Tax from tax record
- −$143 /mo · $1,720/yr
- Insurance
- −$37
- HOA
- −$0
- Vacancy / Maint / Mgmt
- −$281
- Net cashflow
- $408
Break-even live
UW: 25.0% down · 7.5% · 30yr · 1.5% tax · 5.0% vac · 8.0% maint · 8.0% mgmt
Financing live
Cash to close
- Down payment
- $22,250
- Closing costs
- $2,670
- Reserves months
- —
- Total cash needed
- —
Loan-product check · same deal, 3 products live
Conventional
25% down · 7.5% · 30yr
- Down + closing
- —
- Monthly P&I
- —
- Monthly cashflow
- —
- DSCR
- —
- Eligible?
- —
Personal DTI + credit; lowest rate.
DSCR
20% down · 8.5% · 30yr
- Down + closing
- —
- Monthly P&I
- —
- Monthly cashflow
- —
- DSCR
- —
- Eligible?
- —
No personal income docs; deal must DSCR.
Hard money
10% down · 12.0% · 12mo
- Down + closing
- —
- Monthly P&I
- —
- Monthly cashflow
- —
- DSCR
- —
- Eligible?
- —
Short-term bridge; refi at stabilization.
Rent comps 1 comps
| Address | Beds | Baths | Sqft | Rent | $/sqft | DOM | Units | Dist |
|---|---|---|---|---|---|---|---|---|
| 504 S Van Buren St Henderson, TX | 1.0–2.0 | 1.0 | 832 | $1,336 | $1.60 | 13d | 3 | 0.67mi |
Listing history 20 events
-
2026-06-19days on market $89,000 Active 38 DOM
-
2026-06-18days on market $89,000 Active 37 DOM
-
2026-06-17days on market $89,000 Active 36 DOM
-
2026-06-16days on market $89,000 Active 35 DOM
-
2026-06-15days on market $89,000 Active 34 DOM
-
2026-06-14days on market $89,000 Active 32 DOM
-
2026-06-13days on market $89,000 Active 31 DOM
-
2026-06-10days on market $89,000 Active 29 DOM
-
2026-06-09days on market $89,000 Active 28 DOM
-
2026-06-08days on market $89,000 Active 27 DOM
-
2026-06-07days on market $89,000 Active 26 DOM
-
2026-06-02days on market $89,000 Active 21 DOM
-
2026-06-01days on market $89,000 Active 20 DOM
-
2026-05-31days on market $89,000 Active 19 DOM
-
2026-05-30days on market $89,000 Active 18 DOM
-
2026-05-12$89,000 Active 751-char remark
Show marketing remark (751 chars)
Step into the charm of yesteryear with this 1928-built 3-bedroom, 1-bath home, full of character and ready for your personal touch. The property is framed by mature landscaping that provides shade, privacy, and a welcoming curb appeal. Inside, you’ll find a traditional layout with generously sized rooms and plenty of natural light, offering a solid foundation for updates and improvements. This home does need some maintenance, making it an ideal opportunity for investors, renovators, or buyers looking to customize a home to their own style. Whether you’re envisioning a thoughtful restoration or a complete refresh, this property offers the potential to bring new life to a classic home—all within a convenient in-town location.
-
2014-03-25soldstatus
-
2014-02-14soldstatus
Show marketing remark (128 chars)
Cute 3/1/1C home Ready to Move in! Great Starter Home! Seller is giving a $5,000 allowance for central heating & cooling.
-
2013-08-30$74,900
Show marketing remark (128 chars)
Cute 3/1/1C home Ready to Move in! Great Starter Home! Seller is giving a $5,000 allowance for central heating & cooling.
ⓘ Source: listings_history table (triggers on properties + properties_extension) + one-shot
backfill from property_details.listing_events for pre-trigger history.
Tax reassessment forecast TX · Resets to sale price
- Current annual tax
- $1,720 · $143/mo
- Projected year-2 tax
- $1,720 · $143/mo
- Expected delta
- $0/yr ($0/mo · -0.0%)
ⓘ Screening estimate from a state-policy table — verify with the county assessor before closing.
Climate risk First Street
- Flood 1/10 Low FEMA zone X (unshaded) · 0% chance over 30 yrs
- Wildfire 5/10 Major
- Heat 8/10 Severe 7 d/yr ≥110°F today · 25 d/yr by 30 yrs out
- Wind 6/10 Major 68% chance of damaging wind over 30 yrs
- Air quality 1/10 Low 0 unhealthy d/yr today · 0 by 30 yrs out
Nearby sold comps map
Loading sold comps map…
Walkable amenities ~0.75 mi
Loading nearby amenities…
Taxation est. · year 1
- Rental income
- $16,032
- − Mortgage interest
- −$4,985
- − Property taxes
- −$1,720
- − Insurance
- −$445
- − Repairs & maintenance
- −$1,283
- − Management
- −$1,283
- − Depreciation
- −$2,589
- Taxable income
- $3,727
- Est. tax owed @ 24.0%
- −$895
- After-tax cash flow
- $4,005/yr
For passive investors: Depreciation is non-cash, so a rental often shows a tax loss while cash-flowing — sheltering income. Rental losses are passive: they offset passive income freely, and up to $25,000/yr can offset ordinary (W-2) income if you actively participate and your MAGI is under $100k (phasing out to $0 by $150k); unused losses carry forward. On sale, claimed depreciation is recaptured at up to 25%, and gains may owe capital-gains tax (a 1031 exchange can defer both). Figures are a year-1 estimate at your 24.0% rate — not tax advice; consult a CPA.
Schools (NCES district)
- District
- Henderson ISD
- NCES district ID
- 4822970
- Math proficiency
- 30% ▼ -23.00%
- Reading proficiency
- 35% ▼ -13.00%
- Median HH income
- $46,296
- Composite
- 27.91/100
- National rank
- #6868
- State rank
- #573 of 826 in TX
Livability — Henderson
- Score
- 69/100
- State rank
- #408
- US rank
- #8434
Category grades
Schools grade is shown separately in the Schools card above.
Census & demographics
- Census place
- Henderson, TX
- Population (ZIP)
- 12,184
Population outlook (Rusk County) Hauer SSP2
- Today (2025)
- 52,498 people
- By 2030
- 52,093 · -0.8%
- By 2040
- 50,866 · -3.1%
- By 2050
- 49,696 · -5.3%
- By 2075
- 48,583 · -7.5%
- By 2100
- 43,265 · -17.6%
Race, ethnicity, and origin ACS 2023
- Neighborhood character
- Predominantly White (65%)
- Race & ethnicity
- White 65% Hispanic / Latino 24% Two or more races 16% Black 7%
- Hispanic origin (detail)
- Mexican 20%
- Common ancestry
- Lithuanian 1% Italian 1% Slovak 1%
- Foreign-born
- 11% · Canada
- Languages at home
- 81% English-only · Spanish 18%
Political lean MEDSL · Rusk
- 2024 margin
- Solid R (+59.4) · D 20.0% · R 79.4%
- 2008→2024 swing
- -13.2pp toward R · 2008: -46.3pp · 2024: -59.4pp
- All cycles
- 2024: R+59.4 2020: R+55.7 2016: R+56.5 2012: R+51.1 2008: R+46.3
Not yet ingested
- Civics
- —
Market trends
- HPI YoY
- ▲ 28.83%
- Current HPI
- 397.5
- Rent YoY
- —
- Metro
- —
- State GDP YoY
- ▲ 3.95%
- F500 in state
- 110
Industry mix (Fortune 500 HQ in TX)
| Industry | F500 HQs | Revenue |
|---|---|---|
| Energy | 16 | $1,198B |
|
||
| Technology | 5 | $198B |
|
||
| Engineering / Construction | 4 | $72B |
|
||
| Energy Services | 3 | $60B |
|
||
| Utilities | 3 | $41B |
|
||
| Healthcare | 2 | $330B |
|
||
Price history
+18.8% since first listed6 events — show timeline
- 2026-06-06 Pending — GTAR
- 2026-05-12 Listed $89,000 LAAR
- 2026-05-12 Listed $89,000 GTAR
- 2014-03-25 Sold (Public Records) — Public Records
- 2014-02-14 Sold (MLS) — GTAR
- 2013-08-30 Listed $74,900 GTAR
Property tax history
+2.3%/yrLatest (2025): $1,720 · +3.6% YoY. Source: county tax records.
Cash-flow waterfall
monthlySold comps — $/sqft
last 12 mo · ≤1 miLoading sold comps…