20350 Hole In One · Redding, CA
Flood risk 1/10 · Minimal
- FEMA flood zone
- X (unshaded)
- Chance of flooding over 30 yrs
- 0.0%
- Est. flood insurance / yr
- $507 – $1,088
Fire risk 8/10 · Major
- Est. fire insurance / yr
- $659 – $1,223
Heat risk 8/10 · Major
- Hot days now (above 105°F)
- 5 days/yr
- Hot days in 30 yrs
- 12 days/yr
Wind risk 1/10 · Minimal
- Chance of severe wind over 30 yrs
- —
Air-quality risk 10/10 · Severe
- Unhealthy air days now
- 35 days/yr
- Unhealthy air days in 30 yrs
- 42 days/yr
Risk factors via First Street. Map © Google.
Why this score? — see what drove the D grade
The composite is a weighted blend of 9 inputs, each scored 0–100. Each bar is that input's sub-score; the figure is the points it added to the 100-point composite (weight × sub-score).
- Cash flow +14.7/30.0
- ARV discount +7.5/15.0
- DSCR +4.5/10.0
- 1% rule +4.1/10.0
- Livability +3.8/5.0
- Schools +3.1/10.0
- Rent growth +3.0/5.0
- Condition / age +2.5/5.0
- Appreciation +0.0/10.0
$179,900
🖨 Deal sheet 📄 Offer letter ✓ Due diligence
Listing remarks MLS
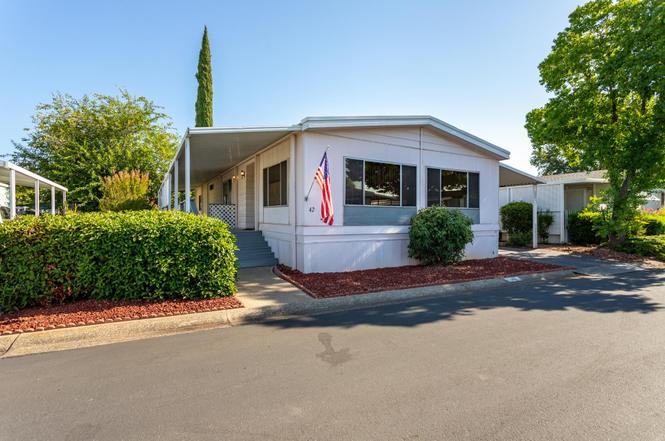
Welcome to this immaculate 2019 manufactured home located in a desirable 55+ community near Tucker Oaks Golf Course. This beautifully maintained 2-bedroom, 2-bath home shines with fresh interior and exterior paint and brand-new flooring throughout, giving it a crisp, modern feel. The open and functional floor plan offers comfortable living spaces, generous natural light, and a layout perfect for both everyday living and hosting guests. Both bedrooms are well-sized, with a private primary suite featuring its own bathroom for added convenience. Enjoy resort-style living with access to the community's clubhouse, swimming pool, and relaxing hot tub, all just moments from your door. The peaceful park setting combined with proximity to golf, shopping, and local amenities makes this an ideal place to enjoy low-maintenance living. Truly move-in ready and meticulously cared for, this home is a rare find, perfect for those looking to downsize without sacrificing comfort or quality.
Key facts
- Community clubhouse
- Relaxing hot tub
- Swimming pool
Tags
Property features AI
Exterior
- Parking: Attached carport; Has carport; Asphalt parking
- Utilities: Public water; Public sewer; Electricity available; Natural gas available
- Home design: Manufactured home (residential); Mobile zoning; City lot; Paved road access; 60' mobile length
- Construction: Metal siding; Foundation: see remarks; Built as a manufactured home
- Exterior features: Rain gutters; Covered patio/porch; Deck; Shed(s)
Interior
- Kitchen: Double oven; Gas cooktop; Range hood; Oven; Dishwasher
- Flooring: Carpet
- Bathrooms: Two full bathrooms
- Heating & cooling: Central heating (natural gas); Central air conditioning
- Interior features: Ceiling fan(s); Walk-in closet(s); Laminate counters; Storm windows; One fireplace
- Laundry & utility: Laundry room with electric and gas dryer hookups; Dryer included
Neighborhood map
What this means for you Summary
Snapshot
- This is a 2-bed/2.0-bath land listed at $180k.
Deal economics
- At list price, monthly cash flow is $47 ($564/yr) — positive.
- The deal already cash-flows at list — no discount required.
- To meet the 1% rule (rent ≥ 1% of price), the offer needs to be $163k (9.2% below list).
- Recommended offer: $163k (9.2% below list) — sets the bar for 1% rule.
- Cap rate 6.6% vs local median 3.3% in Redding — top-decile yield for the area; either an underpriced asset or a hidden risk that comps aren't pricing in. Stress-test before assuming the spread holds.
Location & tenants
- Location reads 76/100 on livability (#106 in CA, #3,726 nationally) — a middle-class / working-renter tenant base. Strengths: amenities A+, commute A+, health & safety A+; Watch: employment C-, crime F, cost of living F.
- Pacheco Union Elementary (rural): math 30% / reading 40% proficiency, ranked #264 of 517 in CA (top 51%) — families likely to look elsewhere, expect single-tenant / working-renter base with shorter leases.
- Market conditions: Rents rising (+1.9%/yr); 286 active listings in the ZIP; 2 comparable units currently listed for rent nearby; 246 units permitted in Shasta County in 2024 (0 in 5+ unit buildings).
Forward outlook
- Local home prices are declining (-3.0%/yr); year-one equity from $1k of loan paydown is wiped out by about $5k of value loss. Plan a longer hold.
- Shasta County population projected to shrink 9% by 2050 — rents likely to lag national; underwrite the cash flow, not the appreciation.
Negotiation context
- It's been on market 118 days — a 9% lower offer ($164k) is reasonable based on typical stale-listing flexibility.
- 25 sale attempts since 13y ago; this cycle's ask is 260% above the opening price — seller raised mid-cycle; expect resistance to lowballs.
- Current owner paid $68k; list at $180k implies a 165% gain — meaningful room to come down on a strong offer.
Risks & watch-outs
- Climate carrying-cost: severe wildfire risk; extreme-heat days projected 5→12/yr by 2055 (HVAC capex compounding) — expect insurance premiums to compound above CPI over the hold.
Questions for the listing agent
- It's been on market 118 days. Have you received any prior offers? Is the seller open to a 9% concession, seller financing, or rate buy-down credit?
- Why hasn't it sold? Are there any deal-killer items the seller is aware of (foundation, flood, title, zoning, code violations)?
- Is there a deadline driving the sale (1031 exchange, divorce, estate, relocation)? That informs how much negotiation room exists.
- Schools are B-rated — typically a magnet for longer-tenancy family renters. What's the average tenant stay here, and is there a school-zone premium baked into asking?
- Crime grade is F in this area — have there been break-ins, vandalism, or insurance claims at this property in the last 3 years? What carrier currently insures it and at what premium?
- The area grade is low — what's the realistic commute time and amenity access for the typical tenant pool here? Any planned neighborhood developments (good or bad) we should know about?
- What's the average days-on-market for RENTAL listings here right now (not sales)? A rising rental-DOM trend means longer vacancies and softer asking-rent achievability than the comps imply.
- What's the recent tenant-quality profile in this submarket — average credit score on applications, eviction rate, late-payment / NSF rate, and stable-employment percentage? A property-management company in the area should have these aggregated.
- How much new for-sale + rental construction is in the pipeline within 1–3 miles? Heavy new supply typically softens prices + rents 12–24 months out; constrained supply supports both.
Investment metrics
- 1% rule
- 0.91% ✗
- Cap rate
- 6.61%
- Cash-on-cash
- 1.12%
- DSCR
- 1.05
- GRM
- 9.2
CMA / ARV
No comps found within radius.
Projected returns pro-forma
-3.0% appreciation · 1.88% rent growth · sell at horizon
- IRR
- -15.8%
- Equity multiple
- 0.45×
- Total profit
- $-27,954
- Equity at exit
- $26,824
- IRR
- -9.4%
- Equity multiple
- 0.45×
- Total profit
- $-27,690
- Equity at exit
- $15,554
Cash invested: $50,372 (down + closing). Projections, not guarantees.
Landlord ↔ Tenant lean methodology
- Overall (STATE)
- 18 Strongly Tenant-Friendly
- State California
- 18 Strongly Tenant-Friendly · D+13
- County
- — inherits STATE
- City
- — inherits STATE
ZIP-level market 96002
- Rents YoY
- 1.9%
- Active inventory
- 286
- Price-to-rent
- 9.2×
Monthly cashflow live
- Estimated rent
- $1,633 medium interval (Pro) →
- Mortgage (P&I)
- −$943
- Tax est. 1.5%
- −$225 /mo · $2,698/yr
- Insurance
- −$75
- HOA
- −$0
- Vacancy / Maint / Mgmt
- −$343
- Net cashflow
- $47
Break-even live
UW: 25.0% down · 7.5% · 30yr · 1.5% tax · 5.0% vac · 8.0% maint · 8.0% mgmt
Financing live
Cash to close
- Down payment
- $44,975
- Closing costs
- $5,397
- Reserves months
- —
- Total cash needed
- —
Loan-product check · same deal, 3 products live
Conventional
25% down · 7.5% · 30yr
- Down + closing
- —
- Monthly P&I
- —
- Monthly cashflow
- —
- DSCR
- —
- Eligible?
- —
Personal DTI + credit; lowest rate.
DSCR
20% down · 8.5% · 30yr
- Down + closing
- —
- Monthly P&I
- —
- Monthly cashflow
- —
- DSCR
- —
- Eligible?
- —
No personal income docs; deal must DSCR.
Hard money
10% down · 12.0% · 12mo
- Down + closing
- —
- Monthly P&I
- —
- Monthly cashflow
- —
- DSCR
- —
- Eligible?
- —
Short-term bridge; refi at stabilization.
Rent comps 2 comps
| Address | Beds | Baths | Sqft | Rent | $/sqft | DOM | Units | Dist |
|---|---|---|---|---|---|---|---|---|
| 6656 Churn Creek Rd Unit M-6656 Redding, CA | 2.0 | 2.0 | 966 | $1,625 | $1.68 | 13d | 1 | 0.68mi |
| 3222 Camellia St Anderson, CA | 2.0 | 1.0 | 740 | $1,400 | $1.89 | 13d | 1 | 1.35mi |
Listing history 50 events
-
2026-06-13status $179,900 Pending 118 DOM
-
2026-06-10days on market $179,900 Active 118 DOM
-
2026-06-09days on market $179,900 Active 117 DOM
-
2026-06-08days on market $179,900 Active 116 DOM
-
2026-06-07days on market $179,900 Active 115 DOM
-
2026-06-05days on market $179,900 Active 112 DOM
-
2026-06-03days on market $179,900 Active 111 DOM
-
2026-06-02days on market $179,900 Active 110 DOM
-
2026-06-01days on market $179,900 Active 109 DOM
-
2026-05-31days on market $179,900 Active 108 DOM
-
2026-05-30days on market $179,900 Active 107 DOM
-
2026-02-18$49,999 Active
-
2026-02-12$179,900 Active 986-char remark
Show marketing remark (986 chars)
Welcome to this immaculate 2019 manufactured home located in a desirable 55+ community near Tucker Oaks Golf Course. This beautifully maintained 2-bedroom, 2-bath home shines with fresh interior and exterior paint and brand-new flooring throughout, giving it a crisp, modern feel. The open and functional floor plan offers comfortable living spaces, generous natural light, and a layout perfect for both everyday living and hosting guests. Both bedrooms are well-sized, with a private primary suite featuring its own bathroom for added convenience. Enjoy resort-style living with access to the community's clubhouse, swimming pool, and relaxing hot tub, all just moments from your door. The peaceful park setting combined with proximity to golf, shopping, and local amenities makes this an ideal place to enjoy low-maintenance living. Truly move-in ready and meticulously cared for, this home is a rare find, perfect for those looking to downsize without sacrificing comfort or quality.
-
2022-07-14soldstatus $68,000
-
2022-05-27$68,000
-
2022-05-24soldstatus $125,000 Closed
-
2022-05-05$125,000
-
2022-05-05historical
-
2021-12-10$124,900
-
2019-11-08soldstatus $82,000
-
2019-07-15$89,900
-
2017-03-17soldstatus $68,500
-
2016-08-11$72,500
-
2016-03-07soldstatus $48,000
-
2016-01-22soldstatus $38,000
-
2015-11-10soldstatus $51,000
-
2015-11-06soldstatus $48,000
-
2015-08-28soldstatus $39,000
-
2015-08-06$50,000
-
2015-07-30soldstatus $56,800
-
2015-06-27$47,000
-
2015-06-24$39,000
-
2015-05-29$59,000
-
2015-04-14soldstatus $40,000
-
2015-03-20soldstatus $35,000
-
2015-03-13soldstatus $27,000
-
2015-02-20$45,000
-
2015-01-31$45,000
-
2015-01-21$49,000
-
2015-01-21$54,900
-
2015-01-12$42,000
-
2014-12-19soldstatus $16,750
-
2014-11-13$15,900
-
2014-11-10$29,900
-
2014-11-01$19,500
-
2014-10-29soldstatus $27,000
-
2014-10-01soldstatus $50,000
-
2014-08-22$65,000
-
2014-07-22soldstatus $29,500
-
2014-06-11$29,750
ⓘ Source: listings_history table (triggers on properties + properties_extension) + one-shot
backfill from property_details.listing_events for pre-trigger history.
Climate risk First Street
- Flood 1/10 Low FEMA zone X (unshaded) · 0% chance over 30 yrs
- Wildfire 8/10 Severe
- Heat 8/10 Severe 5 d/yr ≥105°F today · 12 d/yr by 30 yrs out
- Wind 1/10 Low
- Air quality 10/10 Extreme 35 unhealthy d/yr today · 42 by 30 yrs out
Nearby sold comps map
Loading sold comps map…
Walkable amenities ~0.75 mi
Loading nearby amenities…
Taxation est. · year 1
- Rental income
- $19,599
- − Mortgage interest
- −$10,077
- − Property taxes
- −$2,698
- − Insurance
- −$900
- − Repairs & maintenance
- −$1,568
- − Management
- −$1,568
- − Depreciation
- −$5,233
- Taxable loss
- −$2,446
- Est. tax savings @ 24.0%
- +$587
- After-tax cash flow
- $1,151/yr
For passive investors: Depreciation is non-cash, so a rental often shows a tax loss while cash-flowing — sheltering income. Rental losses are passive: they offset passive income freely, and up to $25,000/yr can offset ordinary (W-2) income if you actively participate and your MAGI is under $100k (phasing out to $0 by $150k); unused losses carry forward. On sale, claimed depreciation is recaptured at up to 25%, and gains may owe capital-gains tax (a 1031 exchange can defer both). Figures are a year-1 estimate at your 24.0% rate — not tax advice; consult a CPA.
Schools (NCES district)
- District
- Pacheco Union Elementary
- NCES district ID
- 0629280
- Math proficiency
- 30% ▼ -7.00%
- Reading proficiency
- 40% ▼ -1.00%
- Median HH income
- $59,905
- Composite
- 31.26/100
- National rank
- #6025
- State rank
- #264 of 517 in CA
Livability — Redding
- Score
- 76/100
- State rank
- #106
- US rank
- #3726
Category grades
Schools grade is shown separately in the Schools card above.
Census & demographics
- Census place
- Redding, CA
- County
- Shasta County · 147,641 people
- City population
- 112,523
- Metro
- Redding, CA
- Population (ZIP)
- 33,783
- Household income
- $73,222
- Rent vs Own
- Severe rent burden
- 1026.0
Population outlook (Shasta County) Hauer SSP2
- Today (2025)
- 179,231 people
- By 2030
- 176,953 · -1.3%
- By 2040
- 169,982 · -5.2%
- By 2050
- 162,547 · -9.3%
- By 2075
- 145,649 · -18.7%
- By 2100
- 123,025 · -31.4%
Race, ethnicity, and origin ACS 2023
- Neighborhood character
- Predominantly White (72%)
- Race & ethnicity
- White 72% Hispanic / Latino 13% Two or more races 12% Asian 6% Native American 2% Black 1%
- Hispanic origin (detail)
- Mexican 10%
- Common ancestry
- Italian 4% Lithuanian 2% Slovak 2%
- Foreign-born
- 5% · Canada
- Languages at home
- 91% English-only · Spanish 4% Other Asian/Pacific 2% Other Indo-European 1%
Political lean MEDSL · Shasta
- 2024 margin
- Solid R (+36.5) · D 30.5% · R 67.0% · Other 2.5%
- 2008→2024 swing
- -10.7pp toward R · 2008: -25.8pp · 2024: -36.5pp
- All cycles
- 2024: R+36.5 2020: R+33.1 2016: R+37.4 2012: R+30.3 2008: R+25.8
Not yet ingested
- Civics
- —
Market trends
- HPI YoY
- ▼ -248.70%
- Current HPI
- 319.713
- Rent YoY
- ▲ 1.88%
- Metro
- Redding, CA
- State GDP YoY
- ▲ 3.21%
- F500 in state
- 116
Industry mix (Fortune 500 HQ in CA)
| Industry | F500 HQs | Revenue |
|---|---|---|
| Technology | 27 | $1,492B |
|
||
| Financial Services | 3 | $174B |
|
||
| Retail | 3 | $44B |
|
||
| Insurance | 3 | $26B |
|
||
| Media / Entertainment | 2 | $115B |
|
||
| Pharmaceuticals / Biotech | 2 | $62B |
|
||
Price history
+138.1% since first listed45 events — show timeline
- 2026-02-18 Listed $49,999 TCAOR
- 2026-02-12 Listed $179,900 TCAOR
- 2022-07-14 Sold (MLS) $68,000 TCAOR
- 2022-05-27 Listed $68,000 TCAOR
- 2022-05-24 Sold (MLS) $125,000 SAOR
- 2022-05-05 Delisted — SAOR
- 2022-05-05 Listed $125,000 SAOR
- 2021-12-10 Listed $124,900 SAOR
- 2019-11-08 Sold (MLS) $82,000 SAOR
- 2019-07-15 Listed $89,900 SAOR
- 2017-03-17 Sold (MLS) $68,500 SAOR
- 2016-08-11 Listed $72,500 SAOR
- 2016-03-07 Sold (MLS) $48,000 SAOR
- 2016-01-22 Sold (MLS) $38,000 SAOR
- 2015-11-10 Sold (MLS) $51,000 SAOR
- 2015-11-06 Sold (MLS) $48,000 SAOR
- 2015-08-28 Sold (MLS) $39,000 SAOR
- 2015-08-06 Listed $50,000 SAOR
- 2015-07-30 Sold (MLS) $56,800 SAOR
- 2015-06-27 Listed $47,000 SAOR
- 2015-06-24 Listed $39,000 SAOR
- 2015-05-29 Listed $59,000 SAOR
- 2015-04-14 Sold (MLS) $40,000 SAOR
- 2015-03-20 Sold (MLS) $35,000 SAOR
- 2015-03-13 Sold (MLS) $27,000 SAOR
- 2015-02-20 Listed $45,000 SAOR
- 2015-01-31 Listed $45,000 SAOR
- 2015-01-21 Listed $54,900 SAOR
- 2015-01-21 Listed $49,000 SAOR
- 2015-01-12 Listed $42,000 SAOR
- 2014-12-19 Sold (MLS) $16,750 SAOR
- 2014-11-13 Listed $15,900 SAOR
- 2014-11-10 Listed $29,900 SAOR
- 2014-11-01 Listed $19,500 SAOR
- 2014-10-29 Sold (MLS) $27,000 SAOR
- 2014-10-01 Sold (MLS) $50,000 SAOR
- 2014-08-22 Listed $65,000 SAOR
- 2014-07-22 Sold (MLS) $29,500 SAOR
- 2014-06-11 Listed $29,750 SAOR
- 2014-05-20 Sold (MLS) $38,500 SAOR
- 2014-04-23 Sold (MLS) $39,500 SAOR
- 2014-04-19 Listed $29,999 SAOR
- 2014-03-05 Listed $39,500 SAOR
- 2014-02-24 Listed $40,000 SAOR
- 2013-07-16 Listed $21,000 SAOR
Property tax history
+67.7%/yrLatest (2024): $32,530 · +2.7% YoY. Source: county tax records.
Cash-flow waterfall
monthlySold comps — $/sqft
last 12 mo · ≤1 miLoading sold comps…