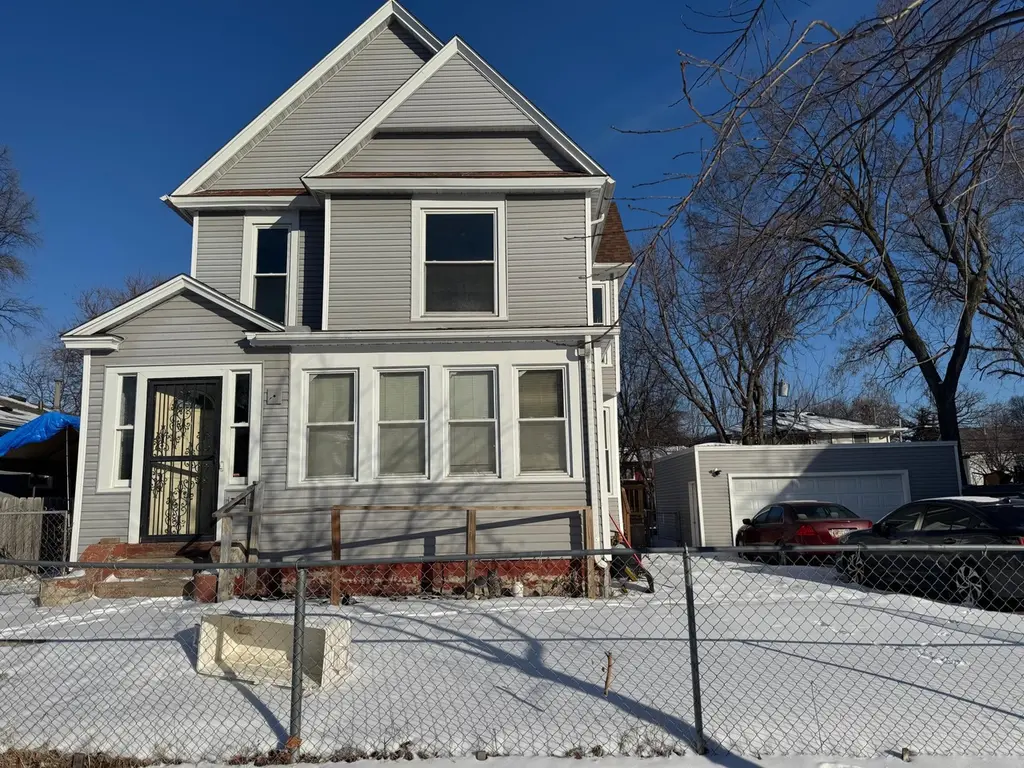
2106 4th Ave N · Minneapolis, MN
Flood risk 3/10 · Minor
- FEMA flood zone
- X (unshaded)
- Chance of flooding over 30 yrs
- 0.2%
- Est. flood insurance / yr
- $473 – $860
Fire risk 1/10 · Minimal
- Est. fire insurance / yr
- $888 – $1,650
Heat risk 2/10 · Minimal
- Hot days now (above 99°F)
- 7 days/yr
- Hot days in 30 yrs
- 14 days/yr
Wind risk 2/10 · Minimal
- Chance of severe wind over 30 yrs
- —
Air-quality risk 2/10 · Minimal
- Unhealthy air days now
- 1 days/yr
- Unhealthy air days in 30 yrs
- 1 days/yr
Risk factors via First Street. Map © Google.
Why this score? — see what drove the D grade
The composite is a weighted blend of 9 inputs, each scored 0–100. Each bar is that input's sub-score; the figure is the points it added to the 100-point composite (weight × sub-score).
- Cash flow +13.6/30.0
- ARV discount +7.5/15.0
- 1% rule +4.1/10.0
- DSCR +4.1/10.0
- Livability +3.9/5.0
- Schools +3.5/10.0
- Rent growth +3.0/5.0
- Condition / age +2.5/5.0
- Appreciation +0.0/10.0
$240,000
🖨 Deal sheet 📄 Offer letter ✓ Due diligence
Listing remarks
Great investment property. Easy to show.
Key facts
- 0.24 acre lot
- 2 garage spots
- Built 1900
Neighborhood map
What this means for you Summary
Snapshot
- This is a 4-bed/2.0-bath other listed at $240k.
Deal economics
- At list price, monthly cash flow is $12 ($141/yr) — positive.
- The deal already cash-flows at list — no discount required.
- To meet the 1% rule (rent ≥ 1% of price), the offer needs to be $219k (8.6% below list).
- Recommended offer: $219k (8.6% below list) — sets the bar for 1% rule.
- Cap rate 6.4% vs local median 3.1% in Minneapolis — top-decile yield for the area; either an underpriced asset or a hidden risk that comps aren't pricing in. Stress-test before assuming the spread holds.
Location & tenants
- Location reads 78/100 on livability (#110 in MN, #2,525 nationally) — a middle-class / working-renter tenant base. Strengths: amenities A+, commute A+, housing A+; Watch: cost of living C-, crime F.
- Minneapolis Public School District (urban): math 35% / reading 46% proficiency, ranked #217 of 301 in MN (top 72%) — families likely to look elsewhere, expect single-tenant / working-renter base with shorter leases.
- Market conditions: Rents rising (+1.9%/yr); 100 active listings in the ZIP; 13 comparable units currently listed for rent nearby; rentals at typical pace (median 15d on market — plan ~3-4 weeks tenant-placement turnaround); 4,651 units permitted in Hennepin County in 2024 (2,443 in 5+ unit buildings).
- This rent runs 36% of the median local income ($73k/yr) — at the standard rent-burdened threshold; future hikes will face affordability resistance.
Forward outlook
- Local home prices are declining (-3.0%/yr); year-one equity from $2k of loan paydown is wiped out by about $7k of value loss. Plan a longer hold.
- Hennepin County population projected at +30% by 2050 — long-run rental-demand tailwind backs the buy-and-hold thesis.
Negotiation context
- It's been on market 15 days — a 2% lower offer ($236k) is reasonable based on typical stale-listing flexibility.
- 8 sale attempts since 33y ago; this cycle's ask has dropped $80k (25%) from the opening price — seller is motivated, your offer sets the floor, not the list.
- Current owner paid $46k; list at $240k implies a 423% gain — meaningful room to come down on a strong offer.
Risks & watch-outs
- Watch-outs: built in 1900 — expect roof / HVAC / electrical / plumbing capex.
Questions for the listing agent
- Built in 1900 — when were the roof, HVAC, electrical panel, plumbing, and water heater last replaced?
- Is there a deadline driving the sale (1031 exchange, divorce, estate, relocation)? That informs how much negotiation room exists.
- Crime grade is F in this area — have there been break-ins, vandalism, or insurance claims at this property in the last 3 years? What carrier currently insures it and at what premium?
- The area grade is low — what's the realistic commute time and amenity access for the typical tenant pool here? Any planned neighborhood developments (good or bad) we should know about?
- What's the average days-on-market for RENTAL listings here right now (not sales)? A rising rental-DOM trend means longer vacancies and softer asking-rent achievability than the comps imply.
- What's the recent tenant-quality profile in this submarket — average credit score on applications, eviction rate, late-payment / NSF rate, and stable-employment percentage? A property-management company in the area should have these aggregated.
- How much new for-sale + rental construction is in the pipeline within 1–3 miles? Heavy new supply typically softens prices + rents 12–24 months out; constrained supply supports both.
Investment metrics
- 1% rule
- 0.91% ✗
- Cap rate
- 6.35%
- Cash-on-cash
- 0.21%
- DSCR
- 1.01
- GRM
- 9.1
CMA / ARV
No comps found within radius.
Projected returns pro-forma
-3.0% appreciation · 1.93% rent growth · sell at horizon
- IRR
- -17.2%
- Equity multiple
- 0.40×
- Total profit
- $-40,407
- Equity at exit
- $35,785
- IRR
- -11.3%
- Equity multiple
- 0.36×
- Total profit
- $-43,316
- Equity at exit
- $20,751
Cash invested: $67,200 (down + closing). Projections, not guarantees.
Landlord ↔ Tenant lean methodology
- Overall (CITY)
- 34 Tenant-Leaning
- State Minnesota
- 46 Balanced · D+2
- County
- — inherits STATE
- City Minneapolis
- 34 Tenant-Leaning · D+50
ZIP-level market 55405
- Rents YoY
- 1.9%
- Active inventory
- 100
- Price-to-rent
- 9.1×
Monthly cashflow live
- Estimated rent
- $2,195 high interval (Pro) →
- Mortgage (P&I)
- −$1,259
- Tax from tax record
- −$363 /mo · $4,360/yr
- Insurance
- −$100
- HOA
- −$0
- Vacancy / Maint / Mgmt
- −$461
- Net cashflow
- $12
Break-even live
UW: 25.0% down · 7.5% · 30yr · 1.5% tax · 5.0% vac · 8.0% maint · 8.0% mgmt
Financing live
Cash to close
- Down payment
- $60,000
- Closing costs
- $7,200
- Reserves months
- —
- Total cash needed
- —
Loan-product check · same deal, 3 products live
Conventional
25% down · 7.5% · 30yr
- Down + closing
- —
- Monthly P&I
- —
- Monthly cashflow
- —
- DSCR
- —
- Eligible?
- —
Personal DTI + credit; lowest rate.
DSCR
20% down · 8.5% · 30yr
- Down + closing
- —
- Monthly P&I
- —
- Monthly cashflow
- —
- DSCR
- —
- Eligible?
- —
No personal income docs; deal must DSCR.
Hard money
10% down · 12.0% · 12mo
- Down + closing
- —
- Monthly P&I
- —
- Monthly cashflow
- —
- DSCR
- —
- Eligible?
- —
Short-term bridge; refi at stabilization.
Rent comps 13 comps
| Address | Beds | Baths | Sqft | Rent | $/sqft | DOM | Units | Dist |
|---|---|---|---|---|---|---|---|---|
| 519 Penn Ave N Minneapolis, MN | 4.0 | 2.0 | 1500 | $2,195 | $1.46 | 14d | 1 | 0.09mi |
| 519 Penn Ave N Minneapolis, MN | 4.0 | 2.0 | 1500 | $2,195 | $1.46 | 7d | 1 | 0.09mi |
| 522 N Newton Ave Unit 1 Minneapolis, MN | 4.0 | 2.0 | 2000 | $2,100 | $1.05 | 43d | 1 | 0.15mi |
| 1611 Glenwood Ave #2 Minneapolis, MN | 3.0 | 2.0 | 1800 | $2,100 | $1.17 | 14d | 1 | 0.33mi |
| 1030 Knox Ave N Apt 3 Minneapolis, MN | 5.0 | 1.5 | 1500 | $2,450 | $1.63 | 43d | 1 | 0.55mi |
| 1239 Knox Ave N Minneapolis, MN | 4.0 | 1.0 | 1944 | $2,400 | $1.23 | 4d | 1 | 0.68mi |
| 1504 Queen Ave N Minneapolis, MN | 3.0 | 1.5 | 1746 | $2,800 | $1.60 | 1d | 1 | 0.85mi |
| 1312 18th Ave N Minneapolis, MN | 3.0 | 1.0 | 1520 | $1,899 | $1.25 | 7d | 1 | 1.18mi |
| 1414 Golden Valley Rd Unit 2 Minneapolis, MN | 5.0 | 2.0 | 2000 | $2,595 | $1.30 | 43d | 1 | 1.26mi |
| 1510 N 22nd Ave #1 Minneapolis, MN | 3.0 | 1.0 | 1500 | $1,875 | $1.25 | 4d | 1 | 1.43mi |
| 1510 N 22nd Ave #1 Minneapolis, MN | 3.0 | 1.0 | 1500 | $1,875 | $1.25 | 21d | 1 | 1.43mi |
| 721 N 3rd St Minneapolis, MN | 3.0 | 1.0–2.0 | 972 | $4,630 | $4.76 | 2d | 10 | 1.46mi |
| 2324 Logan Ave N Minneapolis, MN | 4.0 | 1.5 | 1400 | $2,300 | $1.64 | 44d | 1 | 1.47mi |
Listing history 27 events
-
2026-06-16days on market $240,000 Active 15 DOM
-
2026-06-15days on market $240,000 Active 14 DOM
-
2026-06-13days on market $240,000 Active 12 DOM
-
2026-06-09days on market $240,000 Active 8 DOM
-
2026-06-08days on market $240,000 Active 7 DOM
-
2026-06-07days on market $240,000 Active 6 DOM
-
2026-06-04days on market $240,000 Active 3 DOM
-
2026-06-03days on market $240,000 Active 2 DOM
-
2026-06-02pricestatusdays on market $240,000 Active 1 DOM
-
2026-04-27status Pending
-
2026-04-22price $250,000
-
2026-02-09$320,000 Active
-
2007-04-02historical
-
2007-03-20$200,000
-
2007-02-09historical
-
2006-08-10$199,900
-
2006-07-25historical
-
2006-07-01$199,900
-
2006-06-30historical
-
2006-02-13$199,900
-
1996-02-15soldstatus $45,900
-
1995-12-18historical
-
1995-08-29$45,900
-
1995-08-20historical
-
1995-05-03$48,800
-
1994-04-15historical
-
1993-08-25$65,800
ⓘ Source: listings_history table (triggers on properties + properties_extension) + one-shot
backfill from property_details.listing_events for pre-trigger history.
Tax reassessment forecast MN · Partial reset (capped growth)
- Current annual tax
- $4,360 · $363/mo
- Projected year-2 tax
- $4,360 · $363/mo
- Expected delta
- $0/yr ($0/mo · 0.0%)
ⓘ Screening estimate from a state-policy table — verify with the county assessor before closing.
Climate risk First Street
- Flood 3/10 Moderate FEMA zone X (unshaded) · 20% chance over 30 yrs
- Wildfire 1/10 Low
- Heat 2/10 Low 7 d/yr ≥99°F today · 14 d/yr by 30 yrs out
- Wind 2/10 Low
- Air quality 2/10 Low 1 unhealthy d/yr today · 1 by 30 yrs out
Nearby sold comps map
Loading sold comps map…
Walkable amenities ~0.75 mi
Loading nearby amenities…
Taxation est. · year 1
- Rental income
- $26,335
- − Mortgage interest
- −$13,444
- − Property taxes
- −$4,360
- − Insurance
- −$1,200
- − Repairs & maintenance
- −$2,107
- − Management
- −$2,107
- − Depreciation
- −$6,982
- Taxable loss
- −$3,865
- Est. tax savings @ 24.0%
- +$927
- After-tax cash flow
- $1,069/yr
For passive investors: Depreciation is non-cash, so a rental often shows a tax loss while cash-flowing — sheltering income. Rental losses are passive: they offset passive income freely, and up to $25,000/yr can offset ordinary (W-2) income if you actively participate and your MAGI is under $100k (phasing out to $0 by $150k); unused losses carry forward. On sale, claimed depreciation is recaptured at up to 25%, and gains may owe capital-gains tax (a 1031 exchange can defer both). Figures are a year-1 estimate at your 24.0% rate — not tax advice; consult a CPA.
Schools (NCES district)
- District
- Minneapolis Public School District
- NCES district ID
- 2721240
- Math proficiency
- 35% ▼ -7.00%
- Reading proficiency
- 46% ▼ -1.00%
- Median HH income
- $50,521
- Composite
- 34.92/100
- National rank
- #5067
- State rank
- #217 of 301 in MN
Livability — Minneapolis
- Score
- 78/100
- State rank
- #110
- US rank
- #2525
Category grades
Schools grade is shown separately in the Schools card above.
Census & demographics
- Census place
- Minneapolis, MN
- County
- Hennepin County · 1,150,272 people
- City population
- 417,555
- Metro
- Minneapolis-St. Paul-Bloomington, MN-WI
- Population (ZIP)
- 17,198
- Household income
- $73,053
- Rent vs Own
- Severe rent burden
- 985.0
Population outlook (Hennepin County) Hauer SSP2
- Today (2025)
- 1,405,227 people
- By 2030
- 1,492,650 · +6.2%
- By 2040
- 1,660,157 · +18.1%
- By 2050
- 1,823,498 · +29.8%
- By 2075
- 2,221,283 · +58.1%
- By 2100
- 2,509,976 · +78.6%
Race, ethnicity, and origin ACS 2023
- Neighborhood character
- Diverse neighborhood (Simpson 0.58)
- Race & ethnicity
- White 59% Black 25% Two or more races 7% Hispanic / Latino 5% Asian 4% Native American 2%
- Hispanic origin (detail)
- Mexican 2%
- Common ancestry
- Portuguese 9% Romanian 4% Lithuanian 2%
- Foreign-born
- 10% · Canada, South Korea, Jamaica
- Languages at home
- 81% English-only · Spanish 3% Other Asian/Pacific 2% French/Haitian/Cajun 1%
Political lean MEDSL · Hennepin
- 2024 margin
- Solid D (+42.6) · D 70.2% · R 27.5% · Other 2.3%
- 2008→2024 swing
- +14.0pp toward D · 2008: 28.6pp · 2024: 42.6pp
- All cycles
- 2024: D+42.6 2020: D+43.2 2016: D+35.3 2012: D+27.1 2008: D+28.6
Not yet ingested
- Civics
- —
Market trends
- HPI YoY
- ▼ -282.04%
- Current HPI
- 242.8961
- Rent YoY
- ▲ 1.93%
- Metro
- Minneapolis-St. Paul-Bloomington, MN-WI
- State GDP YoY
- ▲ 2.41%
- F500 in state
- 34
Industry mix (Fortune 500 HQ in MN)
| Industry | F500 HQs | Revenue |
|---|---|---|
| Healthcare | 2 | $407B |
|
||
| Retail | 2 | $150B |
|
||
| Consumer Goods | 2 | $32B |
|
||
| Industrial Machinery | 2 | $6B |
|
||
| Agriculture | 1 | $40B |
|
||
| Healthcare / Medical Devices | 1 | $32B |
|
||
Price history
+279.9% since first listed18 events — show timeline
- 2026-04-27 Pending — NORTHSTARMLS as Distributed by MLS Grid
- 2026-04-22 Price Changed $250,000 NORTHSTARMLS as Distributed by MLS Grid
- 2026-02-09 Listed $320,000 NORTHSTARMLS as Distributed by MLS Grid
- 2007-04-02 Listing Removed — NORTHSTARMLS as Distributed by MLS Grid
- 2007-03-20 Listed $200,000 NORTHSTARMLS as Distributed by MLS Grid
- 2007-02-09 Listing Removed — NORTHSTARMLS as Distributed by MLS Grid
- 2006-08-10 Listed $199,900 NORTHSTARMLS as Distributed by MLS Grid
- 2006-07-25 Listing Removed — NORTHSTARMLS as Distributed by MLS Grid
- 2006-07-01 Listed $199,900 NORTHSTARMLS as Distributed by MLS Grid
- 2006-06-30 Listing Removed — NORTHSTARMLS as Distributed by MLS Grid
- 2006-02-13 Listed $199,900 NORTHSTARMLS as Distributed by MLS Grid
- 1996-02-15 Sold (MLS) $45,900 NORTHSTARMLS as Distributed by MLS Grid
- 1995-12-18 Listing Removed — NORTHSTARMLS as Distributed by MLS Grid
- 1995-08-29 Listed $45,900 NORTHSTARMLS as Distributed by MLS Grid
- 1995-08-20 Listing Removed — NORTHSTARMLS as Distributed by MLS Grid
- 1995-05-03 Listed $48,800 NORTHSTARMLS as Distributed by MLS Grid
- 1994-04-15 Listing Removed — NORTHSTARMLS as Distributed by MLS Grid
- 1993-08-25 Listed $65,800 NORTHSTARMLS as Distributed by MLS Grid
Property tax history
+6.9%/yrLatest (2025): $4,360 · +3.3% YoY. Source: county tax records.
Cash-flow waterfall
monthlySold comps — $/sqft
last 12 mo · ≤1 miLoading sold comps…