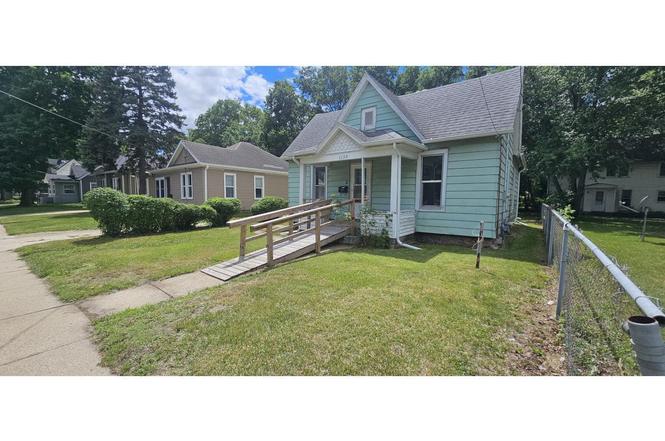
1130 6th St · Beloit, WI
Flood risk 1/10 · Minimal
- FEMA flood zone
- X (unshaded)
- Chance of flooding over 30 yrs
- 0.0%
- Est. flood insurance / yr
- $507 – $1,088
Fire risk 1/10 · Minimal
- Est. fire insurance / yr
- $636 – $1,182
Heat risk 2/10 · Minimal
- Hot days now (above 101°F)
- 7 days/yr
- Hot days in 30 yrs
- 14 days/yr
Wind risk 2/10 · Minimal
- Chance of severe wind over 30 yrs
- —
Air-quality risk 3/10 · Minor
- Unhealthy air days now
- 2 days/yr
- Unhealthy air days in 30 yrs
- 3 days/yr
Risk factors via First Street. Map © Google.
Why this score? — see what drove the C- grade
The composite is a weighted blend of 9 inputs, each scored 0–100. Each bar is that input's sub-score; the figure is the points it added to the 100-point composite (weight × sub-score).
- Cash flow +20.3/30.0
- ARV discount +7.5/15.0
- DSCR +6.4/10.0
- 1% rule +5.2/10.0
- Rent growth +4.0/5.0
- Livability +3.5/5.0
- Condition / age +2.5/5.0
- Schools +0.9/10.0
- Appreciation +0.0/10.0
$114,900
🖨 Deal sheet 📄 Offer letter ✓ Due diligence
Listing remarks
Calling all investors, landlords, and DIY enthusiasts! This affordable fixer-upper offers tremendous potential and is ready for your vision and personal touch. Whether you're looking for your next rental property, fix-and-flip project, or an affordable home to renovate, this property presents an excellent opportunity. Featuring 2 spacious bedrooms with the potential to create a 3rd bedroom, this home offers flexible living space to maximize value and rental income. The property includes a full bathroom, a detached 1-car garage, and a functional layout with plenty of possibilities for improvement. Conveniently located near schools, shopping, restaurants, and recreation, you'll appreciate bei
Key facts
- Near schools
- Near shopping
- Near restaurants
Tags
Property features AI
Finance
- Other: Inclusions: refrigerator, range
Exterior
- Parking: Detached 1-car garage
- Utilities: Municipal water; Municipal sewer; Natural gas
- Home design: Single-family home; One story; Finished above-grade area approximately in the 1001–1250 sq ft range
- Construction: Information source for year built: Assessor/Public Record
- Exterior features: Aluminum/steel exterior; Lot approximately 0.13 acre; Residential zoning
Interior
- Kitchen: Range/Oven; Refrigerator; Kitchen located on the main level (13 x 13)
- Bedrooms: Master bedroom on the main level (13 x 11); Second bedroom on the main level (11 x 11); Additional main-level room (11 x 10)
- Bathrooms: One full bathroom; Bathroom includes at least one tub; No master bathroom
- Heating & cooling: Forced air heating (natural gas)
- Interior features: Great room; Partial basement
Neighborhood map
What this means for you Summary
Snapshot
- This is a 2-bed/1.0-bath other listed at $115k.
Deal economics
- At list price, monthly cash flow is $147 ($2k/yr) — positive.
- The deal already cash-flows at list — no discount required.
- Meets the 1% rule at list price ($1k rent vs $115k).
- Cap rate 7.8% vs local median 3.5% in Beloit — top-decile yield for the area; either an underpriced asset or a hidden risk that comps aren't pricing in. Stress-test before assuming the spread holds.
Location & tenants
- Location reads 70/100 on livability (#283 in WI) — a middle-class / working-renter tenant base. Strengths: cost of living A+, housing A+, health & safety A+; Watch: crime D, amenities F, commute F.
- Beloit School District (urban): math 8% / reading 13% proficiency, ranked #339 of 342 in WI (top 99%) — low school quality limits family demand, transient renter base, plan for 1-2y turnover; 70% free/reduced lunch — lower-income household profile, screen leases tightly.
- Zoned schools: Converse Elementary (math 22% / reading 22%, grade F, #823 of 1,041 statewide, top 82%, 317 students, 75% FRL); Memorial High (math 8% / reading 14%, grade F, #438 of 483 statewide, top 91%, 1,417 students, 66% FRL) — zoned schools at 71% FRL track the district average.
- Market conditions: Rents rising fast (+6.0%/yr); 202 active listings in the ZIP; 9 comparable units currently listed for rent nearby; rentals leasing fast (median 13d on market — plan ~1-2 weeks tenant-placement turnaround); 629 units permitted in Rock County in 2024 (263 in 5+ unit buildings).
Forward outlook
- Local home prices are declining (-3.0%/yr); year-one equity from $794 of loan paydown is wiped out by about $3k of value loss. Plan a longer hold.
- Rock County population projected to shrink 7% by 2050 — rents likely to lag national; underwrite the cash flow, not the appreciation.
Negotiation context
- Only 1 days on market — expect competitive offers; lowballing is unlikely to land.
Risks & watch-outs
- Watch-outs: built in 1883 — expect roof / HVAC / electrical / plumbing capex.
Questions for the listing agent
- Built in 1883 — when were the roof, HVAC, electrical panel, plumbing, and water heater last replaced?
- Is there a deadline driving the sale (1031 exchange, divorce, estate, relocation)? That informs how much negotiation room exists.
- Schools are F-rated, which usually means shorter tenancies and higher turnover. Who's the typical renter profile here, and what's been the actual vacancy rate?
- Crime grade is D in this area — have there been break-ins, vandalism, or insurance claims at this property in the last 3 years? What carrier currently insures it and at what premium?
- What's the average days-on-market for RENTAL listings here right now (not sales)? A rising rental-DOM trend means longer vacancies and softer asking-rent achievability than the comps imply.
- What's the recent tenant-quality profile in this submarket — average credit score on applications, eviction rate, late-payment / NSF rate, and stable-employment percentage? A property-management company in the area should have these aggregated.
- How much new for-sale + rental construction is in the pipeline within 1–3 miles? Heavy new supply typically softens prices + rents 12–24 months out; constrained supply supports both.
Investment metrics
- 1% rule
- 1.02% ✓
- Cap rate
- 7.83%
- Cash-on-cash
- 5.48%
- DSCR
- 1.24
- GRM
- 8.2
CMA / ARV
No comps found within radius.
Projected returns pro-forma
-3.0% appreciation · 6.05% rent growth · sell at horizon
- IRR
- -4.5%
- Equity multiple
- 0.83×
- Total profit
- $-5,543
- Equity at exit
- $17,132
- IRR
- 8.4%
- Equity multiple
- 1.73×
- Total profit
- $23,455
- Equity at exit
- $9,934
Cash invested: $32,172 (down + closing). Projections, not guarantees.
Landlord ↔ Tenant lean methodology
- Overall (STATE)
- 73 Landlord-Friendly
- State Wisconsin
- 73 Landlord-Friendly · R+2
- County
- — inherits STATE
- City
- — inherits STATE
ZIP-level market 53511
- Home prices YoY
- -26.9%
- Rents YoY
- 6.0%
- Active inventory
- 202
- Price-to-rent
- 8.2×
Monthly cashflow live
- Estimated rent
- $1,172 high interval (Pro) →
- Mortgage (P&I)
- −$603
- Tax from tax record
- −$129 /mo · $1,542/yr
- Insurance
- −$48
- HOA
- −$0
- Vacancy / Maint / Mgmt
- −$246
- Net cashflow
- $147
Break-even live
UW: 25.0% down · 7.5% · 30yr · 1.5% tax · 5.0% vac · 8.0% maint · 8.0% mgmt
Financing live
Cash to close
- Down payment
- $28,725
- Closing costs
- $3,447
- Reserves months
- —
- Total cash needed
- —
Loan-product check · same deal, 3 products live
Conventional
25% down · 7.5% · 30yr
- Down + closing
- —
- Monthly P&I
- —
- Monthly cashflow
- —
- DSCR
- —
- Eligible?
- —
Personal DTI + credit; lowest rate.
DSCR
20% down · 8.5% · 30yr
- Down + closing
- —
- Monthly P&I
- —
- Monthly cashflow
- —
- DSCR
- —
- Eligible?
- —
No personal income docs; deal must DSCR.
Hard money
10% down · 12.0% · 12mo
- Down + closing
- —
- Monthly P&I
- —
- Monthly cashflow
- —
- DSCR
- —
- Eligible?
- —
Short-term bridge; refi at stabilization.
Rent comps 9 comps
| Address | Beds | Baths | Sqft | Rent | $/sqft | DOM | Units | Dist |
|---|---|---|---|---|---|---|---|---|
| 1023 Hackett St Beloit, WI | 2.0 | 1.0 | 926 | $1,200 | $1.30 | 43d | 1 | 0.54mi |
| 532 Lawton Ave Beloit, WI | 2.0 | 1.0 | 872 | $1,220 | $1.40 | 13d | 5 | 0.57mi |
| 205 Birch Ave Unit 2 Beloit, WI | 2.0 | 1.0 | 1288 | $1,000 | $0.78 | 13d | 1 | 0.68mi |
| 206 Carpenter St Unit 3 Beloit, WI | 2.0 | 1.0 | 1400 | $1,000 | $0.71 | 13d | 1 | 0.71mi |
| 430 E Grand Ave Beloit, WI | 1.0–2.0 | 1.0 | 934 | $1,835 | $1.96 | 13d | 4 | 0.92mi |
| 614 Broad St Unit 231 Beloit, WI | 1.0 | 1.0 | 800 | $895 | $1.12 | 13d | 1 | 1.09mi |
| 614 Broad St Unit 103 Beloit, WI | 1.0 | 1.0 | 800 | $895 | $1.12 | 43d | 1 | 1.09mi |
| 614 Broad St Unit 226 Beloit, WI | 2.0 | 2.0 | 1125 | $1,195 | $1.06 | 13d | 1 | 1.09mi |
| 124 Miller St South Beloit, IL | 2.0 | 1.0 | 850 | $1,500 | $1.76 | 13d | 1 | 1.25mi |
Listing history 2 events
-
2026-06-18remarks 699-char remark
-
2026-06-18$114,900 Active 1 DOM
ⓘ Source: listings_history table (triggers on properties + properties_extension) + one-shot
backfill from property_details.listing_events for pre-trigger history.
Tax reassessment forecast WI · Partial reset (capped growth)
- Current annual tax
- $1,542 · $129/mo
- Projected year-2 tax
- $1,834 · $153/mo
- Expected delta
- +$292/yr (+$24/mo · 18.9%)
ⓘ Screening estimate from a state-policy table — verify with the county assessor before closing.
Climate risk First Street
- Flood 1/10 Low FEMA zone X (unshaded) · 0% chance over 30 yrs
- Wildfire 1/10 Low
- Heat 2/10 Low 7 d/yr ≥101°F today · 14 d/yr by 30 yrs out
- Wind 2/10 Low
- Air quality 3/10 Moderate 2 unhealthy d/yr today · 3 by 30 yrs out
Nearby sold comps map
Loading sold comps map…
Walkable amenities ~0.75 mi
Loading nearby amenities…
Taxation est. · year 1
- Rental income
- $14,065
- − Mortgage interest
- −$6,436
- − Property taxes
- −$1,542
- − Insurance
- −$574
- − Repairs & maintenance
- −$1,125
- − Management
- −$1,125
- − Depreciation
- −$3,343
- Taxable loss
- −$81
- Est. tax savings @ 24.0%
- +$20
- After-tax cash flow
- $1,783/yr
For passive investors: Depreciation is non-cash, so a rental often shows a tax loss while cash-flowing — sheltering income. Rental losses are passive: they offset passive income freely, and up to $25,000/yr can offset ordinary (W-2) income if you actively participate and your MAGI is under $100k (phasing out to $0 by $150k); unused losses carry forward. On sale, claimed depreciation is recaptured at up to 25%, and gains may owe capital-gains tax (a 1031 exchange can defer both). Figures are a year-1 estimate at your 24.0% rate — not tax advice; consult a CPA.
Schools (NCES district)
- District
- Beloit School District
- NCES district ID
- 5501050
- Math proficiency
- 8% ▼ -10.00%
- Reading proficiency
- 13% ▼ -5.00%
- Median HH income
- $37,328
- Composite
- 8.81/100
- National rank
- #9890
- State rank
- #339 of 342 in WI
Livability — Beloit
- Score
- 70/100
- State rank
- #283
- US rank
- #7336
Category grades
Schools grade is shown separately in the Schools card above.
Census & demographics
- Census place
- Beloit, WI
- County
- Rock County · 135,428 people
- City population
- 48,701
- Metro
- Janesville-Beloit, WI
- Population (ZIP)
- 48,701
- Household income
- $67,067
- Rent vs Own
- Severe rent burden
- 1341.0
Population outlook (Rock County) Hauer SSP2
- Today (2025)
- 163,403 people
- By 2030
- 162,815 · -0.4%
- By 2040
- 158,655 · -2.9%
- By 2050
- 151,235 · -7.4%
- By 2075
- 131,901 · -19.3%
- By 2100
- 108,665 · -33.5%
Race, ethnicity, and origin ACS 2023
- Neighborhood character
- Majority White (64%)
- Race & ethnicity
- White 64% Hispanic / Latino 19% Two or more races 14% Black 11% Asian 1%
- Hispanic origin (detail)
- Mexican 15% Dominican 1%
- Common ancestry
- Portuguese 8% Romanian 3% Lithuanian 2%
- Foreign-born
- 9% · Canada
- Languages at home
- 85% English-only · Spanish 14%
Political lean MEDSL · Rock
- 2024 margin
- Lean D (+7.3) · D 52.9% · R 45.6% · Other 1.4%
- 2008→2024 swing
- -22.0pp toward R · 2008: 29.3pp · 2024: 7.3pp
- All cycles
- 2024: D+7.3 2020: D+11.2 2016: D+10.5 2012: D+23.2 2008: D+29.3
Not yet ingested
- Civics
- —
Market trends
- HPI YoY
- ▼ -115.19%
- Current HPI
- 312.6591
- Rent YoY
- ▲ 6.05%
- Metro
- Janesville-Beloit, WI
- State GDP YoY
- ▲ 2.10%
- F500 in state
- 20
Industry mix (Fortune 500 HQ in WI)
| Industry | F500 HQs | Revenue |
|---|---|---|
| Industrial Machinery | 4 | $23B |
|
||
| Industrial Technology | 2 | $36B |
|
||
| Insurance | 1 | $36B |
|
||
| Professional Services | 1 | $19B |
|
||
| Utilities | 1 | $9B |
|
||
| Consumer Goods | 1 | $3B |
|
||
Price history
1 event — show timeline
- 2026-06-18 Listed $114,900 SCWMLS
Property tax history
+7.4%/yrLatest (2025): $1,542 · +34.3% YoY. Source: county tax records.
Cash-flow waterfall
monthlySold comps — $/sqft
last 12 mo · ≤1 miLoading sold comps…