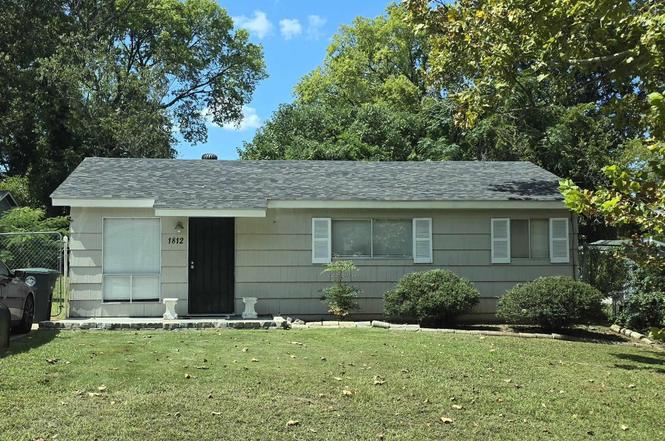
1812 3rd Pl SW · Birmingham, AL
Flood risk 1/10 · Minimal
- FEMA flood zone
- X (unshaded)
- Chance of flooding over 30 yrs
- 0.0%
- Est. flood insurance / yr
- $507 – $1,088
Fire risk 1/10 · Minimal
- Est. fire insurance / yr
- $916 – $1,700
Heat risk 7/10 · Major
- Hot days now (above 105°F)
- 7 days/yr
- Hot days in 30 yrs
- 19 days/yr
Wind risk 6/10 · Moderate
- Chance of severe wind over 30 yrs
- 27.0%
Air-quality risk 4/10 · Minor
- Unhealthy air days now
- 6 days/yr
- Unhealthy air days in 30 yrs
- 8 days/yr
Risk factors via First Street. Map © Google.
Why this score? — see what drove the C- grade
The composite is a weighted blend of 9 inputs, each scored 0–100. Each bar is that input's sub-score; the figure is the points it added to the 100-point composite (weight × sub-score).
- Cash flow +24.5/30.0
- DSCR +7.9/10.0
- ARV discount +6.0/15.0
- 1% rule +5.8/10.0
- Livability +3.4/5.0
- Rent growth +2.5/5.0
- Condition / age +2.5/5.0
- Schools +0.9/10.0
- Appreciation +0.0/10.0
$99,900
🖨 Deal sheet (PDF) 📄 Offer letter ✓ Due diligence
Listing remarks MLS
Attention investors! This is a great investment opportunity! This home is currently rented section 8 for $750 per month which means income right away! This features 3 bedrooms, 1 bath, eat in kitchen, front porch and a fenced in back yard. This one won't last long as with 100% Section 8 you don't have to worry about from where or when your rent check is coming.
Key facts
- Remodeled kitchen
- Turn-key property
- New interior paint
Tags
Neighborhood map
What this means for you Summary
Snapshot
- This is a 2-bed/1.0-bath single-family listed at $100k.
Deal economics
- At list price, monthly cash flow is $204 ($2k/yr) — positive.
- The deal already cash-flows at list — no discount required.
- Meets the 1% rule at list price ($1k rent vs $100k).
- Recommended offer: $98k (1.5% below list) — sets the bar for market timing.
- Cap rate 8.7% vs local median 6.2% in Birmingham — top-decile yield for the area; either an underpriced asset or a hidden risk that comps aren't pricing in. Stress-test before assuming the spread holds.
Location & tenants
- Location reads 67/100 on livability (#78 in AL) — a middle-class / working-renter tenant base. Strengths: commute A+, cost of living A+, housing A+; Watch: amenities C-, crime F, employment F.
- Birmingham City (urban): math 4% / reading 20% proficiency, ranked #116 of 129 in AL (top 90%) — low school quality limits family demand, transient renter base, plan for 1-2y turnover; 82% free/reduced lunch — lower-income household profile, screen leases tightly.
- Zoned schools: Washington K8 (math 5% / reading 18%, grade F, #556 of 627 statewide, top 89%, 567 students, 92% FRL); Parker High School (math 2% / reading 2%, grade F, #291 of 305 statewide, top 100%, 826 students, 90% FRL).
- Market conditions: Rents soft (-0.0%/yr); 154 active listings in the ZIP; 36 comparable units currently listed for rent nearby; rentals at typical pace (median 25d on market — plan ~3-4 weeks tenant-placement turnaround); 42% of comp listings sitting > 30 days — soft ceiling on asking rent; lower-income renter base — watch delinquency; 2,114 units permitted in Jefferson County in 2024 (556 in 5+ unit buildings).
- This rent runs 37% of the median local income ($35k/yr) — at the standard rent-burdened threshold; future hikes will face affordability resistance.
Forward outlook
- Local home prices are declining (-3.0%/yr); year-one equity from $691 of loan paydown is wiped out by about $3k of value loss. Plan a longer hold.
- Jefferson County population projected to shrink 4% by 2050 — rents likely to lag national; underwrite the cash flow, not the appreciation.
Negotiation context
- It's been on market 17 days — a 2% lower offer ($98k) is reasonable based on typical stale-listing flexibility.
- 3 sale attempts since 5y ago with the ask held roughly flat each time — persistent listings suggest the price (not the market) is what's stuck; bring a comps-based counter.
Risks & watch-outs
- Climate carrying-cost: major wind risk, 27% chance of damaging wind over 30y; extreme-heat days projected 7→19/yr by 2055 (HVAC capex compounding) — expect insurance premiums to compound above CPI over the hold.
Questions for the listing agent
- Built in 1960 — when were the roof, HVAC, electrical panel, plumbing, and water heater last replaced?
- Is there a deadline driving the sale (1031 exchange, divorce, estate, relocation)? That informs how much negotiation room exists.
- Schools are F-rated, which usually means shorter tenancies and higher turnover. Who's the typical renter profile here, and what's been the actual vacancy rate?
- Crime grade is F in this area — have there been break-ins, vandalism, or insurance claims at this property in the last 3 years? What carrier currently insures it and at what premium?
- What's the average days-on-market for RENTAL listings here right now (not sales)? A rising rental-DOM trend means longer vacancies and softer asking-rent achievability than the comps imply.
- What's the recent tenant-quality profile in this submarket — average credit score on applications, eviction rate, late-payment / NSF rate, and stable-employment percentage? A property-management company in the area should have these aggregated.
- How much new for-sale + rental construction is in the pipeline within 1–3 miles? Heavy new supply typically softens prices + rents 12–24 months out; constrained supply supports both.
Investment metrics
- 1% rule
- 1.08% ✓
- Cap rate
- 8.75%
- Cash-on-cash
- 8.76%
- DSCR
- 1.39
- GRM
- 7.7
CMA / ARV
- ARV (on-the-fly)
- $96,768
- Comps found
- 7
Show comp detail 7 sales within ~0.75 mi
| Address | Dist | Beds/Ba | Sqft | Sold | Price | $/sf | Match |
|---|---|---|---|---|---|---|---|
| 1721 SW 3rd Pl | 0.08mi | 3/1.0 (+1) | 880 (+2%) | 12mo | $80,000 | $91 | 78 |
| 1512 Mccary St SW | 0.32mi | 3/1.0 (+1) | 884 (+2%) | 15mo | $125,000 | $141 | 64 |
| 1401 Mccary St | 0.41mi | 3/1.0 (+1) | 888 (+3%) | 19mo | $120,900 | $136 | 55 |
| 1541 Dennison Ave | 0.73mi | 3/1.0 (+1) | 864 (0%) | 11mo | $55,000 | $64 | 52 |
| 28 24th Ave S | 0.55mi | 2/1.0 | 803 (-7%) | 18mo | $90,000 | $112 | 47 |
| 2031 S Center St | 0.65mi | 2/1.0 | 814 (-6%) | 20mo | $98,000 | $120 | 43 |
| 2345 Center Way S | 0.54mi | 3/1.0 (+1) | 777 (-10%) | 14mo | $51,500 | $66 | 42 |
Match score weights: distance 35% · size 25% · config 20% · recency 20%. Top-matched comps best support the ARV.
Projected returns pro-forma
-3.0% appreciation · 0.0% rent growth · sell at horizon
- IRR
- -6.3%
- Equity multiple
- 0.77×
- Total profit
- $-6,353
- Equity at exit
- $14,895
- IRR
- -0.6%
- Equity multiple
- 0.96×
- Total profit
- $-1,055
- Equity at exit
- $8,638
Cash invested: $27,972 (down + closing). Projections, not guarantees.
Landlord ↔ Tenant lean methodology
- Overall (STATE)
- 90 Strongly Landlord-Friendly
- State Alabama
- 90 Strongly Landlord-Friendly · R+15
- County
- — inherits STATE
- City
- — inherits STATE
ZIP-level market 35211
- Rents YoY
- -0.0%
- Active inventory
- 154
- Price-to-rent
- 7.7×
Monthly cashflow live
- Estimated rent
- $1,081 high interval (Pro) →
- Mortgage (P&I)
- −$524
- Tax from tax record
- −$84 /mo · $1,009/yr
- Insurance
- −$42
- HOA
- −$0
- Vacancy / Maint / Mgmt
- −$227
- Net cashflow
- $204
Break-even live
Sensitivity live
| Price | -10% $261 | -5% $233 | +0% $204 | +5% $176 | +10% $148 |
|---|---|---|---|---|---|
| Rent | -10% $119 | -5% $162 | +0% $204 | +5% $247 | +10% $290 |
| Rate | -1.0pp $255 | -0.5pp $230 | base $204 | +0.5pp $178 | +1.0pp $152 |
UW: 25.0% down · 7.5% · 30yr · 1.5% tax · 5.0% vac · 8.0% maint · 8.0% mgmt
Financing live
Cash to close
- Down payment
- $24,975
- Closing costs
- $2,997
- Reserves months
- —
- Total cash needed
- —
Loan-product check · same deal, 3 products live
Conventional
25% down · 7.5% · 30yr
- Down + closing
- —
- Monthly P&I
- —
- Monthly cashflow
- —
- DSCR
- —
- Eligible?
- —
Personal DTI + credit; lowest rate.
DSCR
20% down · 8.5% · 30yr
- Down + closing
- —
- Monthly P&I
- —
- Monthly cashflow
- —
- DSCR
- —
- Eligible?
- —
No personal income docs; deal must DSCR.
Hard money
10% down · 12.0% · 12mo
- Down + closing
- —
- Monthly P&I
- —
- Monthly cashflow
- —
- DSCR
- —
- Eligible?
- —
Short-term bridge; refi at stabilization.
Rent comps 36 comps
| Address | Beds | Baths | Sqft | Rent | $/sqft | DOM | Units | Dist |
|---|---|---|---|---|---|---|---|---|
| 700 Aspen Dr Birmingham, AL | 1.0 | 1.0 | 786 | $1,045 | $1.33 | 45d | 1 | 0.22mi |
| 401 Skyview Dr Birmingham, AL | 2.0 | 1.0 | 864 | $950 | $1.10 | 45d | 1 | 0.35mi |
| 218 Olympia Dr Homewood, AL | 1.0–3.0 | 1.0–2.5 | 958 | $1,190 | $1.24 | 3d | 33 | 0.47mi |
| 1508 Dennison Ave SW Birmingham, AL | 2.0 | 1.0 | 924 | $890 | $0.96 | 45d | 1 | 0.60mi |
| 2418 Green Springs Hwy Birmingham, AL | 1.0 | 1.0 | 750 | $895 | $1.19 | 45d | 5 | 0.69mi |
| 1332 15th Pl SW Birmingham, AL | 2.0 | 1.0 | 1115 | $950 | $0.85 | 4d | 1 | 0.71mi |
| 2217-2249 Green Springs Hwy Unit 2249-E Birmingham, AL | 2.0 | 1.0 | 900 | $910 | $1.01 | 45d | 1 | 0.85mi |
| 2217-2249 Green Springs Hwy Unit 2241-M Birmingham, AL | 3.0 | 2.0 | 1100 | $1,109 | $1.01 | 23d | 1 | 0.85mi |
| 1233 15th Way SW Birmingham, AL | 3.0 | 1.0 | 1119 | $1,050 | $0.94 | 45d | 1 | 0.86mi |
| 741 Center Pl SW Birmingham, AL | 3.0 | 1.0 | 1101 | $1,250 | $1.14 | 17d | 1 | 0.88mi |
| 120 Vulcan Rd Unit 1Apartment Birmingham, AL | 1.0 | 1.0 | 1000 | $1,800 | $1.80 | 25d | 1 | 0.90mi |
| 2049 Green Springs Hwy Unit 2 Birmingham, AL | 1.0 | 1.0 | 605 | $750 | $1.24 | 45d | 1 | 1.03mi |
| 261 3rd Ave SW Birmingham, AL | 1.0–2.0 | 1.0 | 634 | $850 | $1.34 | 4d | 14 | 1.04mi |
| 2700 Temple Crest Dr Birmingham, AL | 1.0–2.0 | 1.0–1.5 | 776 | $1,320 | $1.70 | 45d | 1 | 1.10mi |
| 916 14th St SW Unit F Birmingham, AL | 2.0 | 1.0 | 800 | $800 | $1.00 | 13d | 1 | 1.12mi |
| 916 14th St SW Unit A Birmingham, AL | 2.0 | 1.0 | 870 | $800 | $0.92 | 25d | 1 | 1.12mi |
| 916 14th St SW Unit F Birmingham, AL | 2.0 | 1.0 | 870 | $800 | $0.92 | 45d | 1 | 1.12mi |
| 914 14th St SW Unit B Birmingham, AL | 1.0 | 1.0 | 577 | $700 | $1.21 | 25d | 1 | 1.13mi |
| 914 14th St SW Unit B Birmingham, AL | 1.0 | 1.0 | 580 | $600 | $1.03 | 13d | 1 | 1.13mi |
| 914 14th St SW Unit A Birmingham, AL | 1.0 | 1.0 | 577 | $600 | $1.04 | 25d | 1 | 1.13mi |
| 316 Beacon Crest Ln Birmingham, AL | 1.0–2.0 | 1.0 | 850 | $1,099 | $1.29 | 3d | 7 | 1.14mi |
| 1010 Beacon Pkwy E Birmingham, AL | 1.0–2.0 | 1.0–2.0 | 945 | $2,275 | $2.41 | 3d | 18 | 1.19mi |
| 407 Green Springs Ave S Birmingham, AL | 2.0 | 1.0 | 866 | $2,000 | $2.31 | 3d | 1 | 1.20mi |
| 840 Beacon Pkwy E Unit C Birmingham, AL | 2.0 | 1.0 | 925 | $1,200 | $1.30 | 45d | 1 | 1.23mi |
| 925 Beacon Pkwy E Birmingham, AL | 1.0–3.0 | 1.0–2.0 | 1259 | $974 | $0.77 | 45d | 1 | 1.24mi |
| 513 Valley Ave Birmingham, AL | 3.0 | 1.0–2.0 | 1012 | $1,233 | $1.22 | 45d | 1 | 1.27mi |
| 1000 Beacon Pkwy E Unit 1035D Birmingham, AL | 1.0 | 1.0 | 750 | $975 | $1.30 | 45d | 1 | 1.28mi |
| 1100 Cotton Ave SW Unit b Birmingham, AL | 2.0 | 1.5 | 816 | $988 | $1.21 | 45d | 1 | 1.28mi |
| 195 Oxmoor Rd Birmingham, AL | 2.0–3.0 | 2.0–2.5 | 1187 | $2,350 | $1.98 | 4d | 8 | 1.33mi |
| 306 Columbiana Rd Unit 308 B Birmingham, AL | 2.0 | 1.0 | 1000 | $865 | $0.86 | 13d | 1 | 1.37mi |
| 834 Golden Gate Ln Birmingham, AL | 1.0–3.0 | 1.0–2.0 | 1050 | $1,175 | $1.12 | 45d | 12 | 1.41mi |
| 834 Golden Gate Ln Birmingham, AL | 1.0–3.0 | 1.0–2.0 | 1050 | $1,150 | $1.10 | 3d | 13 | 1.41mi |
| 741 Barcelona Ct Birmingham, AL | 1.0 | 1.0 | 699 | $950 | $1.36 | 4d | 5 | 1.44mi |
| 1520 17th Way SW Birmingham, AL | 3.0 | 1.0 | 900 | $900 | $1.00 | 23d | 1 | 1.44mi |
| 1520 17th Way SW Birmingham, AL | 3.0 | 1.0 | 900 | $900 | $1.00 | 13d | 1 | 1.44mi |
| 1229 Beacon Pkwy E Birmingham, AL | 1.0–3.0 | 1.0–2.0 | 1130 | $1,088 | $0.96 | 4d | 16 | 1.46mi |
Listing history 10 events
-
2024-12-02soldstatus $99,900
-
2024-10-21status Pending
-
2024-10-04$99,900 Active
-
2024-05-15historical $1,100
-
2024-04-23$1,100
-
2021-12-27soldstatus $65,000
-
2021-12-23soldstatus $65,000 Sold 363-char remark
Show marketing remark (363 chars)
Attention investors! This is a great investment opportunity! This home is currently rented section 8 for $750 per month which means income right away! This features 3 bedrooms, 1 bath, eat in kitchen, front porch and a fenced in back yard. This one won't last long as with 100% Section 8 you don't have to worry about from where or when your rent check is coming.
-
2021-11-18historical Contingent 363-char remark
Show marketing remark (363 chars)
Attention investors! This is a great investment opportunity! This home is currently rented section 8 for $750 per month which means income right away! This features 3 bedrooms, 1 bath, eat in kitchen, front porch and a fenced in back yard. This one won't last long as with 100% Section 8 you don't have to worry about from where or when your rent check is coming.
-
2021-11-09$64,900 Active 363-char remark
Show marketing remark (363 chars)
Attention investors! This is a great investment opportunity! This home is currently rented section 8 for $750 per month which means income right away! This features 3 bedrooms, 1 bath, eat in kitchen, front porch and a fenced in back yard. This one won't last long as with 100% Section 8 you don't have to worry about from where or when your rent check is coming.
-
2004-11-18soldstatus $49,000
ⓘ Source: listings_history table (triggers on properties + properties_extension) + one-shot
backfill from property_details.listing_events for pre-trigger history.
Tax reassessment forecast AL · Resets to sale price
- Current annual tax
- $1,009 · $84/mo
- Projected year-2 tax
- $1,009 · $84/mo
- Expected delta
- $0/yr ($0/mo · 0.0%)
ⓘ Screening estimate from a state-policy table — verify with the county assessor before closing.
Climate risk First Street
- Flood 1/10 Low FEMA zone X (unshaded) · 0% chance over 30 yrs
- Wildfire 1/10 Low
- Heat 7/10 Severe 7 d/yr ≥105°F today · 19 d/yr by 30 yrs out
- Wind 6/10 Major 27% chance of damaging wind over 30 yrs
- Air quality 4/10 Moderate 6 unhealthy d/yr today · 8 by 30 yrs out
Nearby sold comps map
Loading sold comps map…
Walkable amenities ~0.75 mi
Loading nearby amenities…
Taxation est. · year 1
- Rental income
- $12,971
- − Mortgage interest
- −$5,596
- − Property taxes
- −$1,009
- − Insurance
- −$500
- − Repairs & maintenance
- −$1,038
- − Management
- −$1,038
- − Depreciation
- −$2,906
- Taxable income
- $885
- Est. tax owed @ 24.0%
- −$212
- After-tax cash flow
- $2,239/yr
For passive investors: Depreciation is non-cash, so a rental often shows a tax loss while cash-flowing — sheltering income. Rental losses are passive: they offset passive income freely, and up to $25,000/yr can offset ordinary (W-2) income if you actively participate and your MAGI is under $100k (phasing out to $0 by $150k); unused losses carry forward. On sale, claimed depreciation is recaptured at up to 25%, and gains may owe capital-gains tax (a 1031 exchange can defer both). Figures are a year-1 estimate at your 24.0% rate — not tax advice; consult a CPA.
Schools (NCES district)
- District
- Birmingham City
- NCES district ID
- 0100390
- Math proficiency
- 4% ▼ -17.00%
- Reading proficiency
- 20% ▼ -4.00%
- Median HH income
- $31,988
- Composite
- 9.49/100
- National rank
- #9850
- State rank
- #116 of 129 in AL
Livability — Birmingham
- Score
- 67/100
- State rank
- #78
- US rank
- #10412
Category grades
Schools grade is shown separately in the Schools card above.
Census & demographics
- Census place
- Birmingham, AL
- County
- Jefferson County · 527,445 people
- City population
- 210,422
- Metro
- Birmingham-Hoover, AL
- Population (ZIP)
- 24,924
- Household income
- $34,884
- Rent vs Own
- Severe rent burden
- 2161.0
Population outlook (Jefferson County) Hauer SSP2
- Today (2025)
- 669,185 people
- By 2030
- 669,694 · +0.1%
- By 2040
- 661,388 · -1.2%
- By 2050
- 643,086 · -3.9%
- By 2075
- 577,267 · -13.7%
- By 2100
- 474,758 · -29.1%
Race, ethnicity, and origin ACS 2023
- Neighborhood character
- Predominantly Black (77%)
- Race & ethnicity
- Black 77% White 10% Hispanic / Latino 10% Two or more races 4%
- Hispanic origin (detail)
- Mexican 7%
- Foreign-born
- 6% · Canada
- Languages at home
- 91% English-only · Spanish 8% French/Haitian/Cajun 1%
Political lean MEDSL · Jefferson
- 2024 margin
- D (+10.4) · D 54.6% · R 44.2% · Other 1.2%
- 2008→2024 swing
- +5.4pp toward D · 2008: 5.1pp · 2024: 10.4pp
- All cycles
- 2024: D+10.4 2020: D+13.2 2016: D+7.2 2012: D+6.0 2008: D+5.1
Not yet ingested
- Civics
- —
Market trends
- HPI YoY
- ▼ -49.29%
- Current HPI
- 91.2903
- Rent YoY
- ▬ -0.01%
- Metro
- Birmingham-Hoover, AL
- State GDP YoY
- ▲ 2.94%
- F500 in state
- 4
Industry mix (Fortune 500 HQ in AL)
| Industry | F500 HQs | Revenue |
|---|---|---|
| Financial Services | 1 | $8B |
|
||
| Healthcare | 1 | $5B |
|
||
Price history
+103.9% since first listed10 events — show timeline
- 2024-12-02 Sold (Public Records) $99,900 Public Records
- 2024-10-21 Pending — Greater Alabama MLS
- 2024-10-04 Listed $99,900 Greater Alabama MLS
- 2024-05-15 Rental Removed $1,100 APPFOLIO
- 2024-04-23 Listed for Rent $1,100 APPFOLIO
- 2021-12-27 Sold (Public Records) $65,000 Public Records
- 2021-12-23 Sold (MLS) $65,000 Greater Alabama MLS
- 2021-11-18 Contingent — Greater Alabama MLS
- 2021-11-09 Listed $64,900 Greater Alabama MLS
- 2004-11-18 Sold (Public Records) $49,000 Public Records
Property tax history
+10.4%/yrLatest (2025): $1,009 · +0.0% YoY. Source: county tax records.
Cash-flow waterfall
monthlySold comps — $/sqft
last 12 mo · ≤1 miLoading sold comps…