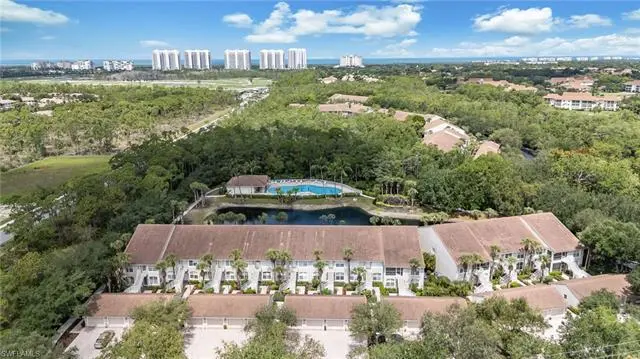
14515 Grey Fox Run #110 · Bonita Springs, FL
Flood risk 7/10 · Major
- FEMA flood zone
- X (shaded)
- Chance of flooding over 30 yrs
- 0.75%
- Est. flood insurance / yr
- $507 – $1,088
Fire risk 3/10 · Minor
- Est. fire insurance / yr
- $947 – $1,759
Heat risk 10/10 · Severe
- Hot days now (above 107°F)
- 7 days/yr
- Hot days in 30 yrs
- 29 days/yr
Wind risk 10/10 · Severe
- Chance of severe wind over 30 yrs
- 99.0%
Air-quality risk 2/10 · Minimal
- Unhealthy air days now
- 1 days/yr
- Unhealthy air days in 30 yrs
- 1 days/yr
Risk factors via First Street. Map © Google.
Why this score? — see what drove the C- grade
The composite is a weighted blend of 9 inputs, each scored 0–100. Each bar is that input's sub-score; the figure is the points it added to the 100-point composite (weight × sub-score).
- Cash flow +20.5/30.0
- ARV discount +7.5/15.0
- 1% rule +6.8/10.0
- DSCR +6.5/10.0
- Schools +5.0/10.0
- Livability +3.5/5.0
- Condition / age +2.5/5.0
- Rent growth +2.2/5.0
- Appreciation +0.0/10.0
$410,000
🖨 Deal sheet 📄 Offer letter ✓ Due diligence
Listing remarks MLS
JUST REDUCED - ANOTHER - $10,000 - HIGHLY SOUGHT AFTER IS THIS BEAUTIFUL 2ND FLOOR CONDO UNIT WITH THE BEST VIEW IN THE COMPLEX WITH A WESTERN EXPOSURE OF THE POOL, POND, WATERFALL, FOUNTAIN, AND PRESERVE AREA. HIGH GLOSS CABINETS AND CORIAN COUNTER TOPS WITH HURRICANE SHUTTERS AND BRAND NEW FRIDGE AND WATER HEATER. EXCELLENT AREA CLOSE TO SCHOOLS, CHURCHES, MALLS, AND BEACHES. IMPECCABLE LANDSCAPING THROUGHOUT THIS COMMUNITY FOR AWESOME WALKS.
Key facts
- Lake views
- Waterfall backdrop
- Detached garage
Tags
Property features AI
Finance
- Other: Part of Falling Waters North Preserve development; Unit number 110 in the subdivision; Complex contains 90 units; building has 18 units and 1 floor; 2 units per floor
- HOA & community: Quarterly condo fee; Professional management; Community amenities include clubhouse, community pool, streetlights, and underground utilities; Maintenance covers insurance, irrigation water, lawn/land maintenance, legal/accounting, exterior pest control, recreation facilities, repairs, reserves, security, street lights, street maintenance, trash removal, and water; Community type: Gated; Total annual recurring fees $8,800; One-time fees $150
Exterior
- Parking: Deeded parking; Paved driveway; Guest parking; Detached 1-car garage
- Security: Gated community; Entry keypad; Electric shutters
- Utilities: Central water; Central sewer; Cable available
- Home design: Residential property; Low-rise (1-3) building; Florida-style design; Rear exposure facing west; Built in 1999
- Construction: Concrete block construction; Stucco exterior; Tile roof; Foundation information not specified
- Exterior features: Lake and water feature views; Water display; Central irrigation; Private road
Interior
- Kitchen: Pantry; Cooktop (electric); Self-cleaning oven; Range; Dishwasher; Disposal; Refrigerator/freezer
- Bedrooms: 2 bedrooms with a split layout
- Flooring: Carpet; Tile
- Bathrooms: 2 full bathrooms; Master bath with dual sinks and separate tub and shower
- Heating & cooling: Central electric heat; Central electric cooling
- Interior features: Built-in cabinets; Cable prewire; French doors; High-speed internet available; Laundry tub; Volume ceilings; Great room floor plan; Three ceiling fans; Furnished
- Laundry & utility: Laundry in residence; Washer; Dryer; Laundry tub; Auto garage door
Neighborhood map
What this means for you Summary
Snapshot
- This is a 2-bed/2.0-bath condo listed at $410k.
Deal economics
- At list price, monthly cash flow is $470 ($6k/yr) — positive.
- The deal already cash-flows at list — no discount required.
- Meets the 1% rule at list price ($5k rent vs $410k).
- Cap rate 7.9% vs local median 1.7% in Bonita Springs — top-decile yield for the area; either an underpriced asset or a hidden risk that comps aren't pricing in. Stress-test before assuming the spread holds.
Location & tenants
- Location reads 70/100 on livability (#428 in FL) — a middle-class / working-renter tenant base. Strengths: crime A+, housing A+, employment A; Watch: schools C-, cost of living C-, health & safety D.
- Collier (suburban): math 60% / reading 56% proficiency, ranked #16 of 73 in FL (top 22%) — acceptable for families but not a draw, mixed tenant base, ~2y average lease.
- Market conditions: Rents soft (-1.1%/yr); 595 active listings in the ZIP; 40 comparable units currently listed for rent nearby; rentals at typical pace (median 24d on market — plan ~3-4 weeks tenant-placement turnaround); solid renter incomes; 3,520 units permitted in Collier County in 2024 (959 in 5+ unit buildings).
- At $4,846/mo this rent would consume 60% of the median local household income ($98k/yr) (locally 1006% of renters already pay >50% of income on rent) — very limited rent-growth headroom before tenants either downsize or default.
Forward outlook
- Local home prices are declining (-3.0%/yr); year-one equity from $3k of loan paydown is wiped out by about $12k of value loss. Plan a longer hold.
- Collier County population projected at +30% by 2050 — long-run rental-demand tailwind backs the buy-and-hold thesis.
Negotiation context
- Only 1 days on market — expect competitive offers; lowballing is unlikely to land.
- 3 sale attempts since 14y ago with the ask held roughly flat each time — persistent listings suggest the price (not the market) is what's stuck; bring a comps-based counter.
- Current owner paid $232k; list at $410k implies a 77% gain — meaningful room to come down on a strong offer.
Risks & watch-outs
- Watch-outs: flood insurance adds $66/mo.
- Climate carrying-cost: major flood risk; severe wind risk, 99% chance of damaging wind over 30y; extreme-heat days projected 7→29/yr by 2055 (HVAC capex compounding) — expect insurance premiums to compound above CPI over the hold.
Questions for the listing agent
- What's the actual annual flood-insurance premium (NFIP or private), and is the property in a SFHA with mandatory coverage?
- What does the HOA fee cover, when was the last increase, and are there any pending special assessments or reserve-fund shortfalls?
- Any open or pending special assessments — roof, HVAC, plumbing, elevator, façade? What's the per-unit balance and payoff schedule, and is the seller paying it off at close or rolling it to the buyer?
- Is there a deadline driving the sale (1031 exchange, divorce, estate, relocation)? That informs how much negotiation room exists.
- What's the average days-on-market for RENTAL listings here right now (not sales)? A rising rental-DOM trend means longer vacancies and softer asking-rent achievability than the comps imply.
- What's the recent tenant-quality profile in this submarket — average credit score on applications, eviction rate, late-payment / NSF rate, and stable-employment percentage? A property-management company in the area should have these aggregated.
- How much new apartment / multifamily construction is in the pipeline within 1–3 miles? Heavy new supply (>2% of stock underway) typically softens rents 12–24 months out; light construction supports rent growth.
Investment metrics
- 1% rule
- 1.18% ✓
- Cap rate
- 7.86%
- Cash-on-cash
- 5.61%
- DSCR
- 1.25
- GRM
- 7.1
CMA / ARV
No comps found within radius.
Projected returns pro-forma
-3.0% appreciation · 0.0% rent growth · sell at horizon
- IRR
- -12.6%
- Equity multiple
- 0.56×
- Total profit
- $-50,292
- Equity at exit
- $61,132
- IRR
- -9.9%
- Equity multiple
- 0.49×
- Total profit
- $-58,500
- Equity at exit
- $35,449
Cash invested: $114,800 (down + closing). Projections, not guarantees.
Landlord ↔ Tenant lean methodology
- Overall (STATE)
- 87 Strongly Landlord-Friendly
- State Florida
- 87 Strongly Landlord-Friendly · R+3
- County
- — inherits STATE
- City
- — inherits STATE
ZIP-level market 34110
- Rents YoY
- -1.1%
- Active inventory
- 595
- Price-to-rent
- 7.1×
Monthly cashflow live
- Estimated rent
- $4,846 high interval (Pro) →
- Mortgage (P&I)
- −$2,150
- Tax from tax record
- −$237 /mo · $2,848/yr
- Insurance
- −$171
- Flood insurance flood zone
- −$66 /mo · $798/yr
- HOA
- −$733
- Vacancy / Maint / Mgmt
- −$1,018
- Net cashflow
- $470
Break-even live
UW: 25.0% down · 7.5% · 30yr · 1.5% tax · 5.0% vac · 8.0% maint · 8.0% mgmt
Financing live
Cash to close
- Down payment
- $102,500
- Closing costs
- $12,300
- Reserves months
- —
- Total cash needed
- —
Loan-product check · same deal, 3 products live
Conventional
25% down · 7.5% · 30yr
- Down + closing
- —
- Monthly P&I
- —
- Monthly cashflow
- —
- DSCR
- —
- Eligible?
- —
Personal DTI + credit; lowest rate.
DSCR
20% down · 8.5% · 30yr
- Down + closing
- —
- Monthly P&I
- —
- Monthly cashflow
- —
- DSCR
- —
- Eligible?
- —
No personal income docs; deal must DSCR.
Hard money
10% down · 12.0% · 12mo
- Down + closing
- —
- Monthly P&I
- —
- Monthly cashflow
- —
- DSCR
- —
- Eligible?
- —
Short-term bridge; refi at stabilization.
Rent comps 40 comps
| Address | Beds | Baths | Sqft | Rent | $/sqft | DOM | Units | Dist |
|---|---|---|---|---|---|---|---|---|
| 1025 Tarpon Cove Dr #203 Naples, FL | 2.0 | 2.0 | 1225 | $5,500 | $4.49 | 14d | 1 | 0.11mi |
| 975 Tarpon Cove Dr #204 Naples, FL | 3.0 | 2.0 | 1340 | $5,500 | $4.10 | 14d | 1 | 0.25mi |
| 784 Carrick Bend Cir #101 Naples, FL | 3.0 | 2.0 | 1515 | $3,500 | $2.31 | 23d | 1 | 0.28mi |
| 817 Carrick Bend Cir #101 Naples, FL | 3.0 | 2.0 | 1660 | $5,995 | $3.61 | 14d | 1 | 0.30mi |
| 1130 Turtle Creek Blvd Naples, FL | 1.0–2.0 | 1.0–2.0 | 800 | $2,145 | $2.68 | 14d | 22 | 0.39mi |
| 953 Bunker Hill Dr Naples, FL | 2.0 | 2.0 | 1100 | $3,200 | $2.91 | 14d | 1 | 0.55mi |
| 526 Lake Louise Cir Unit 4-403 Naples, FL | 3.0 | 2.0 | 1740 | $6,500 | $3.74 | 23d | 1 | 0.56mi |
| 1337 Center Ln Naples, FL | 3.0 | 2.0 | 1500 | $4,300 | $2.87 | 23d | 1 | 0.64mi |
| 757 Wiggins Lake Dr #106 Naples, FL | 3.0 | 2.0 | 1374 | $6,000 | $4.37 | 14d | 1 | 0.68mi |
| 757 Wiggins Lake Dr #106 Naples, FL | 3.0 | 2.0 | 1374 | $6,000 | $4.37 | 23d | 1 | 0.68mi |
| 1250 Silverstrand Dr Naples, FL | 3.0 | 2.0 | 1848 | $5,000 | $2.71 | 23d | 1 | 0.69mi |
| 760 Wiggins Lake Dr #205 Naples, FL | 2.0 | 2.0 | 1179 | $5,500 | $4.66 | 23d | 1 | 0.70mi |
| 774 Wiggins Lake Dr #106 Naples, FL | 3.0 | 2.0 | 1374 | $6,500 | $4.73 | 23d | 1 | 0.70mi |
| 752 Wiggins Lake Dr #102 Naples, FL | 2.0 | 2.0 | 1402 | $2,375 | $1.69 | 21d | 1 | 0.71mi |
| 437 Wiggins Lake Ct #201 Naples, FL | 2.0 | 2.0 | 1283 | $4,500 | $3.51 | 23d | 1 | 0.76mi |
| 513 Lake Louise Cir #202 Naples, FL | 2.0 | 2.0 | 1444 | $5,300 | $3.67 | 23d | 1 | 0.77mi |
| 651 Wiggins Lake Dr #102 Naples, FL | 2.0 | 2.0 | 1487 | $6,500 | $4.37 | 23d | 1 | 0.78mi |
| 480 Bermuda Cove Way Unit 1-104 Naples, FL | 2.0 | 2.0 | 1372 | $4,250 | $3.10 | 23d | 1 | 0.79mi |
| 505 Lake Louise Cir #101 Naples, FL | 2.0 | 2.0 | 1444 | $5,500 | $3.81 | 23d | 1 | 0.83mi |
| 1390 Sweetwater Cv #203 Naples, FL | 2.0 | 2.0 | 1279 | $2,200 | $1.72 | 14d | 1 | 0.85mi |
| 360 Horse Creek Dr Naples, FL | 2.0 | 2.0 | 1589 | $5,250 | $3.30 | 14d | 4 | 0.88mi |
| 1360 Sweetwater Cv #202 Naples, FL | 2.0 | 2.0 | 1279 | $5,500 | $4.30 | 23d | 1 | 0.90mi |
| 1405 Sweetwater Cv #204 Naples, FL | 3.0 | 2.0 | 1381 | $6,000 | $4.34 | 23d | 1 | 0.90mi |
| 1405 Sweetwater Cv #204 Naples, FL | 3.0 | 2.0 | 1381 | $6,000 | $4.34 | 14d | 1 | 0.90mi |
| 1296 Grand Canal Dr Naples, FL | 3.0 | 2.0 | 1614 | $8,000 | $4.96 | 23d | 1 | 0.90mi |
| 1117 Sweetwater Ln #2201 Naples, FL | 2.0 | 2.0 | 1193 | $6,500 | $5.45 | 23d | 1 | 0.91mi |
| 340 Horse Creek Dr #304 Naples, FL | 2.0 | 2.0 | 1326 | $2,950 | $2.22 | 23d | 1 | 0.92mi |
| 1120 Sarah Jean Cir Unit B205 Naples, FL | 3.0 | 2.0 | 1370 | $2,300 | $1.68 | 14d | 1 | 0.93mi |
| 1415 Sweetwater Cv #104 Naples, FL | 3.0 | 2.0 | 1381 | $6,500 | $4.71 | 23d | 1 | 0.93mi |
| 1150 Yesica Ann Cir Unit A205 Naples, FL | 2.0 | 2.0 | 1300 | $6,000 | $4.62 | 14d | 1 | 0.93mi |
| 430 Cove Tower Dr #302 Naples, FL | 3.0 | 2.0 | 1623 | $6,500 | $4.00 | 23d | 1 | 0.94mi |
| 430 Cove Tower Dr #1202 Naples, FL | 3.0 | 2.0 | 1519 | $7,800 | $5.13 | 23d | 1 | 0.94mi |
| 1420 Sweetwater Cv #102 Naples, FL | 2.0 | 2.0 | 1279 | $5,000 | $3.91 | 21d | 1 | 0.95mi |
| 1420 Sweetwater Cv #102 Naples, FL | 2.0 | 2.0 | 1279 | $5,000 | $3.91 | 23d | 1 | 0.95mi |
| 1290 Yesica Ann Cir Unit G-105 Naples, FL | 2.0 | 2.0 | 1168 | $5,500 | $4.71 | 14d | 1 | 0.95mi |
| 1290 Yesica Ann Cir Unit G203 Naples, FL | 2.0 | 2.0 | 1245 | $6,000 | $4.82 | 14d | 1 | 0.95mi |
| 425 Cove Tower Dr #902 Naples, FL | 2.0 | 2.0 | 1854 | $9,400 | $5.07 | 23d | 1 | 0.96mi |
| 1190 Yesica Ann Cir Unit B101 Naples, FL | 2.0 | 2.0 | 1245 | $2,500 | $2.01 | 14d | 1 | 0.96mi |
| 1340 Sweetwater Cv #103 Naples, FL | 2.0 | 2.0 | 1279 | $5,000 | $3.91 | 23d | 1 | 0.97mi |
| 320 Horse Creek Dr #105 Naples, FL | 2.0 | 2.0 | 1326 | $5,600 | $4.22 | 23d | 1 | 0.97mi |
HOA detail condo
- Monthly dues
- $733 · $8,796/yr
- Likely covers
- watercablelandscapingpool
- Assessments
- None detected in remarks — confirm with the listing agent.
Listing history 2 events
-
2026-06-18remarks 699-char remark
-
2026-06-18$410,000 Active 1 DOM
ⓘ Source: listings_history table (triggers on properties + properties_extension) + one-shot
backfill from property_details.listing_events for pre-trigger history.
Tax reassessment forecast FL · Resets to sale price
- Current annual tax
- $2,848 · $237/mo
- Projected year-2 tax
- $3,403 · $284/mo
- Expected delta
- +$555/yr (+$46/mo · 19.5%)
ⓘ Screening estimate from a state-policy table — verify with the county assessor before closing.
Climate risk First Street
- Flood 7/10 Severe FEMA zone X (shaded) · 75% chance over 30 yrs
- Wildfire 3/10 Moderate
- Heat 10/10 Extreme 7 d/yr ≥107°F today · 29 d/yr by 30 yrs out
- Wind 10/10 Extreme 99% chance of damaging wind over 30 yrs
- Air quality 2/10 Low 1 unhealthy d/yr today · 1 by 30 yrs out
Nearby sold comps map
Loading sold comps map…
Walkable amenities ~0.75 mi
Loading nearby amenities…
Taxation est. · year 1
- Rental income
- $58,147
- − Mortgage interest
- −$22,966
- − Property taxes
- −$2,848
- − Insurance
- −$2,848
- − Repairs & maintenance
- −$4,652
- − Management
- −$4,652
- − HOA
- −$8,796
- − Depreciation
- −$11,927
- Taxable loss
- −$542
- Est. tax savings @ 24.0%
- +$130
- After-tax cash flow
- $5,773/yr
For passive investors: Depreciation is non-cash, so a rental often shows a tax loss while cash-flowing — sheltering income. Rental losses are passive: they offset passive income freely, and up to $25,000/yr can offset ordinary (W-2) income if you actively participate and your MAGI is under $100k (phasing out to $0 by $150k); unused losses carry forward. On sale, claimed depreciation is recaptured at up to 25%, and gains may owe capital-gains tax (a 1031 exchange can defer both). Figures are a year-1 estimate at your 24.0% rate — not tax advice; consult a CPA.
Schools (NCES district)
- District
- Collier
- NCES district ID
- 1200330
- Math proficiency
- 60% ▼ -4.00%
- Reading proficiency
- 56% ▼ -2.00%
- Median HH income
- $58,275
- Composite
- 50.23/100
- National rank
- #1892
- State rank
- #16 of 73 in FL
Livability — Bonita Springs
- Score
- 70/100
- State rank
- #428
- US rank
- #7576
Category grades
Schools grade is shown separately in the Schools card above.
Census & demographics
- County
- Collier County · 396,295 people
- City population
- 64,727
- Metro
- Naples-Marco Island, FL
- Population (ZIP)
- 25,630
- Household income
- $97,564
- Rent vs Own
- Severe rent burden
- 1006.0
Population outlook (Collier County) Hauer SSP2
- Today (2025)
- 420,858 people
- By 2030
- 450,054 · +6.9%
- By 2040
- 502,232 · +19.3%
- By 2050
- 544,932 · +29.5%
- By 2075
- 627,203 · +49.0%
- By 2100
- 659,015 · +56.6%
Race, ethnicity, and origin ACS 2023
- Neighborhood character
- Predominantly White (84%)
- Race & ethnicity
- White 84% Hispanic / Latino 10% Two or more races 9% Asian 2% Black 1%
- Hispanic origin (detail)
- Mexican 2% Puerto Rican 1% Cuban 3%
- Common ancestry
- Romanian 4% Lithuanian 3% Slovak 2%
- Foreign-born
- 11% · Canada, South Korea
- Languages at home
- 87% English-only · Spanish 7% Other Indo-European 3% French/Haitian/Cajun 1%
Political lean MEDSL · Collier
- 2024 margin
- Solid R (+33.1) · D 33.1% · R 66.2%
- 2008→2024 swing
- -10.6pp toward R · 2008: -22.5pp · 2024: -33.1pp
- All cycles
- 2024: R+33.1 2020: R+24.7 2016: R+26.0 2012: R+30.1 2008: R+22.5
Not yet ingested
- Civics
- —
Market trends
- HPI YoY
- ▼ -172.68%
- Current HPI
- 267.4644
- Rent YoY
- ▼ -1.06%
- Metro
- Naples-Marco Island, FL
- State GDP YoY
- ▲ 3.28%
- F500 in state
- 36
Industry mix (Fortune 500 HQ in FL)
| Industry | F500 HQs | Revenue |
|---|---|---|
| Industrial Technology | 2 | $29B |
|
||
| Insurance | 2 | $17B |
|
||
| Retail | 1 | $60B |
|
||
| Technology Distribution | 1 | $58B |
|
||
| Homebuilding | 1 | $35B |
|
||
| Technology Manufacturing | 1 | $35B |
|
||
Price history
-83.2% since first listed16 events — show timeline
- 2026-06-18 Listed $410,000 NAPLESMLS
- 2015-12-08 Price Changed $232,000 NAPLESMLS
- 2015-12-04 Sold (Public Records) $232,000 Public Records
- 2015-12-04 Sold (MLS) $232,000 NAPLESMLS
- 2015-11-12 Listing Removed — NAPLESMLS
- 2015-11-12 Price Changed $249,900 NAPLESMLS
- 2015-08-29 Price Changed $249,900 NAPLESMLS
- 2015-06-02 Price Changed $259,900 NAPLESMLS
- 2015-05-03 Price Changed $269,900 NAPLESMLS
- 2015-04-21 Listed $279,900 NAPLESMLS
- 2014-02-21 Sold (Public Records) $179,000 Public Records
- 2014-01-30 Sold (MLS) $179,000 NAPLESMLS
- 2014-01-30 Price Changed $189,900 NAPLESMLS
- 2012-12-16 Listed $179,000 NAPLESMLS
- 2000-03-16 Sold (Public Records) $134,700 Public Records
- 1998-10-16 Sold (Public Records) $2,435,500 Public Records
Property tax history
+5.4%/yrLatest (2025): $2,848 · -0.9% YoY. Source: county tax records.
Cash-flow waterfall
monthlySold comps — $/sqft
last 12 mo · ≤1 miLoading sold comps…