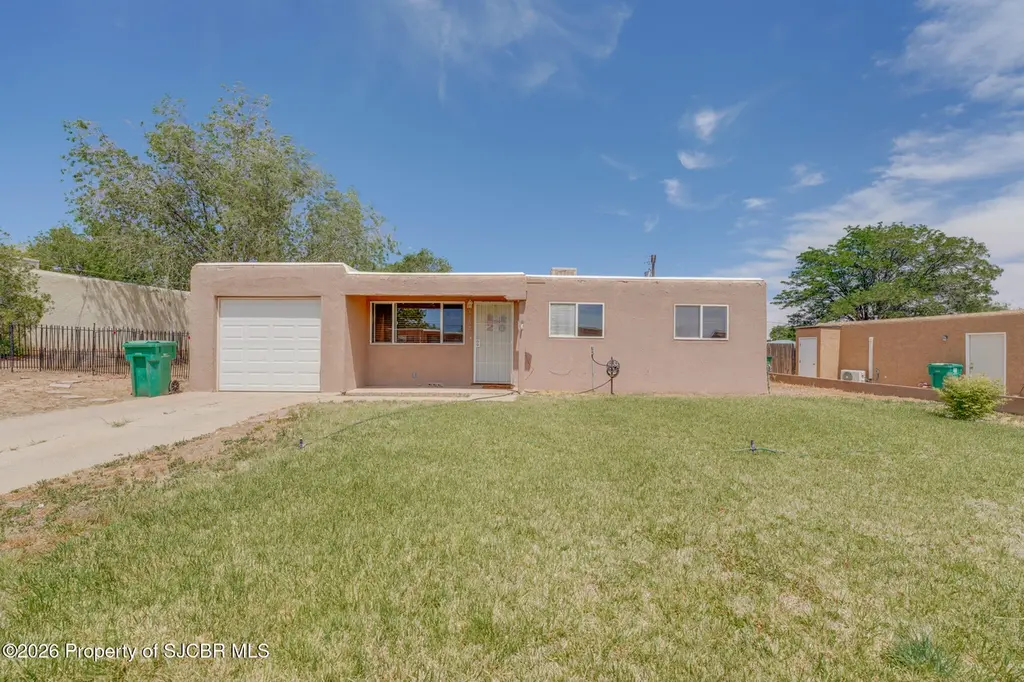
3902 Sierra Vista Dr · Farmington, NM
Flood risk 1/10 · Minimal
- FEMA flood zone
- X (unshaded)
- Chance of flooding over 30 yrs
- 0.0%
- Est. flood insurance / yr
- $507 – $1,088
Fire risk 3/10 · Minor
- Est. fire insurance / yr
- $706 – $1,312
Heat risk 4/10 · Minor
- Hot days now (above 93°F)
- 7 days/yr
- Hot days in 30 yrs
- 18 days/yr
Wind risk 1/10 · Minimal
- Chance of severe wind over 30 yrs
- —
Air-quality risk 1/10 · Minimal
- Unhealthy air days now
- 0 days/yr
- Unhealthy air days in 30 yrs
- 0 days/yr
Risk factors via First Street. Map © Google.
Why this score? — see what drove the C- grade
The composite is a weighted blend of 9 inputs, each scored 0–100. Each bar is that input's sub-score; the figure is the points it added to the 100-point composite (weight × sub-score).
- Cash flow +21.0/30.0
- ARV discount +7.5/15.0
- DSCR +6.7/10.0
- 1% rule +4.4/10.0
- Livability +3.3/5.0
- Schools +3.2/10.0
- Rent growth +2.5/5.0
- Condition / age +2.5/5.0
- Appreciation +0.0/10.0
$219,900
🖨 Deal sheet 📄 Offer letter ✓ Due diligence
Listing remarks
Comfortable 3-bedroom, 1-bath home featuring an eat-in kitchen with new appliances. Stacked washer and dryer included for added convenience. The landscaped front yard adds curb appeal, while the spacious backyard offers plenty of room to enjoy and personalize. A wonderful opportunity with comfortable indoor and outdoor living spaces.
Key facts
- Spacious backyard
- New appliances
- Eat-in kitchen
Tags
Property features AI
Exterior
- Parking: Attached garage (1 car)
- Home design: Single-family house; One story
- Construction: Stucco exterior
- Exterior features: Above-ground pool; Residential zoning; Subdivision: Highland View
Interior
- Bathrooms: 1 full bathroom
- Heating & cooling: Forced air heating (natural gas); Ceiling fan cooling
- Interior features: Pantry; Fireplace (1)
- Laundry & utility: Washer; Dryer
Neighborhood map
What this means for you Summary
Snapshot
- This is a 3-bed/1.0-bath single-family listed at $220k.
Deal economics
- At list price, monthly cash flow is $309 ($4k/yr) — positive.
- The deal already cash-flows at list — no discount required.
- To meet the 1% rule (rent ≥ 1% of price), the offer needs to be $206k (6.3% below list).
- Recommended offer: $206k (6.3% below list) — sets the bar for 1% rule.
Location & tenants
- Location reads 66/100 on livability (#38 in NM) — a middle-class / working-renter tenant base. Strengths: cost of living A+, housing A+, health & safety A+; Watch: employment C-, crime F, commute F.
- Farmington Municipal Schools (urban): math 23% / reading 43% proficiency, ranked #23 of 95 in NM (top 24%) — families likely to look elsewhere, expect single-tenant / working-renter base with shorter leases.
- Zoned schools: Mesa Verde Elementary (435 students, 44% FRL); Heights Middle School (718 students, 44% FRL); Piedra Vista High (math 27% / reading 52%, grade F, #68 of 110 statewide, top 62%, 1,578 students, 47% FRL) — zoned schools at 45% FRL track the district average.
- Market conditions: 89 active listings in the ZIP; 2 comparable units currently listed for rent nearby; 78 units permitted in San Juan County in 2024 (8 in 5+ unit buildings).
Forward outlook
- Local home prices are declining (-3.0%/yr); year-one equity from $2k of loan paydown is wiped out by about $7k of value loss. Plan a longer hold.
- San Juan County population projected at -51% by 2050 — secular population decline; favor cash flow + early exit over multi-decade hold.
Negotiation context
- It's been on market 21 days — a 2% lower offer ($217k) is reasonable based on typical stale-listing flexibility.
Risks & watch-outs
- Watch-outs: built in 1959 — expect roof / HVAC / electrical / plumbing capex.
Questions for the listing agent
- Built in 1959 — when were the roof, HVAC, electrical panel, plumbing, and water heater last replaced?
- Is there a deadline driving the sale (1031 exchange, divorce, estate, relocation)? That informs how much negotiation room exists.
- Schools are D-rated, which usually means shorter tenancies and higher turnover. Who's the typical renter profile here, and what's been the actual vacancy rate?
- Crime grade is F in this area — have there been break-ins, vandalism, or insurance claims at this property in the last 3 years? What carrier currently insures it and at what premium?
- What's the average days-on-market for RENTAL listings here right now (not sales)? A rising rental-DOM trend means longer vacancies and softer asking-rent achievability than the comps imply.
- What's the recent tenant-quality profile in this submarket — average credit score on applications, eviction rate, late-payment / NSF rate, and stable-employment percentage? A property-management company in the area should have these aggregated.
- How much new for-sale + rental construction is in the pipeline within 1–3 miles? Heavy new supply typically softens prices + rents 12–24 months out; constrained supply supports both.
Investment metrics
- 1% rule
- 0.94% ✗
- Cap rate
- 7.98%
- Cash-on-cash
- 6.03%
- DSCR
- 1.27
- GRM
- 8.9
CMA / ARV
No comps found within radius.
Projected returns pro-forma
-3.0% appreciation · 3.0% rent growth · sell at horizon
- IRR
- -7.0%
- Equity multiple
- 0.74×
- Total profit
- $-16,014
- Equity at exit
- $32,788
- IRR
- 2.5%
- Equity multiple
- 1.18×
- Total profit
- $11,060
- Equity at exit
- $19,013
Cash invested: $61,572 (down + closing). Projections, not guarantees.
Landlord ↔ Tenant lean methodology
- Overall (STATE)
- 55 Moderately Landlord-Leaning
- State New Mexico
- 55 Moderately Landlord-Leaning · D+3
- County
- — inherits STATE
- City
- — inherits STATE
ZIP-level market 87402
- Active inventory
- 89
- Price-to-rent
- 8.9×
Monthly cashflow live
- Estimated rent
- $2,060 medium interval (Pro) →
- Mortgage (P&I)
- −$1,153
- Tax from tax record
- −$73 /mo · $875/yr
- Insurance
- −$92
- HOA
- −$0
- Vacancy / Maint / Mgmt
- −$433
- Net cashflow
- $309
Break-even live
UW: 25.0% down · 7.5% · 30yr · 1.5% tax · 5.0% vac · 8.0% maint · 8.0% mgmt
Financing live
Cash to close
- Down payment
- $54,975
- Closing costs
- $6,597
- Reserves months
- —
- Total cash needed
- —
Loan-product check · same deal, 3 products live
Conventional
25% down · 7.5% · 30yr
- Down + closing
- —
- Monthly P&I
- —
- Monthly cashflow
- —
- DSCR
- —
- Eligible?
- —
Personal DTI + credit; lowest rate.
DSCR
20% down · 8.5% · 30yr
- Down + closing
- —
- Monthly P&I
- —
- Monthly cashflow
- —
- DSCR
- —
- Eligible?
- —
No personal income docs; deal must DSCR.
Hard money
10% down · 12.0% · 12mo
- Down + closing
- —
- Monthly P&I
- —
- Monthly cashflow
- —
- DSCR
- —
- Eligible?
- —
Short-term bridge; refi at stabilization.
Rent comps 2 comps
| Address | Beds | Baths | Sqft | Rent | $/sqft | DOM | Units | Dist |
|---|---|---|---|---|---|---|---|---|
| 5542 Cypress St Farmington, NM | 3.0 | 2.0 | 1276 | $2,400 | $1.88 | 43d | 1 | 0.77mi |
| 5200 Villa View Dr Unit 16C Farmington, NM | 2.0 | 2.5 | 1272 | $1,600 | $1.26 | 43d | 1 | 1.04mi |
Listing history 15 events
-
2026-06-19days on market $219,900 Active 21 DOM
-
2026-06-18days on market $219,900 Active 20 DOM
-
2026-06-17days on market $219,900 Active 19 DOM
-
2026-06-16days on market $219,900 Active 18 DOM
-
2026-06-15days on market $219,900 Active 17 DOM
-
2026-06-14days on market $219,900 Active 15 DOM
-
2026-06-12days on market $219,900 Active 14 DOM
-
2026-06-09days on market $219,900 Active 11 DOM
-
2026-06-08days on market $219,900 Active 10 DOM
-
2026-06-07days on market $219,900 Active 9 DOM
-
2026-06-05pricedays on market $219,900 Active 6 DOM
-
2026-06-02days on market $229,900 Active 4 DOM
-
2026-06-01days on market $229,900 Active 3 DOM
-
2026-05-31days on market $229,900 Active 2 DOM
-
2026-05-29$229,900 Active
ⓘ Source: listings_history table (triggers on properties + properties_extension) + one-shot
backfill from property_details.listing_events for pre-trigger history.
Tax reassessment forecast NM · Resets to sale price
- Current annual tax
- $875 · $73/mo
- Projected year-2 tax
- $1,759 · $147/mo
- Expected delta
- +$884/yr (+$74/mo · 101.0%)
ⓘ Screening estimate from a state-policy table — verify with the county assessor before closing.
Climate risk First Street
- Flood 1/10 Low FEMA zone X (unshaded) · 0% chance over 30 yrs
- Wildfire 3/10 Moderate
- Heat 4/10 Moderate 7 d/yr ≥93°F today · 18 d/yr by 30 yrs out
- Wind 1/10 Low
- Air quality 1/10 Low 0 unhealthy d/yr today · 0 by 30 yrs out
Nearby sold comps map
Loading sold comps map…
Walkable amenities ~0.75 mi
Loading nearby amenities…
Taxation est. · year 1
- Rental income
- $24,718
- − Mortgage interest
- −$12,318
- − Property taxes
- −$875
- − Insurance
- −$1,100
- − Repairs & maintenance
- −$1,977
- − Management
- −$1,977
- − Depreciation
- −$6,397
- Taxable income
- $73
- Est. tax owed @ 24.0%
- −$18
- After-tax cash flow
- $3,696/yr
For passive investors: Depreciation is non-cash, so a rental often shows a tax loss while cash-flowing — sheltering income. Rental losses are passive: they offset passive income freely, and up to $25,000/yr can offset ordinary (W-2) income if you actively participate and your MAGI is under $100k (phasing out to $0 by $150k); unused losses carry forward. On sale, claimed depreciation is recaptured at up to 25%, and gains may owe capital-gains tax (a 1031 exchange can defer both). Figures are a year-1 estimate at your 24.0% rate — not tax advice; consult a CPA.
Schools (NCES district)
- District
- Farmington Municipal Schools
- NCES district ID
- 3500990
- Math proficiency
- 23% —
- Reading proficiency
- 43% —
- Median HH income
- $51,365
- Composite
- 31.5/100
- National rank
- #11178
- State rank
- #23 of 95 in NM
Livability — Farmington
- Score
- 66/100
- State rank
- #38
- US rank
- #11926
Category grades
Schools grade is shown separately in the Schools card above.
Census & demographics
- Census place
- Farmington, NM
- City population
- 45,229
- Population (ZIP)
- 10,997
Population outlook (San Juan County) Hauer SSP2
- Today (2025)
- 95,201 people
- By 2030
- 84,154 · -11.6%
- By 2040
- 63,810 · -33.0%
- By 2050
- 46,929 · -50.7%
- By 2075
- 21,097 · -77.8%
- By 2100
- 9,410 · -90.1%
Race, ethnicity, and origin ACS 2023
- Neighborhood character
- Diverse neighborhood (Simpson 0.65)
- Race & ethnicity
- White 54% Hispanic / Latino 24% Native American 17% Two or more races 15%
- Hispanic origin (detail)
- Mexican 12%
- Common ancestry
- Italian 3% Slovak 2% Lithuanian 2%
- Foreign-born
- 2% · Canada
- Languages at home
- 87% English-only · Spanish 7% Russian/Polish/Slavic 1%
Political lean MEDSL · San Juan
- 2024 margin
- Solid R (+31.7) · D 33.0% · R 64.7% · Other 2.3%
- 2008→2024 swing
- -10.6pp toward R · 2008: -21.2pp · 2024: -31.7pp
- All cycles
- 2024: R+31.7 2020: R+28.3 2016: R+33.1 2012: R+28.5 2008: R+21.2
Not yet ingested
- Civics
- —
Market trends
- HPI YoY
- ▼ -117.39%
- Current HPI
- 207.275
- Rent YoY
- —
- Metro
- —
- State GDP YoY
- —
- F500 in state
- 0
Price history
1 event — show timeline
- 2026-05-29 Listed $229,900 SJCMLS
Property tax history
-0.1%/yrLatest (2025): $875 · -3.1% YoY. Source: county tax records.
Cash-flow waterfall
monthlySold comps — $/sqft
last 12 mo · ≤1 miLoading sold comps…